
|
|||||
|
 | |
| |
| |
| |
| |
| |
|
Gene: TRIM14 |
Gene summary for TRIM14 |
| Gene information | Species | Human | Gene symbol | TRIM14 | Gene ID | 9830 |
| Gene name | tripartite motif containing 14 | |
| Gene Alias | TRIM14 | |
| Cytomap | 9q22.33 | |
| Gene Type | protein-coding | GO ID | GO:0000209 | UniProtAcc | A0A024R165 |
Top |
Malignant transformation analysis |
| Identification of the aberrant gene expression in precancerous and cancerous lesions by comparing the gene expression of stem-like cells in diseased tissues with normal stem cells |
| Entrez ID | Symbol | Replicates | Species | Organ | Tissue | Adj P-value | Log2FC | Malignancy |
| 9830 | TRIM14 | CCI_2 | Human | Cervix | CC | 3.86e-03 | 5.85e-01 | 0.5249 |
| 9830 | TRIM14 | CCI_3 | Human | Cervix | CC | 5.15e-09 | 7.38e-01 | 0.516 |
| 9830 | TRIM14 | HTA11_347_2000001011 | Human | Colorectum | AD | 4.31e-12 | 5.40e-01 | -0.1954 |
| 9830 | TRIM14 | HTA11_83_2000001011 | Human | Colorectum | SER | 1.00e-02 | 2.96e-01 | -0.1526 |
| 9830 | TRIM14 | F007 | Human | Colorectum | FAP | 4.30e-02 | -2.85e-01 | 0.1176 |
| 9830 | TRIM14 | A015-C-203 | Human | Colorectum | FAP | 2.25e-08 | -2.36e-01 | -0.1294 |
| 9830 | TRIM14 | A014-C-040 | Human | Colorectum | FAP | 2.62e-02 | -3.40e-01 | -0.1184 |
| 9830 | TRIM14 | A002-C-201 | Human | Colorectum | FAP | 2.72e-06 | -2.62e-01 | 0.0324 |
| 9830 | TRIM14 | A001-C-119 | Human | Colorectum | FAP | 2.92e-03 | -2.88e-01 | -0.1557 |
| 9830 | TRIM14 | A001-C-108 | Human | Colorectum | FAP | 1.50e-06 | -2.37e-01 | -0.0272 |
| 9830 | TRIM14 | A002-C-205 | Human | Colorectum | FAP | 4.44e-09 | -3.02e-01 | -0.1236 |
| 9830 | TRIM14 | A001-C-104 | Human | Colorectum | FAP | 2.15e-06 | -2.63e-01 | 0.0184 |
| 9830 | TRIM14 | A015-C-006 | Human | Colorectum | FAP | 1.45e-03 | -2.17e-01 | -0.0994 |
| 9830 | TRIM14 | A015-C-106 | Human | Colorectum | FAP | 9.23e-05 | -1.37e-01 | -0.0511 |
| 9830 | TRIM14 | A002-C-114 | Human | Colorectum | FAP | 4.15e-07 | -2.88e-01 | -0.1561 |
| 9830 | TRIM14 | A015-C-104 | Human | Colorectum | FAP | 1.17e-09 | -2.21e-01 | -0.1899 |
| 9830 | TRIM14 | A001-C-014 | Human | Colorectum | FAP | 6.89e-06 | -2.21e-01 | 0.0135 |
| 9830 | TRIM14 | A002-C-016 | Human | Colorectum | FAP | 2.76e-11 | -2.50e-01 | 0.0521 |
| 9830 | TRIM14 | A015-C-002 | Human | Colorectum | FAP | 3.57e-03 | -2.66e-01 | -0.0763 |
| 9830 | TRIM14 | A001-C-203 | Human | Colorectum | FAP | 8.35e-07 | -2.11e-01 | -0.0481 |
| Page: 1 2 3 4 5 |
| Tissue | Expression Dynamics | Abbreviation |
| Cervix | 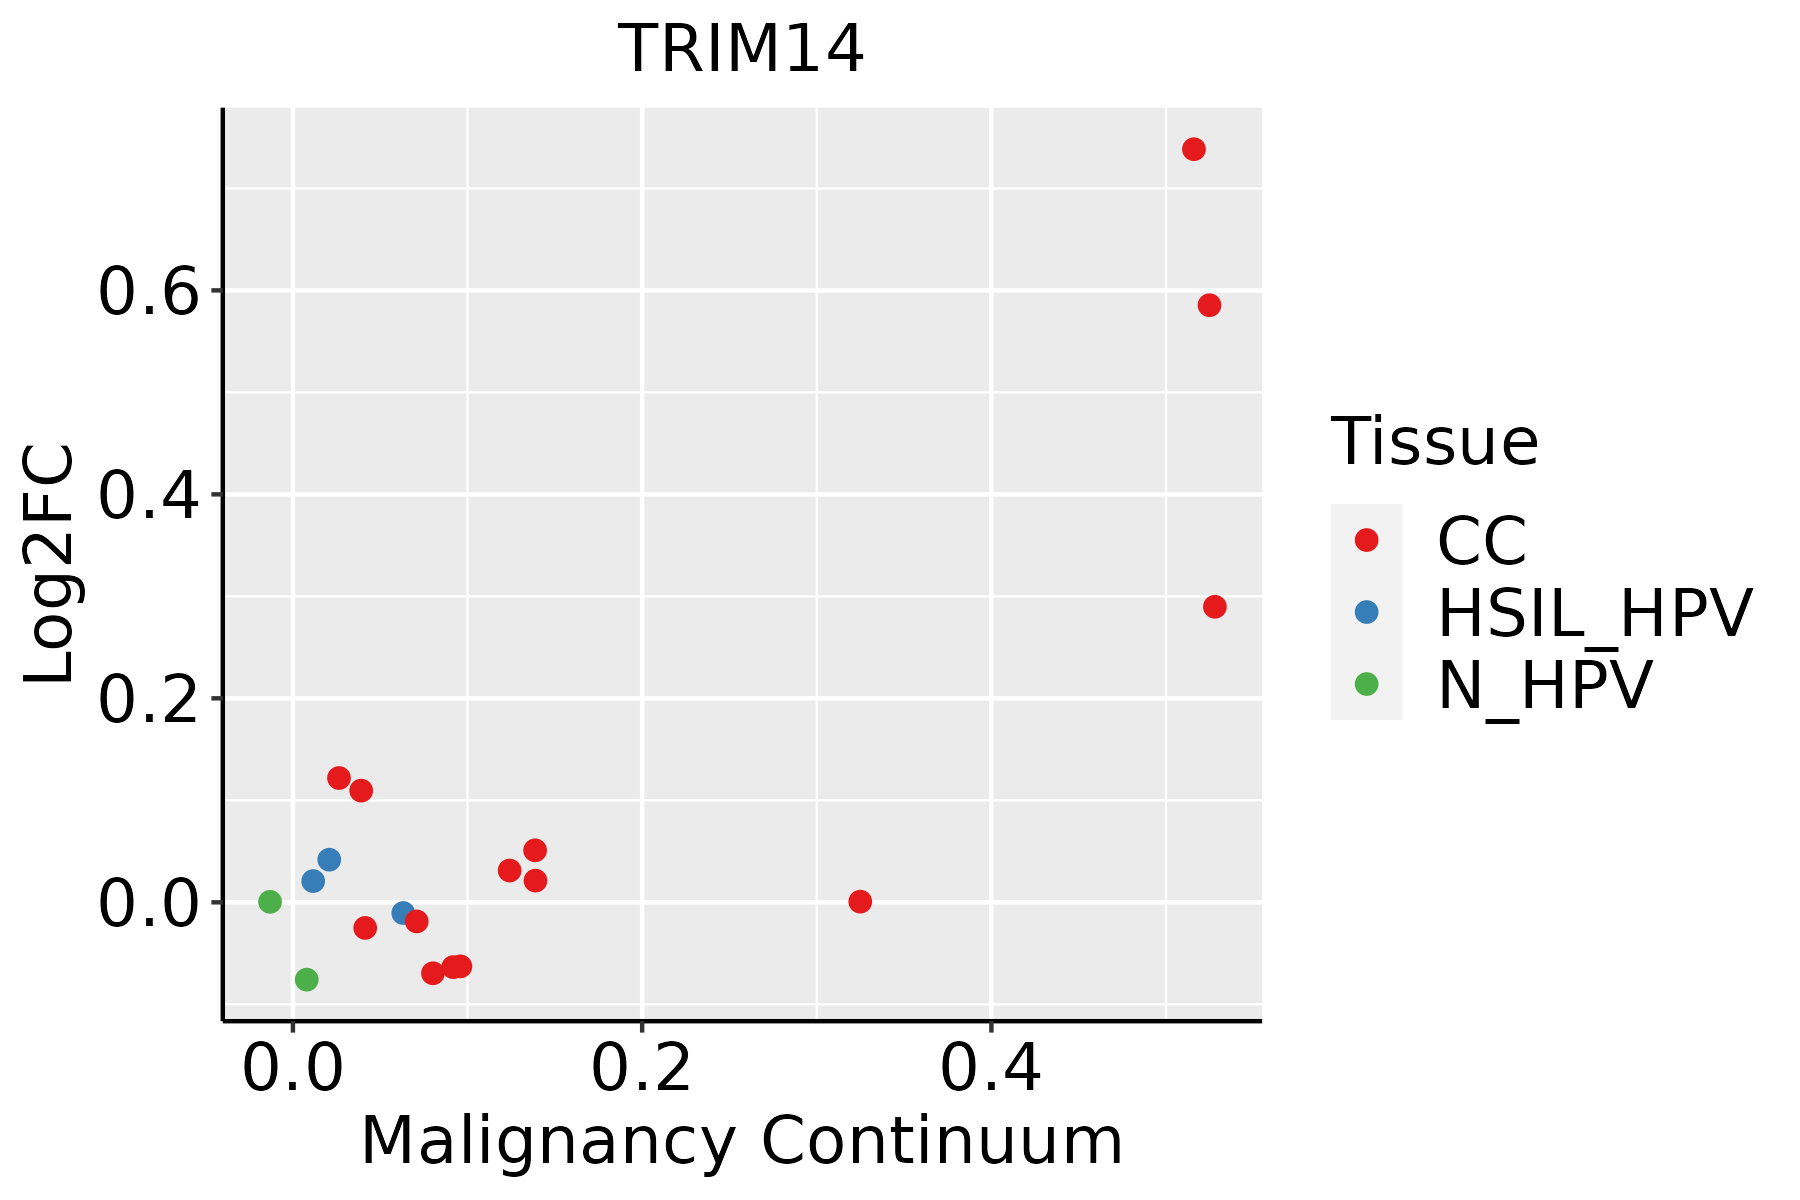 | CC: Cervix cancer |
| HSIL_HPV: HPV-infected high-grade squamous intraepithelial lesions | ||
| N_HPV: HPV-infected normal cervix | ||
| Colorectum (GSE201348) |  | FAP: Familial adenomatous polyposis |
| CRC: Colorectal cancer | ||
| Colorectum (HTA11) |  | AD: Adenomas |
| SER: Sessile serrated lesions | ||
| MSI-H: Microsatellite-high colorectal cancer | ||
| MSS: Microsatellite stable colorectal cancer | ||
| Esophagus |  | ESCC: Esophageal squamous cell carcinoma |
| HGIN: High-grade intraepithelial neoplasias | ||
| LGIN: Low-grade intraepithelial neoplasias | ||
| Liver | 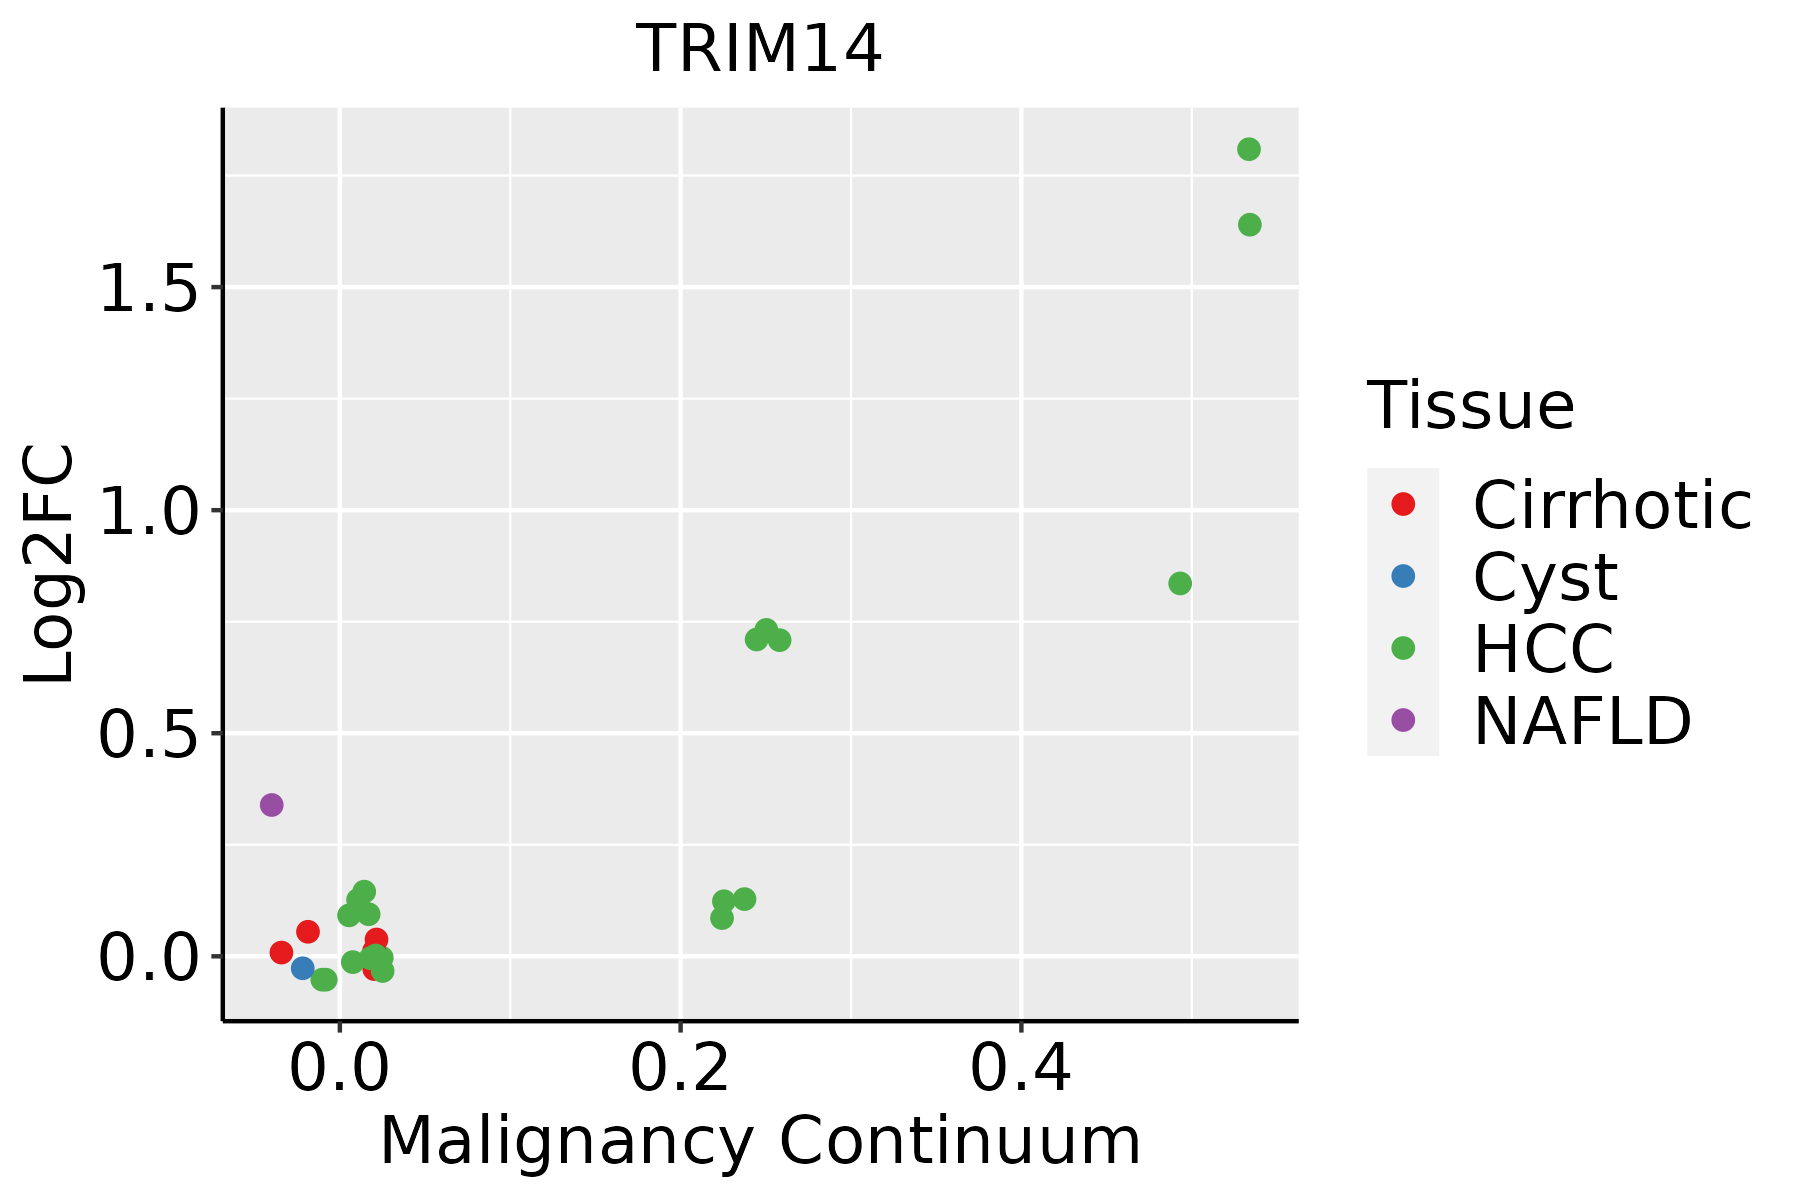 | HCC: Hepatocellular carcinoma |
| NAFLD: Non-alcoholic fatty liver disease | ||
| Oral Cavity | 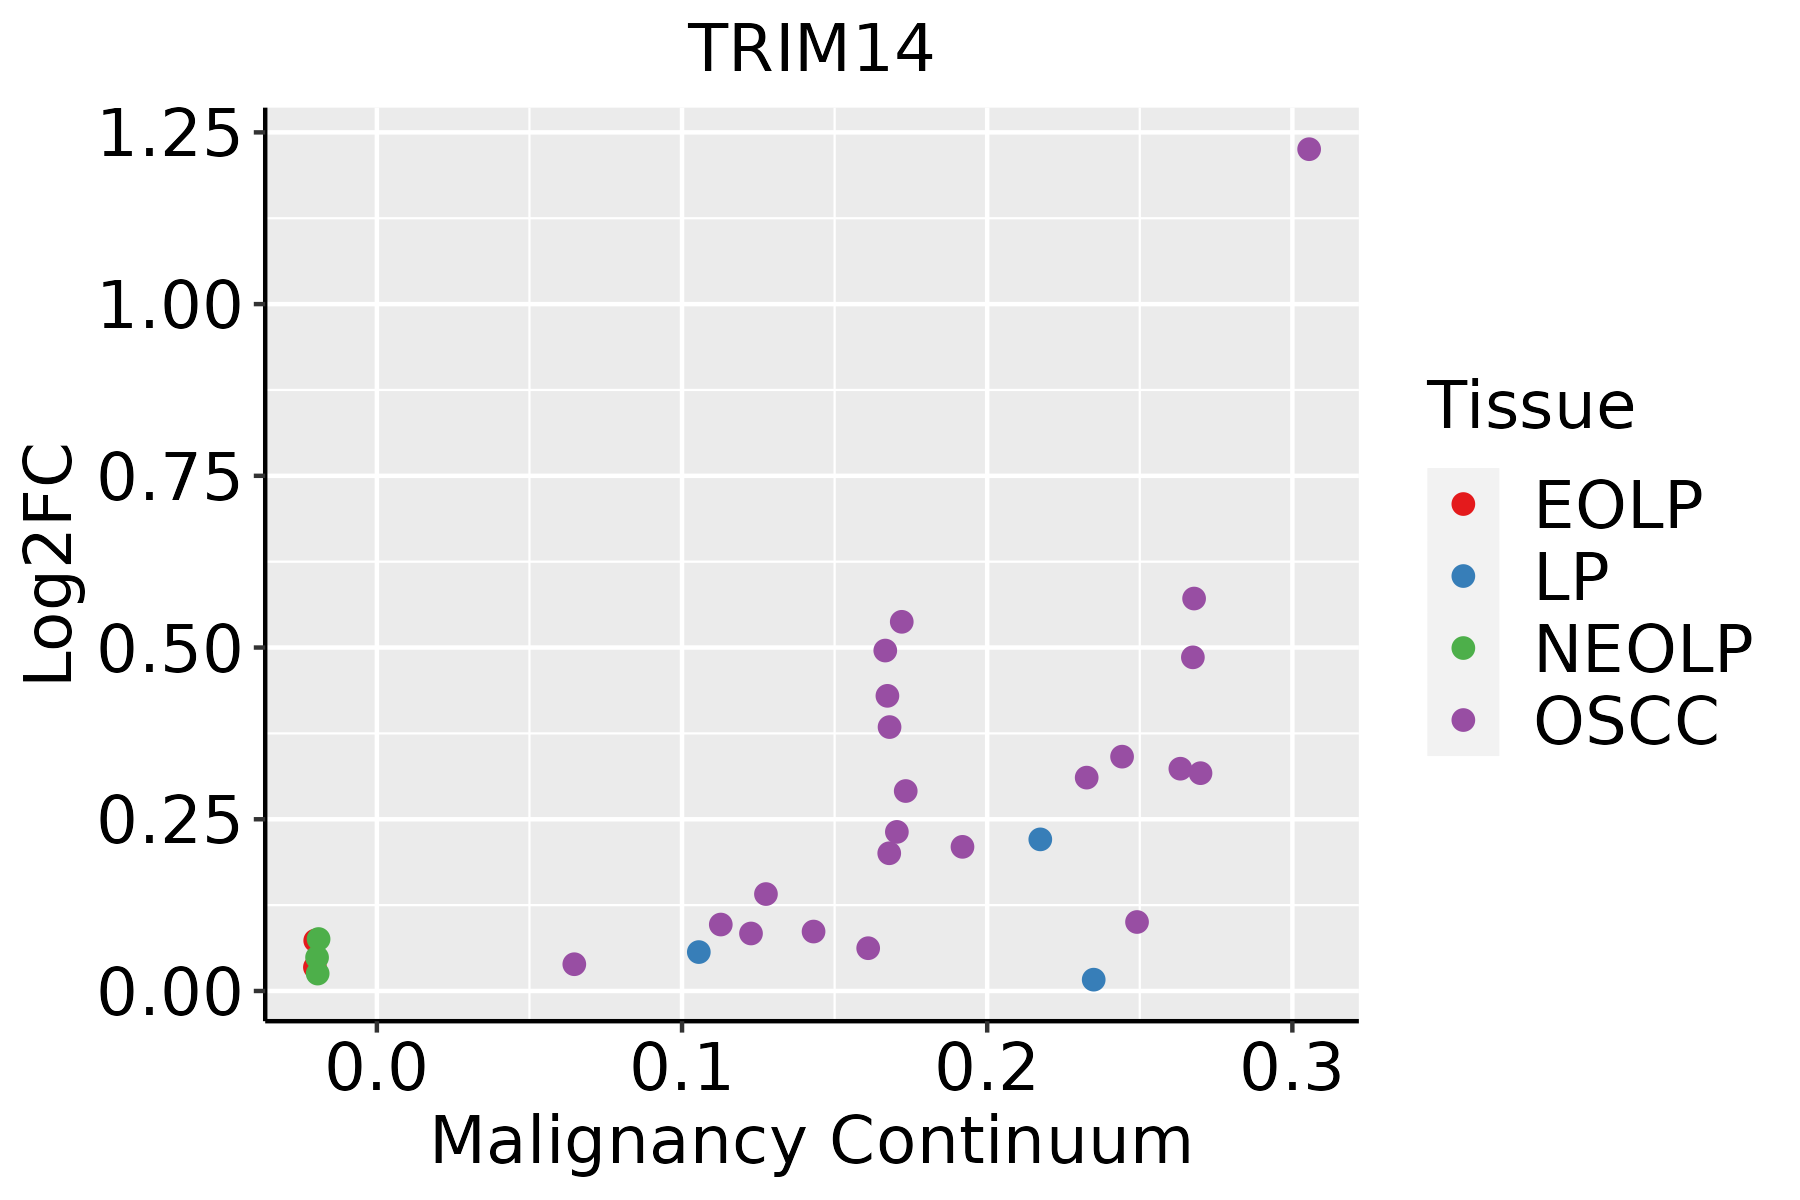 | EOLP: Erosive Oral lichen planus |
| LP: leukoplakia | ||
| NEOLP: Non-erosive oral lichen planus | ||
| OSCC: Oral squamous cell carcinoma |
| ∗log2FC in expression of this searched gene in stem-like cells from each diseased tissue sample relative to stem-like cells in normal samples in each tissue plotted against the malignancy continuum. Samples are colored based on if they are from different disease stage. |
Top |
Malignant transformation related pathway analysis |
| Find out the enriched GO biological processes and KEGG pathways involved in transition from healthy to precancer to cancer |
| Tissue | Disease Stage | Enriched GO biological Processes |
| Colorectum | AD |  |
| Colorectum | SER |  |
| Colorectum | MSS |  |
| Colorectum | MSI-H |  |
| Colorectum | FAP |  |
| ∗Top 15 enriched GO BP terms are showed in the bar plot of each disease state in each tissue. Each row represents a significant GO biological process which is colored according to the -log10(p.adjust). |
| Page: 1 2 3 4 5 6 7 8 9 |
| GO ID | Tissue | Disease Stage | Description | Gene Ratio | Bg Ratio | pvalue | p.adjust | Count |
| GO:00313314 | Colorectum | FAP | positive regulation of cellular catabolic process | 110/2622 | 427/18723 | 6.09e-11 | 2.19e-08 | 110 |
| GO:00190584 | Colorectum | FAP | viral life cycle | 81/2622 | 317/18723 | 2.97e-08 | 2.64e-06 | 81 |
| GO:00105063 | Colorectum | FAP | regulation of autophagy | 80/2622 | 317/18723 | 6.43e-08 | 4.54e-06 | 80 |
| GO:00002093 | Colorectum | FAP | protein polyubiquitination | 59/2622 | 236/18723 | 4.53e-06 | 1.52e-04 | 59 |
| GO:00190804 | Colorectum | FAP | viral gene expression | 29/2622 | 94/18723 | 2.07e-05 | 5.05e-04 | 29 |
| GO:00444034 | Colorectum | FAP | biological process involved in symbiotic interaction | 66/2622 | 290/18723 | 3.47e-05 | 7.64e-04 | 66 |
| GO:00431222 | Colorectum | FAP | regulation of I-kappaB kinase/NF-kappaB signaling | 56/2622 | 249/18723 | 1.82e-04 | 2.69e-03 | 56 |
| GO:00521264 | Colorectum | FAP | movement in host environment | 42/2622 | 175/18723 | 2.64e-04 | 3.60e-03 | 42 |
| GO:00517014 | Colorectum | FAP | biological process involved in interaction with host | 47/2622 | 203/18723 | 2.89e-04 | 3.77e-03 | 47 |
| GO:00507924 | Colorectum | FAP | regulation of viral process | 39/2622 | 164/18723 | 5.21e-04 | 5.91e-03 | 39 |
| GO:00431232 | Colorectum | FAP | positive regulation of I-kappaB kinase/NF-kappaB signaling | 42/2622 | 186/18723 | 1.01e-03 | 9.89e-03 | 42 |
| GO:19039004 | Colorectum | FAP | regulation of viral life cycle | 35/2622 | 148/18723 | 1.09e-03 | 1.05e-02 | 35 |
| GO:00467184 | Colorectum | FAP | viral entry into host cell | 34/2622 | 144/18723 | 1.31e-03 | 1.20e-02 | 34 |
| GO:00072492 | Colorectum | FAP | I-kappaB kinase/NF-kappaB signaling | 58/2622 | 281/18723 | 1.37e-03 | 1.24e-02 | 58 |
| GO:00444093 | Colorectum | FAP | entry into host | 34/2622 | 151/18723 | 3.02e-03 | 2.28e-02 | 34 |
| GO:00105081 | Colorectum | FAP | positive regulation of autophagy | 29/2622 | 124/18723 | 3.30e-03 | 2.43e-02 | 29 |
| GO:00510901 | Colorectum | FAP | regulation of DNA-binding transcription factor activity | 80/2622 | 440/18723 | 7.90e-03 | 4.67e-02 | 80 |
| GO:00160325 | Colorectum | CRC | viral process | 95/2078 | 415/18723 | 3.31e-12 | 3.30e-09 | 95 |
| GO:00098965 | Colorectum | CRC | positive regulation of catabolic process | 102/2078 | 492/18723 | 2.48e-10 | 1.06e-07 | 102 |
| GO:00313315 | Colorectum | CRC | positive regulation of cellular catabolic process | 90/2078 | 427/18723 | 1.19e-09 | 4.20e-07 | 90 |
| Page: 1 2 3 4 5 6 7 8 9 |
| Pathway ID | Tissue | Disease Stage | Description | Gene Ratio | Bg Ratio | pvalue | p.adjust | qvalue | Count |
| Page: 1 |
Top |
Cell-cell communication analysis |
| Identification of potential cell-cell interactions between two cell types and their ligand-receptor pairs for different disease states |
| Ligand | Receptor | LRpair | Pathway | Tissue | Disease Stage |
| Page: 1 |
Top |
Single-cell gene regulatory network inference analysis |
| Find out the significant the regulons (TFs) and the target genes of each regulon across cell types for different disease states |
| TF | Cell Type | Tissue | Disease Stage | Target Gene | RSS | Regulon Activity |
| ∗The dot plots of a searched regulon are shown for all cell subpopulations in each disease state of each tissue based on the regulon specific score inferred using pySCENIC and by calculating the average expression. |
| Page: 1 |
Top |
Somatic mutation of malignant transformation related genes |
| Annotation of somatic variants for genes involved in malignant transformation |
| Hugo Symbol | Variant Class | Variant Classification | dbSNP RS | HGVSc | HGVSp | HGVSp Short | SWISSPROT | BIOTYPE | SIFT | PolyPhen | Tumor Sample Barcode | Tissue | Histology | Sex | Age | Stage | Therapy Types | Drugs | Outcome |
| TRIM14 | SNV | Missense_Mutation | c.474N>A | p.Met158Ile | p.M158I | Q14142 | protein_coding | tolerated(0.45) | benign(0) | TCGA-D8-A1J8-01 | Breast | breast invasive carcinoma | Female | >=65 | I/II | Hormone Therapy | nolvadex | SD | |
| TRIM14 | SNV | Missense_Mutation | c.415C>T | p.Leu139Phe | p.L139F | Q14142 | protein_coding | tolerated(0.19) | probably_damaging(0.924) | TCGA-E2-A1AZ-01 | Breast | breast invasive carcinoma | Female | <65 | I/II | Chemotherapy | adriamycin | SD | |
| TRIM14 | insertion | In_Frame_Ins | novel | c.256_257insTGGTTCCTT | p.His86delinsLeuValProTyr | p.H86delinsLVPY | Q14142 | protein_coding | TCGA-A8-A07P-01 | Breast | breast invasive carcinoma | Female | >=65 | I/II | Chemotherapy | 5-fluorouracil | SD | ||
| TRIM14 | SNV | Missense_Mutation | c.52G>A | p.Glu18Lys | p.E18K | Q14142 | protein_coding | tolerated(0.2) | benign(0.039) | TCGA-DR-A0ZM-01 | Cervix | cervical & endocervical cancer | Female | <65 | III/IV | Unspecific | Cisplatin | SD | |
| TRIM14 | SNV | Missense_Mutation | novel | c.289N>G | p.Thr97Ala | p.T97A | Q14142 | protein_coding | tolerated(1) | benign(0) | TCGA-AA-3715-01 | Colorectum | colon adenocarcinoma | Male | >=65 | I/II | Unknown | Unknown | PD |
| TRIM14 | SNV | Missense_Mutation | c.394N>C | p.Phe132Leu | p.F132L | Q14142 | protein_coding | tolerated(0.32) | possibly_damaging(0.519) | TCGA-CK-4951-01 | Colorectum | colon adenocarcinoma | Female | >=65 | I/II | Unknown | Unknown | PD | |
| TRIM14 | SNV | Missense_Mutation | c.386N>T | p.Ala129Val | p.A129V | Q14142 | protein_coding | deleterious(0.02) | benign(0.036) | TCGA-D5-6928-01 | Colorectum | colon adenocarcinoma | Male | >=65 | I/II | Unknown | Unknown | SD | |
| TRIM14 | SNV | Missense_Mutation | novel | c.1313N>C | p.Ile438Thr | p.I438T | Q14142 | protein_coding | tolerated(0.09) | benign(0.426) | TCGA-A5-A0VP-01 | Endometrium | uterine corpus endometrioid carcinoma | Female | >=65 | I/II | Unknown | Unknown | SD |
| TRIM14 | SNV | Missense_Mutation | novel | c.521N>A | p.Pro174His | p.P174H | Q14142 | protein_coding | tolerated(0.11) | probably_damaging(0.96) | TCGA-AP-A1DK-01 | Endometrium | uterine corpus endometrioid carcinoma | Female | <65 | I/II | Unknown | Unknown | SD |
| TRIM14 | SNV | Missense_Mutation | novel | c.353N>C | p.Leu118Pro | p.L118P | Q14142 | protein_coding | deleterious(0) | probably_damaging(0.972) | TCGA-AP-A1DK-01 | Endometrium | uterine corpus endometrioid carcinoma | Female | <65 | I/II | Unknown | Unknown | SD |
| Page: 1 2 3 |
Top |
Related drugs of malignant transformation related genes |
| Identification of chemicals and drugs interact with genes involved in malignant transfromation |
| (DGIdb 4.0) |
| Entrez ID | Symbol | Category | Interaction Types | Drug Claim Name | Drug Name | PMIDs |
| Page: 1 |

Copyright 2023-Present -The University of Texas Health Science Center at Houston |