| Tissue | Expression Dynamics | Abbreviation |
| Esophagus | 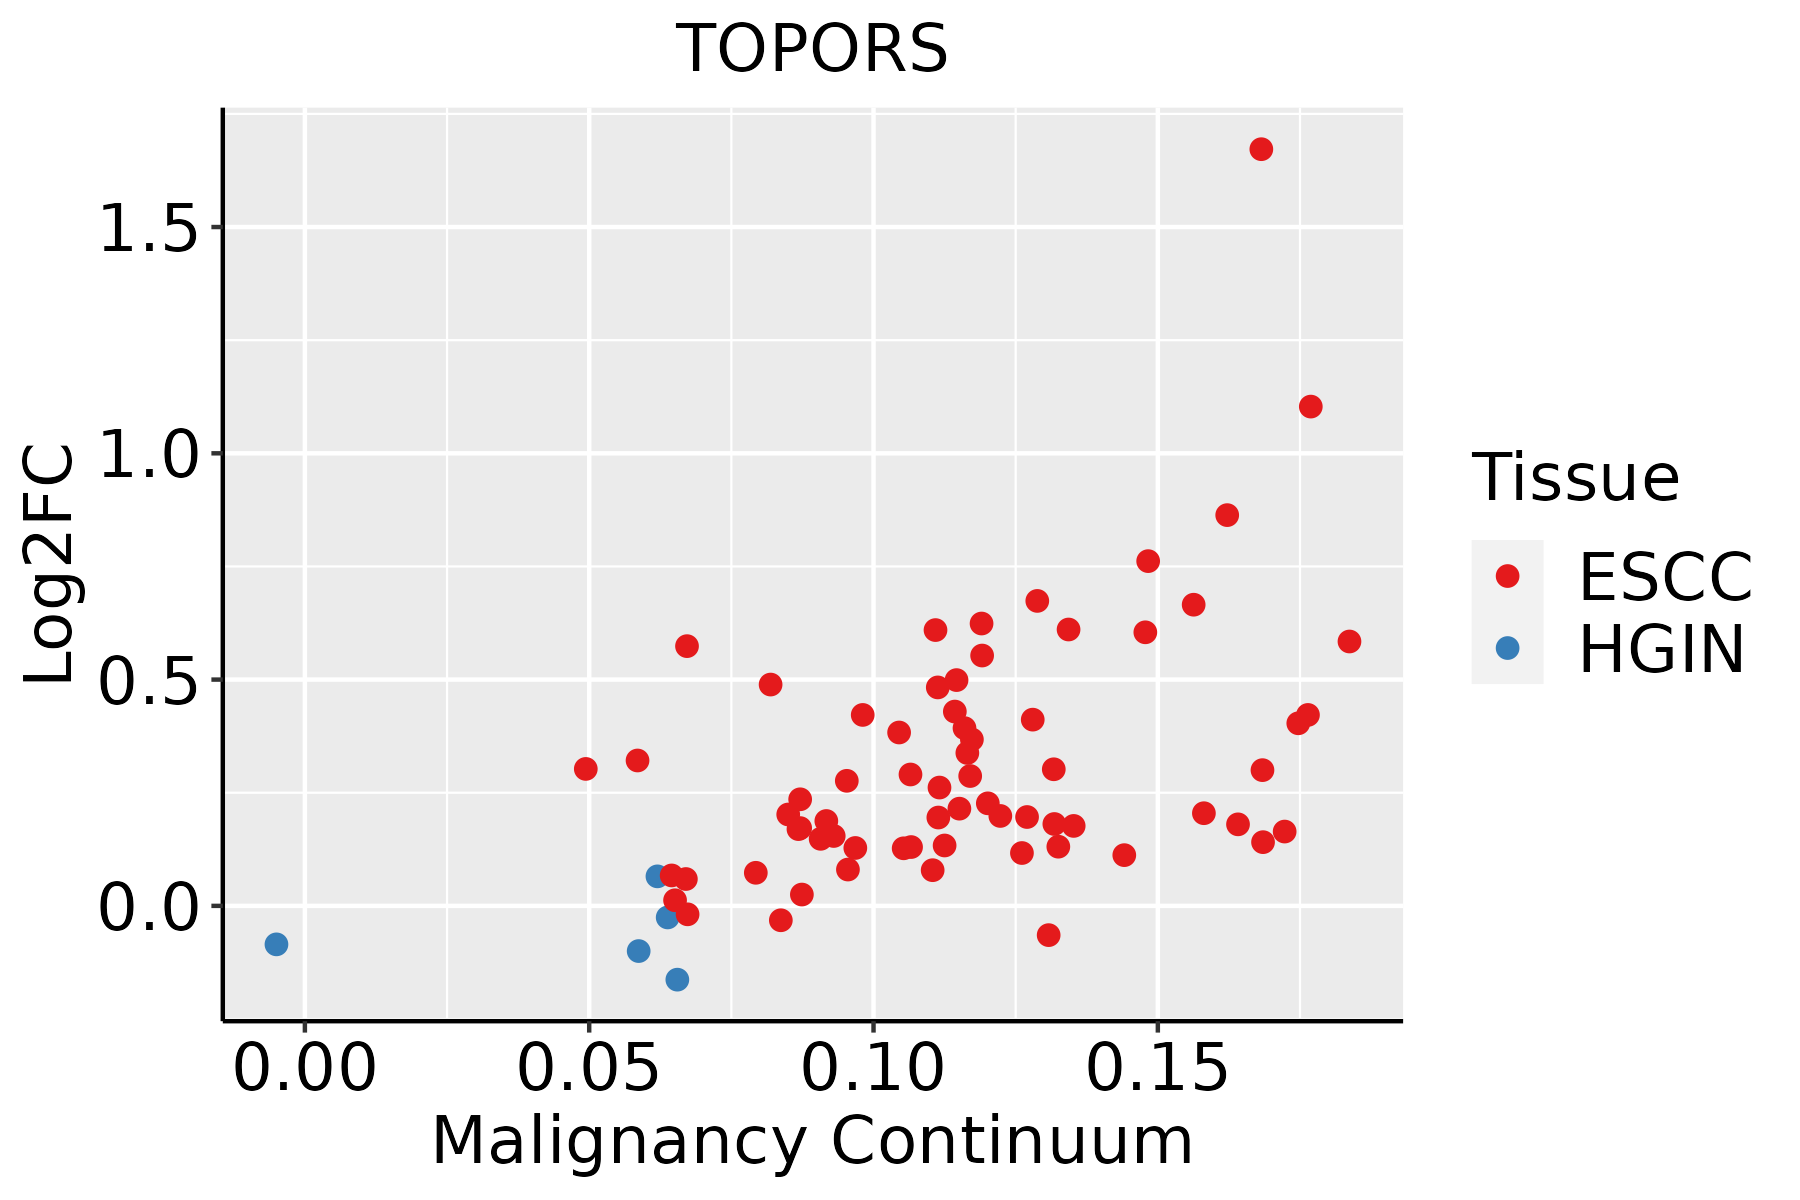 | ESCC: Esophageal squamous cell carcinoma |
| HGIN: High-grade intraepithelial neoplasias |
| LGIN: Low-grade intraepithelial neoplasias |
| Oral Cavity | 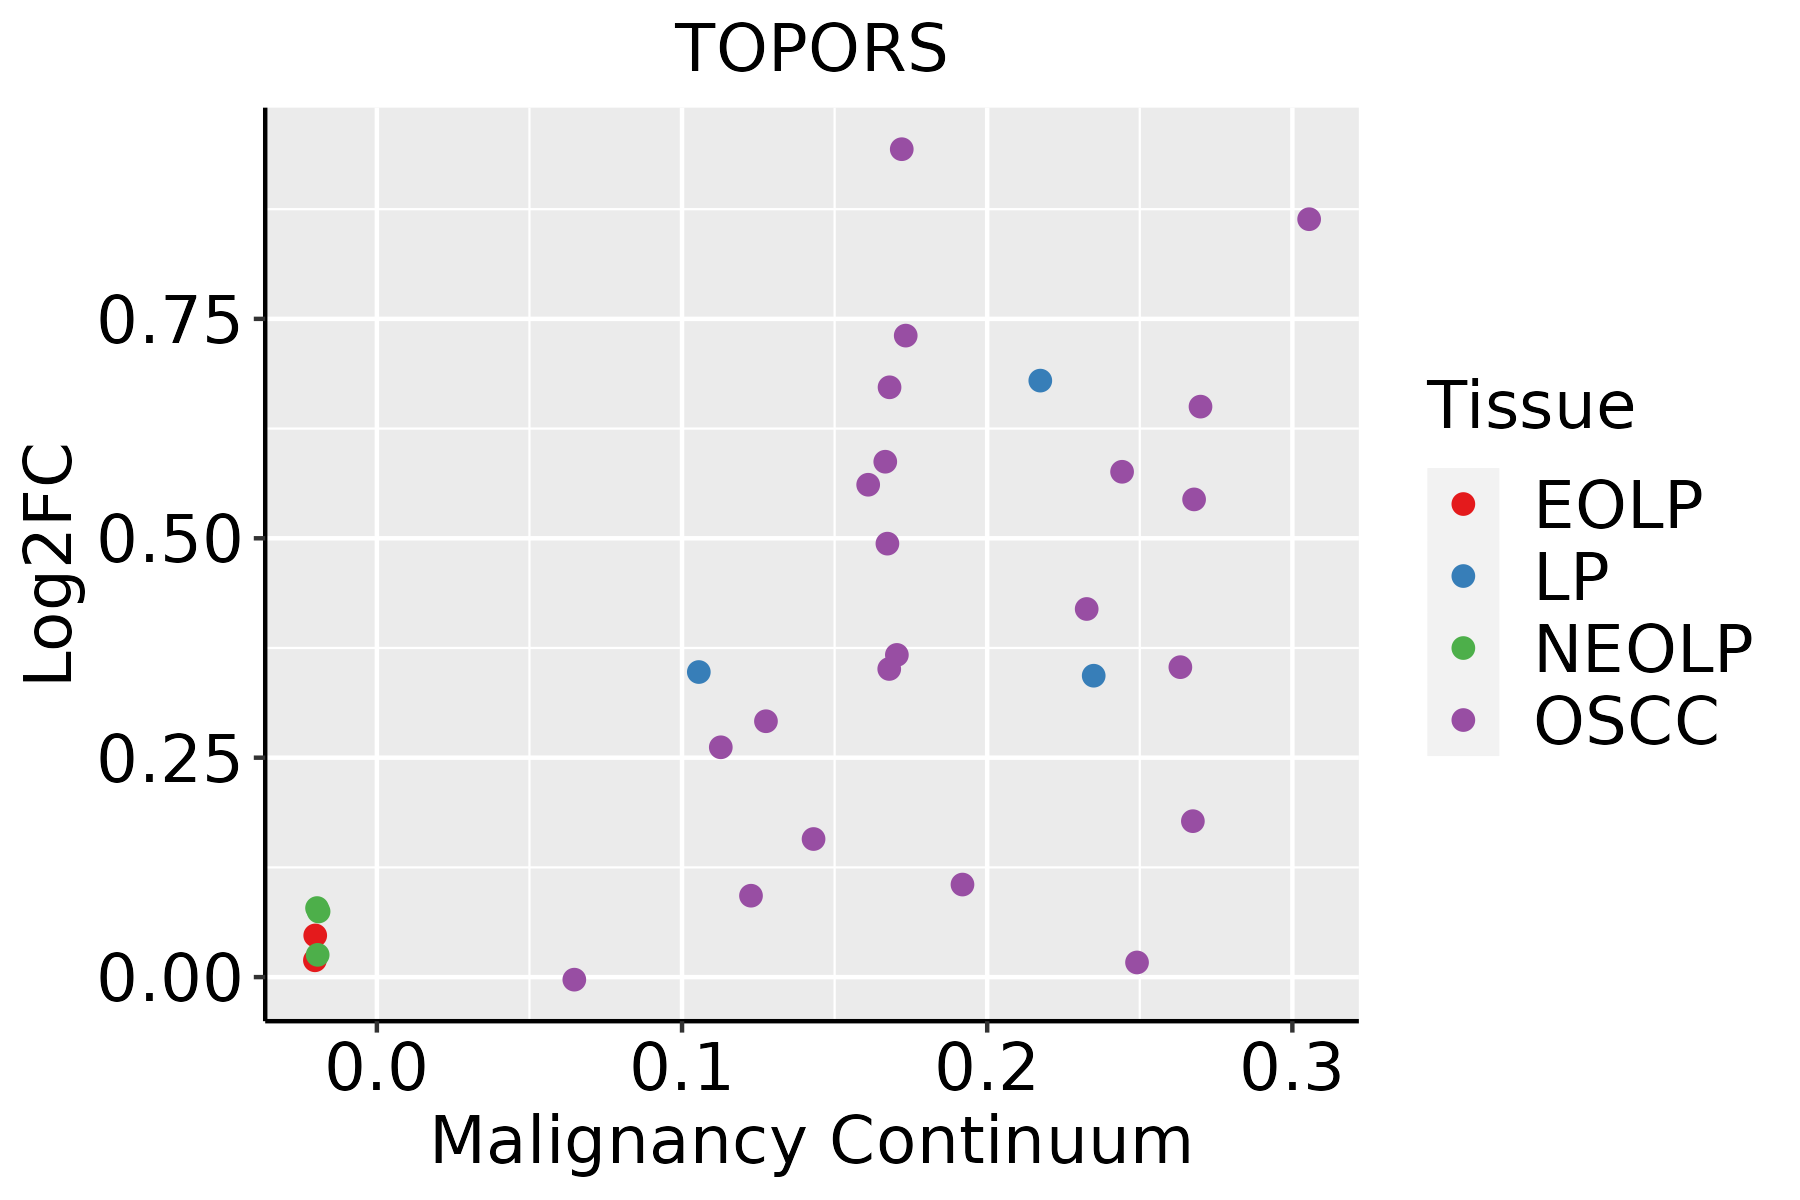 | EOLP: Erosive Oral lichen planus |
| LP: leukoplakia |
| NEOLP: Non-erosive oral lichen planus |
| OSCC: Oral squamous cell carcinoma |
| Thyroid | 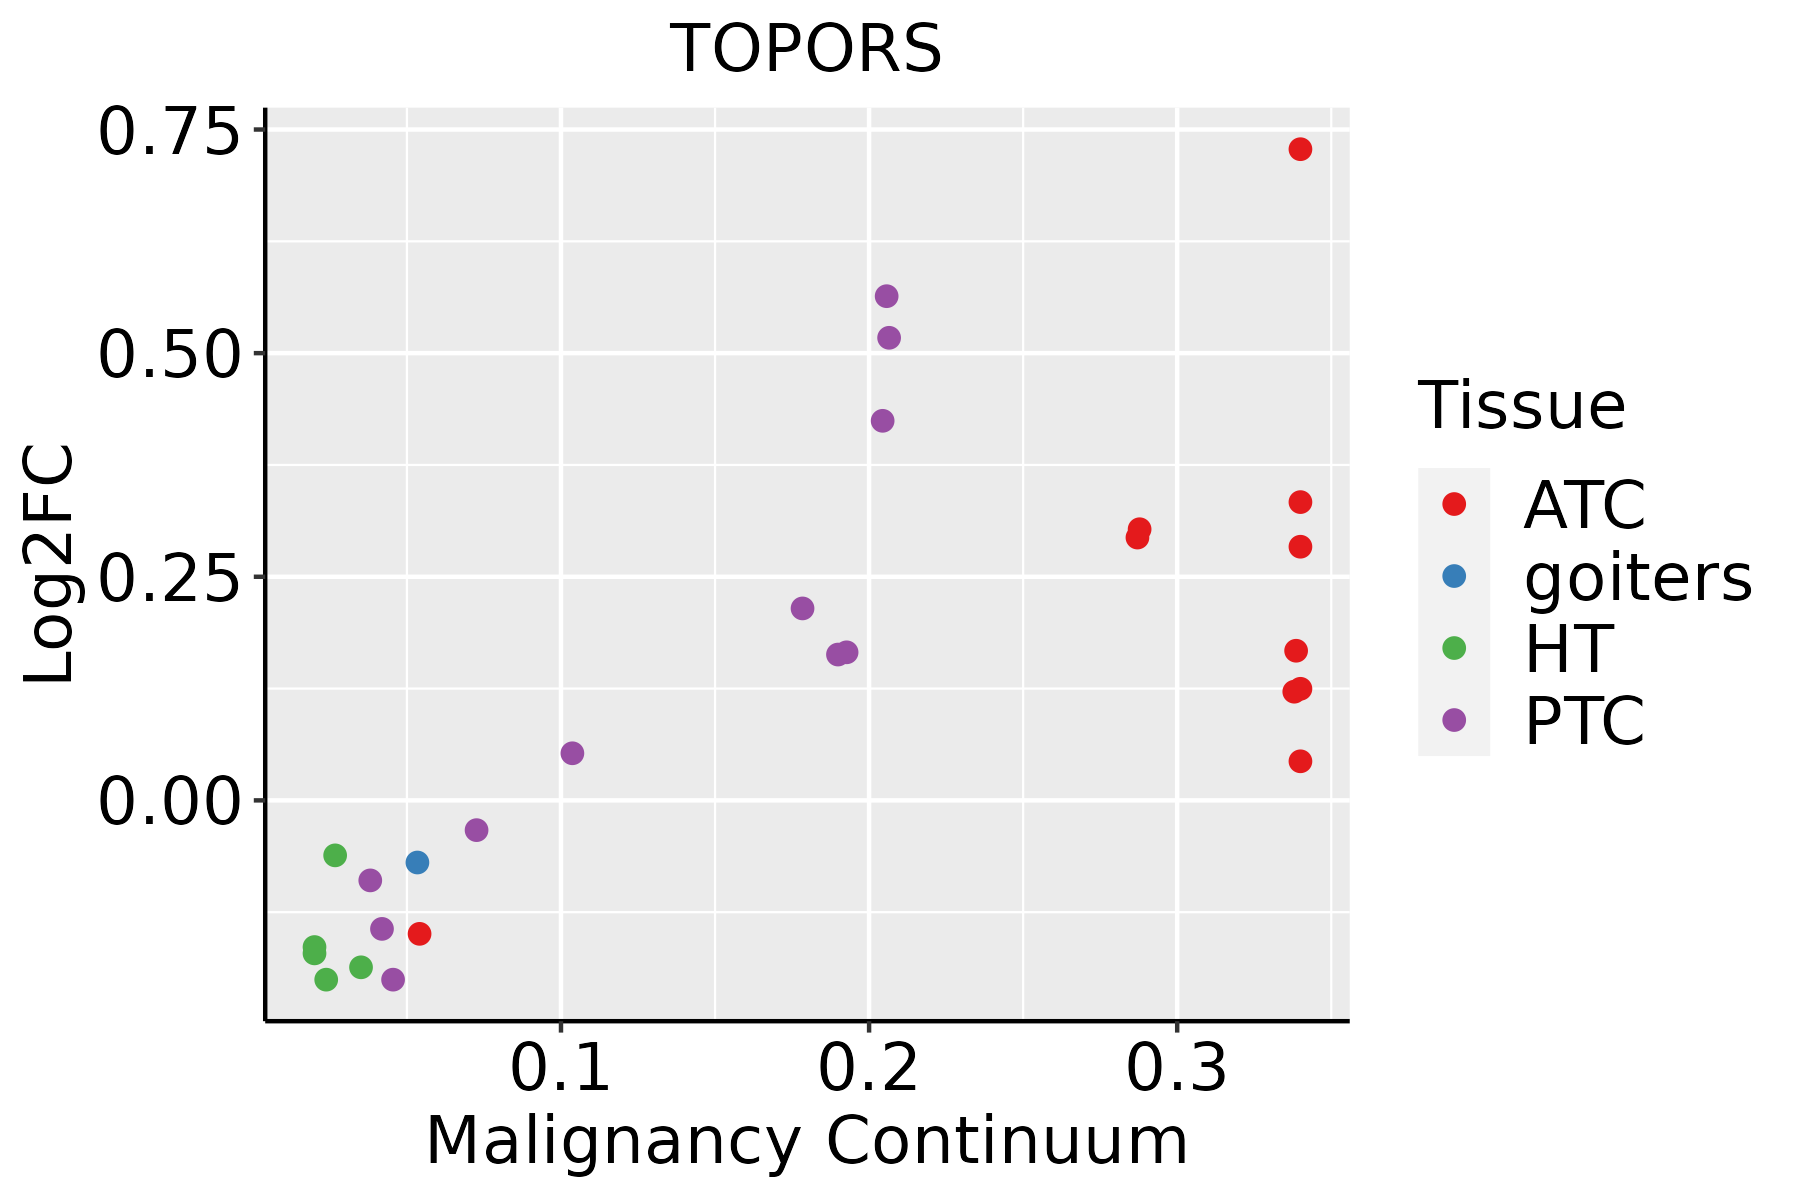 | ATC: Anaplastic thyroid cancer |
| HT: Hashimoto's thyroiditis |
| PTC: Papillary thyroid cancer |
| GO ID | Tissue | Disease Stage | Description | Gene Ratio | Bg Ratio | pvalue | p.adjust | Count |
| GO:007259519 | Thyroid | PTC | maintenance of protein localization in organelle | 33/5968 | 42/18723 | 6.30e-10 | 1.97e-08 | 33 |
| GO:007093620 | Thyroid | PTC | protein K48-linked ubiquitination | 45/5968 | 65/18723 | 6.91e-10 | 2.08e-08 | 45 |
| GO:0072332113 | Thyroid | PTC | intrinsic apoptotic signaling pathway by p53 class mediator | 48/5968 | 76/18723 | 1.99e-08 | 4.61e-07 | 48 |
| GO:0051235112 | Thyroid | PTC | maintenance of location | 148/5968 | 327/18723 | 2.30e-07 | 4.07e-06 | 148 |
| GO:190332210 | Thyroid | PTC | positive regulation of protein modification by small protein conjugation or removal | 73/5968 | 138/18723 | 2.34e-07 | 4.11e-06 | 73 |
| GO:0042771112 | Thyroid | PTC | intrinsic apoptotic signaling pathway in response to DNA damage by p53 class mediator | 30/5968 | 43/18723 | 3.79e-07 | 6.32e-06 | 30 |
| GO:005145713 | Thyroid | PTC | maintenance of protein location in nucleus | 19/5968 | 23/18723 | 7.60e-07 | 1.18e-05 | 19 |
| GO:0051438111 | Thyroid | PTC | regulation of ubiquitin-protein transferase activity | 34/5968 | 53/18723 | 1.36e-06 | 1.95e-05 | 34 |
| GO:00313989 | Thyroid | PTC | positive regulation of protein ubiquitination | 63/5968 | 119/18723 | 1.47e-06 | 2.08e-05 | 63 |
| GO:0008630112 | Thyroid | PTC | intrinsic apoptotic signaling pathway in response to DNA damage | 54/5968 | 99/18723 | 2.46e-06 | 3.22e-05 | 54 |
| GO:0051651113 | Thyroid | PTC | maintenance of location in cell | 100/5968 | 214/18723 | 3.65e-06 | 4.67e-05 | 100 |
| GO:00169256 | Thyroid | PTC | protein sumoylation | 30/5968 | 53/18723 | 1.71e-04 | 1.31e-03 | 30 |
| GO:00065138 | Thyroid | PTC | protein monoubiquitination | 34/5968 | 67/18723 | 1.00e-03 | 5.98e-03 | 34 |
| GO:001049832 | Thyroid | ATC | proteasomal protein catabolic process | 309/6293 | 490/18723 | 1.78e-41 | 1.13e-37 | 309 |
| GO:0043161210 | Thyroid | ATC | proteasome-mediated ubiquitin-dependent protein catabolic process | 265/6293 | 412/18723 | 7.09e-38 | 1.49e-34 | 265 |
| GO:003450423 | Thyroid | ATC | protein localization to nucleus | 175/6293 | 290/18723 | 6.23e-21 | 1.23e-18 | 175 |
| GO:190332034 | Thyroid | ATC | regulation of protein modification by small protein conjugation or removal | 152/6293 | 242/18723 | 9.76e-21 | 1.71e-18 | 152 |
| GO:009719335 | Thyroid | ATC | intrinsic apoptotic signaling pathway | 171/6293 | 288/18723 | 1.86e-19 | 2.67e-17 | 171 |
| GO:003139634 | Thyroid | ATC | regulation of protein ubiquitination | 132/6293 | 210/18723 | 3.13e-18 | 3.98e-16 | 132 |
| GO:007233135 | Thyroid | ATC | signal transduction by p53 class mediator | 102/6293 | 163/18723 | 3.16e-14 | 1.75e-12 | 102 |
| Hugo Symbol | Variant Class | Variant Classification | dbSNP RS | HGVSc | HGVSp | HGVSp Short | SWISSPROT | BIOTYPE | SIFT | PolyPhen | Tumor Sample Barcode | Tissue | Histology | Sex | Age | Stage | Therapy Types | Drugs | Outcome |
| TOPORS | SNV | Missense_Mutation | novel | c.1627N>A | p.Glu543Lys | p.E543K | Q9NS56 | protein_coding | tolerated_low_confidence(0.16) | benign(0.045) | TCGA-5L-AAT1-01 | Breast | breast invasive carcinoma | Female | <65 | III/IV | Hormone Therapy | letrozol | SD |
| TOPORS | SNV | Missense_Mutation | | c.845C>T | p.Ser282Leu | p.S282L | Q9NS56 | protein_coding | deleterious(0) | benign(0.061) | TCGA-A8-A06Q-01 | Breast | breast invasive carcinoma | Female | <65 | III/IV | Unknown | Unknown | SD |
| TOPORS | SNV | Missense_Mutation | novel | c.1847N>A | p.Arg616Lys | p.R616K | Q9NS56 | protein_coding | tolerated(0.15) | possibly_damaging(0.696) | TCGA-AN-A046-01 | Breast | breast invasive carcinoma | Female | >=65 | I/II | Unknown | Unknown | SD |
| TOPORS | SNV | Missense_Mutation | | c.436N>C | p.Asp146His | p.D146H | Q9NS56 | protein_coding | tolerated(0.56) | benign(0.003) | TCGA-AN-A0AJ-01 | Breast | breast invasive carcinoma | Female | >=65 | I/II | Unknown | Unknown | SD |
| TOPORS | deletion | Frame_Shift_Del | novel | c.1089delN | p.Phe363LeufsTer30 | p.F363Lfs*30 | Q9NS56 | protein_coding | | | TCGA-D8-A27V-01 | Breast | breast invasive carcinoma | Female | <65 | I/II | Hormone Therapy | tamoxiphen | SD |
| TOPORS | SNV | Missense_Mutation | novel | c.1699N>C | p.Ser567Pro | p.S567P | Q9NS56 | protein_coding | tolerated(0.11) | possibly_damaging(0.548) | TCGA-2W-A8YY-01 | Cervix | cervical & endocervical cancer | Female | <65 | I/II | Chemotherapy | cisplatin | CR |
| TOPORS | SNV | Missense_Mutation | novel | c.1194N>C | p.Glu398Asp | p.E398D | Q9NS56 | protein_coding | tolerated(0.08) | benign(0.024) | TCGA-2W-A8YY-01 | Cervix | cervical & endocervical cancer | Female | <65 | I/II | Chemotherapy | cisplatin | CR |
| TOPORS | SNV | Missense_Mutation | | c.2156C>T | p.Ser719Phe | p.S719F | Q9NS56 | protein_coding | deleterious_low_confidence(0) | probably_damaging(0.981) | TCGA-Q1-A73O-01 | Cervix | cervical & endocervical cancer | Female | <65 | I/II | Chemotherapy | cisplatin | CR |
| TOPORS | SNV | Missense_Mutation | rs780800052 | c.67C>T | p.Pro23Ser | p.P23S | Q9NS56 | protein_coding | deleterious_low_confidence(0.02) | benign(0.383) | TCGA-VS-A94Z-01 | Cervix | cervical & endocervical cancer | Female | <65 | I/II | Chemotherapy | cisplatin | CR |
| TOPORS | SNV | Missense_Mutation | novel | c.2363G>A | p.Arg788Lys | p.R788K | Q9NS56 | protein_coding | tolerated(0.45) | benign(0.158) | TCGA-VS-A952-01 | Cervix | cervical & endocervical cancer | Female | >=65 | I/II | Unknown | Unknown | SD |


