Schematic overview of the cellular and molecular mechanisms involved in the cancer progression, including the proposed cellular and molecular mechanisms in cancer cells trajectory. AT1: alveolar type 1 cells; AT2: alveolar type 2 cells; AAH: atypical adenomatous hyperplasia; AIS: adenocarcinoma in situ; MIA: minimally invasive adenocarcinoma; IA: invasive adenocarcinoma; EMT: epithelial-mesenchymal transition

Home

Download

Statistics

Help

Contact

Center for Computational Systems Medicine
leaf

Gene summary

leaf

Malignant transformation analysis

leaf

Malignant transformation related pathway analysis

leaf

Cell-cell communication analysis

leaf

Single-cell gene regulatory network inference analysis

leaf

Somatic mutation of malignant transformation related genes

leaf

Related drugs of malignant transformation related genes

Gene: TOM1L1

Gene summary for TOM1L1

check button Gene summary.

Gene informationSpeciesHuman
Gene symbol

TOM1L1

Gene ID

10040

Gene nametarget of myb1 like 1 membrane trafficking protein
Gene AliasSRCASM
Cytomap17q22
Gene Typeprotein-coding
GO ID

GO:0000278

UniProtAcc

O75674


Top

Malignant transformation analysis

check button Identification of the aberrant gene expression in precancerous and cancerous lesions by comparing the gene expression of stem-like cells in diseased tissues with normal stem cells
check button Malignant transformation involving gene list.
Entrez IDSymbolReplicatesSpeciesOrganTissueAdj P-valueLog2FCMalignancy
10040TOM1L1HTA11_866_3004761011HumanColorectumAD5.61e-04-3.41e-010.096
10040TOM1L1HTA11_7696_3000711011HumanColorectumAD3.11e-06-3.11e-010.0674
10040TOM1L1HTA11_99999971662_82457HumanColorectumMSS1.46e-04-2.97e-010.3859
10040TOM1L1HTA11_99999974143_84620HumanColorectumMSS2.79e-08-3.18e-010.3005
10040TOM1L1F007HumanColorectumFAP6.40e-03-2.59e-010.1176
10040TOM1L1A001-C-207HumanColorectumFAP1.20e-07-3.92e-010.1278
10040TOM1L1A015-C-203HumanColorectumFAP1.68e-22-4.26e-01-0.1294
10040TOM1L1A015-C-204HumanColorectumFAP4.31e-11-4.07e-01-0.0228
10040TOM1L1A014-C-040HumanColorectumFAP6.92e-05-4.40e-01-0.1184
10040TOM1L1A002-C-201HumanColorectumFAP3.64e-15-3.88e-010.0324
10040TOM1L1A002-C-203HumanColorectumFAP6.24e-07-2.57e-010.2786
10040TOM1L1A001-C-119HumanColorectumFAP8.92e-07-4.28e-01-0.1557
10040TOM1L1A001-C-108HumanColorectumFAP2.96e-18-3.83e-01-0.0272
10040TOM1L1A002-C-205HumanColorectumFAP2.68e-23-4.99e-01-0.1236
10040TOM1L1A001-C-104HumanColorectumFAP4.46e-08-3.15e-010.0184
10040TOM1L1A015-C-005HumanColorectumFAP5.31e-04-2.13e-01-0.0336
10040TOM1L1A015-C-006HumanColorectumFAP7.79e-13-3.80e-01-0.0994
10040TOM1L1A015-C-106HumanColorectumFAP2.75e-17-3.55e-01-0.0511
10040TOM1L1A002-C-114HumanColorectumFAP1.90e-18-4.80e-01-0.1561
10040TOM1L1A015-C-104HumanColorectumFAP2.65e-26-4.60e-01-0.1899
Page: 1 2 3 4 5 6 7 

check button Transcriptomic changes along malignancy continuum.
TissueExpression DynamicsAbbreviation
Colorectum (GSE201348)The image shows the transcriptomic changes along malignancy continuum.log2FC in expression of this searched gene in stem-like cells from each diseased tissue sample relative to stem-like cells in normal samples in each tissue plotted against the malignancy continuum. Samples are colored based on if they are from different disease stage.FAP: Familial adenomatous polyposis
CRC: Colorectal cancer
Colorectum (HTA11)The image shows the transcriptomic changes along malignancy continuum.log2FC in expression of this searched gene in stem-like cells from each diseased tissue sample relative to stem-like cells in normal samples in each tissue plotted against the malignancy continuum. Samples are colored based on if they are from different disease stage.AD: Adenomas
SER: Sessile serrated lesions
MSI-H: Microsatellite-high colorectal cancer
MSS: Microsatellite stable colorectal cancer
EsophagusThe image shows the transcriptomic changes along malignancy continuum.log2FC in expression of this searched gene in stem-like cells from each diseased tissue sample relative to stem-like cells in normal samples in each tissue plotted against the malignancy continuum. Samples are colored based on if they are from different disease stage.ESCC: Esophageal squamous cell carcinoma
HGIN: High-grade intraepithelial neoplasias
LGIN: Low-grade intraepithelial neoplasias
LiverThe image shows the transcriptomic changes along malignancy continuum.log2FC in expression of this searched gene in stem-like cells from each diseased tissue sample relative to stem-like cells in normal samples in each tissue plotted against the malignancy continuum. Samples are colored based on if they are from different disease stage.
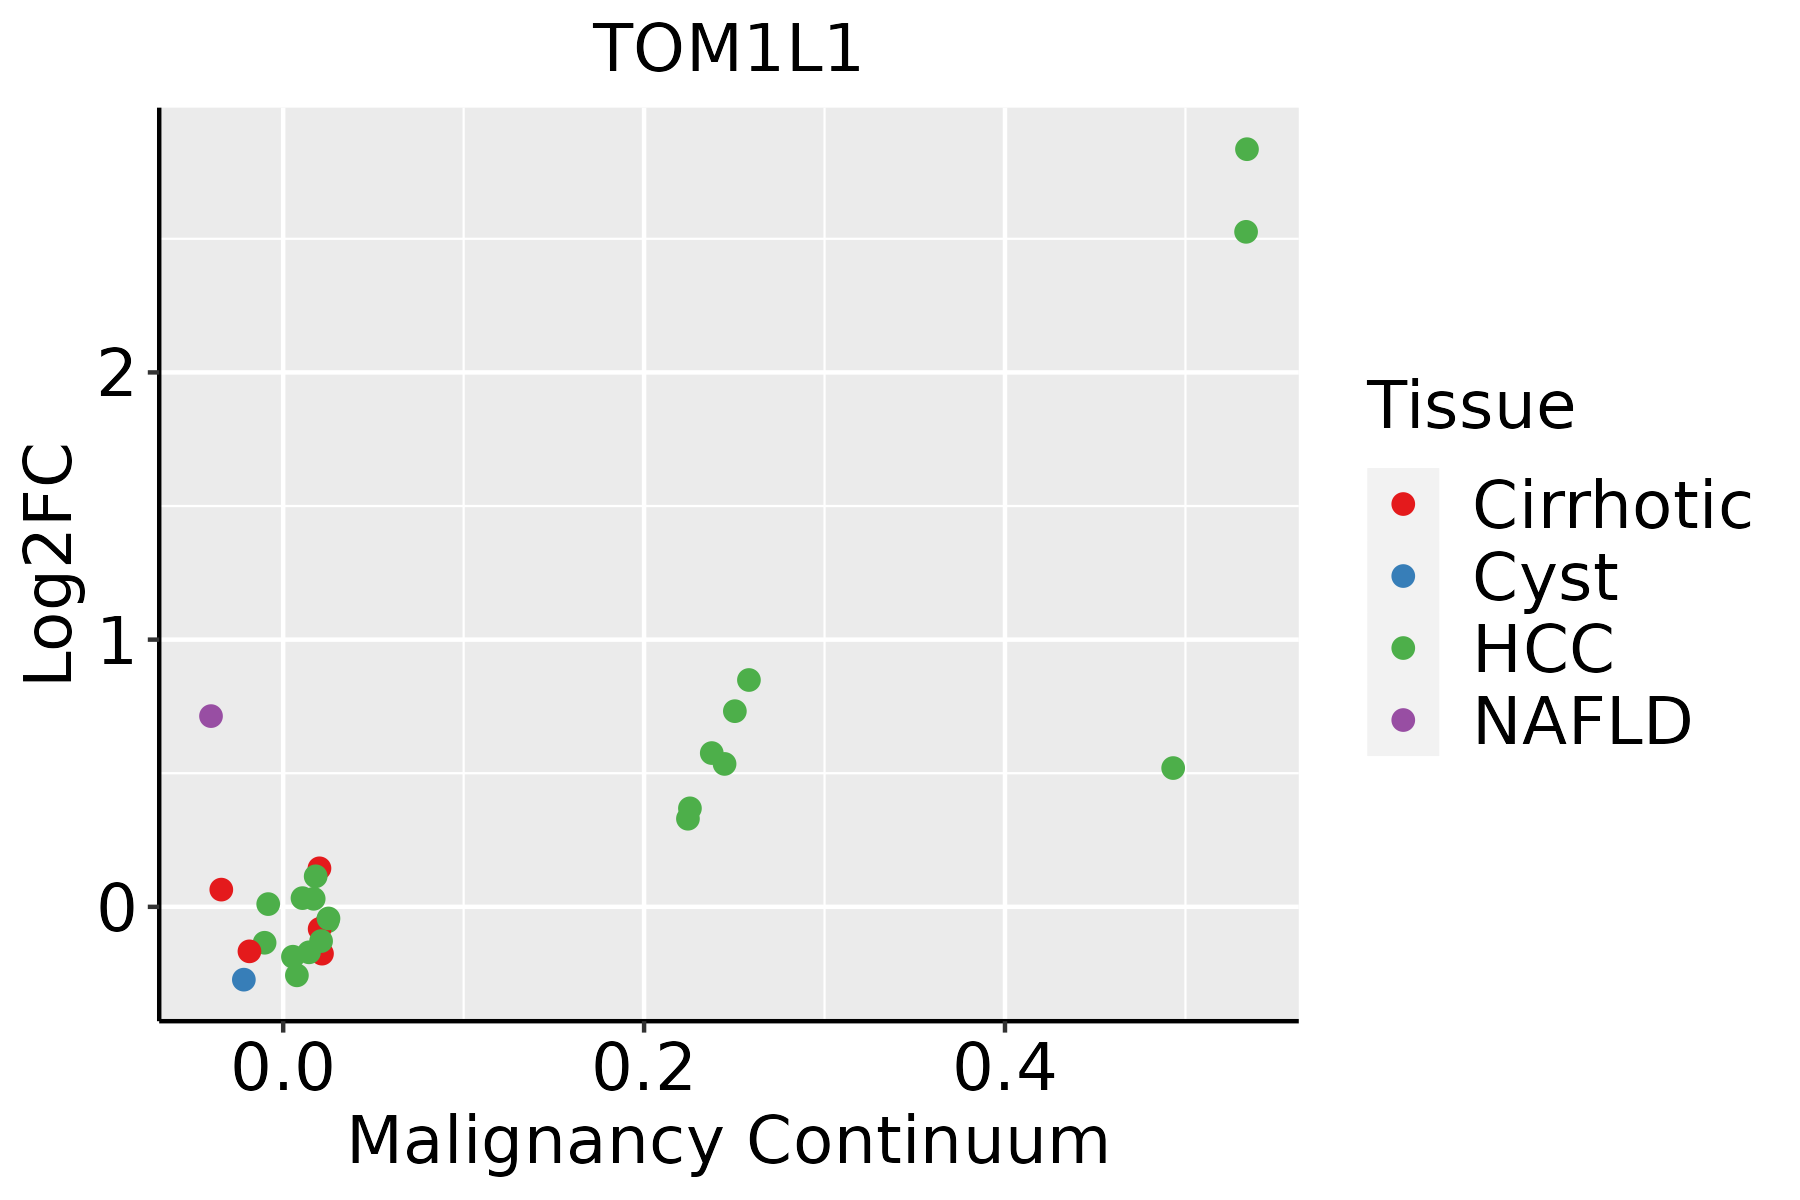
HCC: Hepatocellular carcinoma
NAFLD: Non-alcoholic fatty liver disease
Oral CavityThe image shows the transcriptomic changes along malignancy continuum.log2FC in expression of this searched gene in stem-like cells from each diseased tissue sample relative to stem-like cells in normal samples in each tissue plotted against the malignancy continuum. Samples are colored based on if they are from different disease stage.
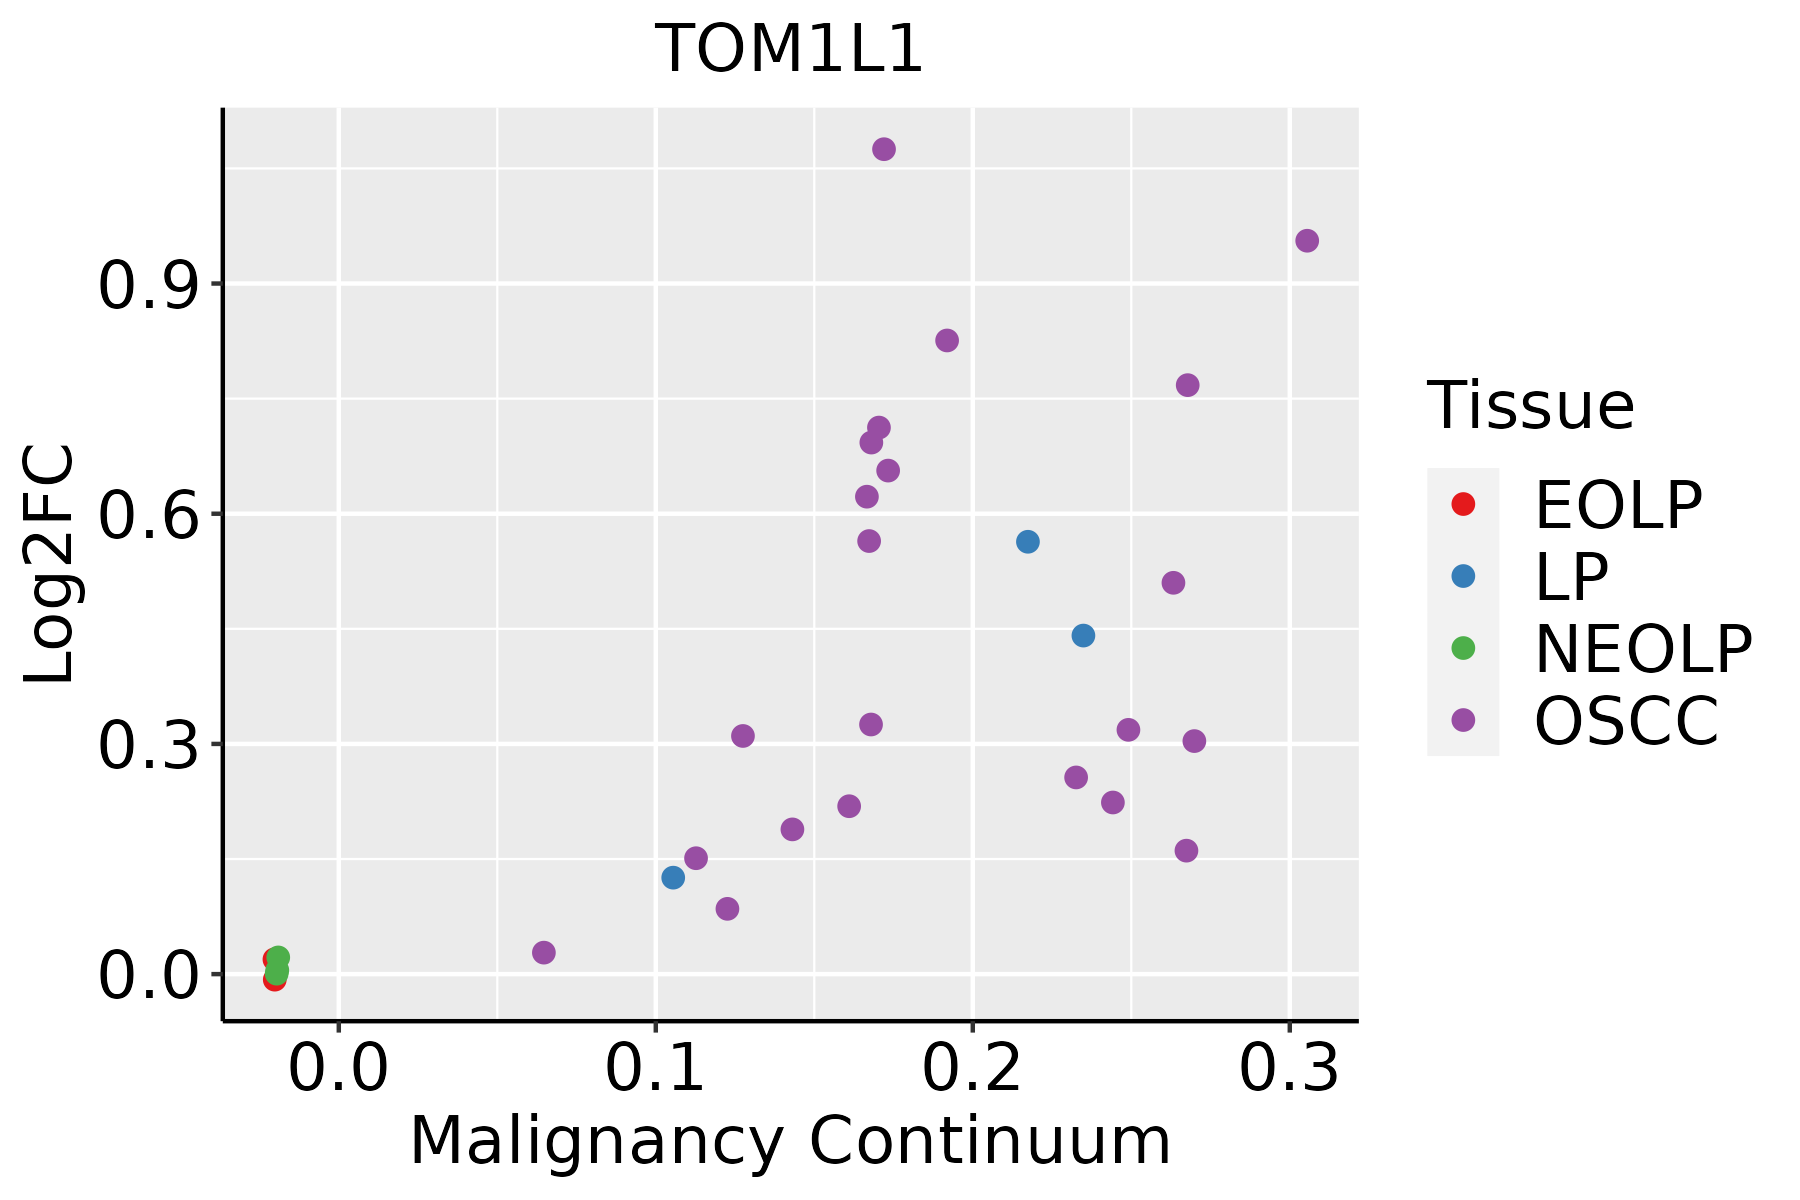
EOLP: Erosive Oral lichen planus
LP: leukoplakia
NEOLP: Non-erosive oral lichen planus
OSCC: Oral squamous cell carcinoma
SkinThe image shows the transcriptomic changes along malignancy continuum.log2FC in expression of this searched gene in stem-like cells from each diseased tissue sample relative to stem-like cells in normal samples in each tissue plotted against the malignancy continuum. Samples are colored based on if they are from different disease stage.AK: Actinic keratosis
cSCC: Cutaneous squamous cell carcinoma
SCCIS:squamous cell carcinoma in situ
ThyroidThe image shows the transcriptomic changes along malignancy continuum.log2FC in expression of this searched gene in stem-like cells from each diseased tissue sample relative to stem-like cells in normal samples in each tissue plotted against the malignancy continuum. Samples are colored based on if they are from different disease stage.ATC: Anaplastic thyroid cancer
HT: Hashimoto's thyroiditis
PTC: Papillary thyroid cancer
∗log2FC in expression of this searched gene in stem-like cells from each diseased tissue sample relative to stem-like cells in normal samples in each tissue plotted against the malignancy continuum. Samples are colored based on if they are from different disease stage.

Top

Malignant transformation related pathway analysis

check buttonFind out the enriched GO biological processes and KEGG pathways involved in transition from healthy to precancer to cancer
check button Figure of enriched GO biological processes.
TissueDisease StageEnriched GO biological Processes
ColorectumADGO analysis - Figure of enriched GO biological processes: Top 15 enriched GO BP terms are showed in the bar plot of each disease state in each tissue. Each row represents a significant GO biological process which is colored according to the -log10(p.adjust).
ColorectumSERGO analysis - Figure of enriched GO biological processes: Top 15 enriched GO BP terms are showed in the bar plot of each disease state in each tissue. Each row represents a significant GO biological process which is colored according to the -log10(p.adjust).
ColorectumMSSGO analysis - Figure of enriched GO biological processes: Top 15 enriched GO BP terms are showed in the bar plot of each disease state in each tissue. Each row represents a significant GO biological process which is colored according to the -log10(p.adjust).
ColorectumMSI-HGO analysis - Figure of enriched GO biological processes: Top 15 enriched GO BP terms are showed in the bar plot of each disease state in each tissue. Each row represents a significant GO biological process which is colored according to the -log10(p.adjust).
ColorectumFAPGO analysis - Figure of enriched GO biological processes: Top 15 enriched GO BP terms are showed in the bar plot of each disease state in each tissue. Each row represents a significant GO biological process which is colored according to the -log10(p.adjust).
∗Top 15 enriched GO BP terms are showed in the bar plot of each disease state in each tissue. Each row represents a significant GO biological process which is colored according to the -log10(p.adjust).
Page: 1 2 3 4 5 6 7 8 9 

check button Enriched GO biological processes.
GO IDTissueDisease StageDescriptionGene RatioBg Ratiopvaluep.adjustCount
GO:00431621LiverHCCubiquitin-dependent protein catabolic process via the multivesicular body sorting pathway17/795823/187232.28e-031.13e-0217
GO:0051784LiverHCCnegative regulation of nuclear division34/795856/187234.54e-031.96e-0234
GO:00321471LiverHCCactivation of protein kinase activity72/7958134/187235.61e-032.33e-0272
GO:01400145Oral cavityOSCCmitotic nuclear division191/7305287/187231.99e-213.70e-19191
GO:00073469Oral cavityOSCCregulation of mitotic cell cycle266/7305457/187233.87e-173.41e-15266
GO:00482852Oral cavityOSCCorganelle fission265/7305488/187233.22e-121.27e-10265
GO:00002801Oral cavityOSCCnuclear division237/7305439/187239.62e-112.90e-09237
GO:001063918Oral cavityOSCCnegative regulation of organelle organization190/7305348/187232.12e-094.97e-08190
GO:00457864Oral cavityOSCCnegative regulation of cell cycle206/7305385/187234.28e-099.55e-08206
GO:00459304Oral cavityOSCCnegative regulation of mitotic cell cycle132/7305235/187236.51e-081.16e-06132
GO:00070882Oral cavityOSCCregulation of mitotic nuclear division68/7305110/187231.05e-061.41e-0568
GO:00109483Oral cavityOSCCnegative regulation of cell cycle process155/7305294/187231.11e-061.48e-05155
GO:00467779Oral cavityOSCCprotein autophosphorylation123/7305227/187232.31e-062.93e-05123
GO:004586016Oral cavityOSCCpositive regulation of protein kinase activity194/7305386/187233.90e-064.59e-05194
GO:003367418Oral cavityOSCCpositive regulation of kinase activity228/7305467/187238.31e-068.90e-05228
GO:0051783Oral cavityOSCCregulation of nuclear division78/7305139/187233.13e-052.86e-0478
GO:00458392Oral cavityOSCCnegative regulation of mitotic nuclear division32/730548/187239.60e-057.25e-0432
GO:00431622Oral cavityOSCCubiquitin-dependent protein catabolic process via the multivesicular body sorting pathway17/730523/187237.28e-043.98e-0317
GO:00517842Oral cavityOSCCnegative regulation of nuclear division34/730556/187238.17e-044.35e-0334
GO:0031952Oral cavityOSCCregulation of protein autophosphorylation27/730543/187231.35e-036.62e-0327
Page: 1 2 3 4 5 6 7 8 

check button Enriched KEGG pathways.
Pathway IDTissueDisease StageDescriptionGene RatioBg Ratiopvaluep.adjustqvalueCount
Page: 1 

Top

Cell-cell communication analysis

check buttonIdentification of potential cell-cell interactions between two cell types and their ligand-receptor pairs for different disease states
LigandReceptorLRpairPathwayTissueDisease Stage
Page: 1 

Top

Single-cell gene regulatory network inference analysis

check buttonFind out the significant the regulons (TFs) and the target genes of each regulon across cell types for different disease states
TFCell TypeTissueDisease StageTarget GeneRSSRegulon Activity
∗The dot plots of a searched regulon are shown for all cell subpopulations in each disease state of each tissue based on the regulon specific score inferred using pySCENIC and by calculating the average expression.
Page: 1 

Top

Somatic mutation of malignant transformation related genes

check buttonAnnotation of somatic variants for genes involved in malignant transformation
Hugo SymbolVariant ClassVariant ClassificationdbSNP RSHGVScHGVSpHGVSp ShortSWISSPROTBIOTYPESIFTPolyPhenTumor Sample BarcodeTissueHistologySexAgeStageTherapy TypesDrugsOutcome
TOM1L1SNVMissense_Mutationc.592N>Tp.Val198Phep.V198FO75674protein_codingdeleterious(0)probably_damaging(0.961)TCGA-AR-A24H-01Breastbreast invasive carcinomaFemale>=65I/IIHormone TherapytamoxiphenSD
TOM1L1SNVMissense_Mutationnovelc.1231N>Gp.Thr411Alap.T411AO75674protein_codingtolerated(0.34)benign(0.003)TCGA-JL-A3YW-01Breastbreast invasive carcinomaFemale<65I/IIUnknownUnknownSD
TOM1L1insertionFrame_Shift_Insnovelc.564_565insAGCTTAAGAATTGTGTTTTCGGCTGGGTGCGGTGp.Ala189SerfsTer31p.A189Sfs*31O75674protein_codingTCGA-A8-A07U-01Breastbreast invasive carcinomaFemale>=65III/IVChemotherapy5-fluorouracilSD
TOM1L1deletionFrame_Shift_Delnovelc.970delNp.Arg325GlyfsTer13p.R325Gfs*13O75674protein_codingTCGA-D8-A27V-01Breastbreast invasive carcinomaFemale<65I/IIHormone TherapytamoxiphenSD
TOM1L1SNVMissense_Mutationnovelc.1122N>Tp.Glu374Aspp.E374DO75674protein_codingtolerated(0.07)benign(0.001)TCGA-2W-A8YY-01Cervixcervical & endocervical cancerFemale<65I/IIChemotherapycisplatinCR
TOM1L1SNVMissense_Mutationc.1095N>Cp.Met365Ilep.M365IO75674protein_codingtolerated(0.09)benign(0.01)TCGA-DR-A0ZM-01Cervixcervical & endocervical cancerFemale<65III/IVUnspecificCisplatinSD
TOM1L1SNVMissense_Mutationc.820G>Ap.Glu274Lysp.E274KO75674protein_codingtolerated(0.08)probably_damaging(0.969)TCGA-IR-A3LK-01Cervixcervical & endocervical cancerFemale>=65I/IIChemotherapycisplatinPD
TOM1L1SNVMissense_Mutationnovelc.439G>Tp.Val147Phep.V147FO75674protein_codingtolerated(0.09)benign(0.026)TCGA-VS-A9U6-01Cervixcervical & endocervical cancerFemale<65I/IIChemotherapycisplatinPD
TOM1L1SNVMissense_Mutationc.286N>Ap.Phe96Ilep.F96IO75674protein_codingdeleterious(0)probably_damaging(0.968)TCGA-A6-2686-01Colorectumcolon adenocarcinomaFemale>=65I/IIUnknownUnknownSD
TOM1L1SNVMissense_Mutationnovelc.366N>Ap.Phe122Leup.F122LO75674protein_codingtolerated(0.74)benign(0.141)TCGA-AZ-4315-01Colorectumcolon adenocarcinomaMale<65I/IIUnknownUnknownSD
Page: 1 2 3 

Top

Related drugs of malignant transformation related genes

check buttonIdentification of chemicals and drugs interact with genes involved in malignant transfromation
(DGIdb 4.0)
Entrez IDSymbolCategoryInteraction TypesDrug Claim NameDrug NamePMIDs
Page: 1