
|
|||||
|
 | |
| |
| |
| |
| |
| |
|
Gene: TMEM30A |
Gene summary for TMEM30A |
| Gene information | Species | Human | Gene symbol | TMEM30A | Gene ID | 55754 |
| Gene name | transmembrane protein 30A | |
| Gene Alias | C6orf67 | |
| Cytomap | 6q14.1 | |
| Gene Type | protein-coding | GO ID | GO:0006810 | UniProtAcc | Q9NV96 |
Top |
Malignant transformation analysis |
| Identification of the aberrant gene expression in precancerous and cancerous lesions by comparing the gene expression of stem-like cells in diseased tissues with normal stem cells |
| Entrez ID | Symbol | Replicates | Species | Organ | Tissue | Adj P-value | Log2FC | Malignancy |
| 55754 | TMEM30A | LZE2T | Human | Esophagus | ESCC | 2.01e-03 | 3.80e-01 | 0.082 |
| 55754 | TMEM30A | LZE4T | Human | Esophagus | ESCC | 1.11e-13 | 3.95e-01 | 0.0811 |
| 55754 | TMEM30A | LZE7T | Human | Esophagus | ESCC | 1.20e-03 | 5.85e-01 | 0.0667 |
| 55754 | TMEM30A | LZE8T | Human | Esophagus | ESCC | 3.37e-08 | 3.47e-02 | 0.067 |
| 55754 | TMEM30A | LZE20T | Human | Esophagus | ESCC | 2.02e-05 | 1.27e-01 | 0.0662 |
| 55754 | TMEM30A | LZE24T | Human | Esophagus | ESCC | 1.31e-15 | 6.09e-01 | 0.0596 |
| 55754 | TMEM30A | LZE21T | Human | Esophagus | ESCC | 9.15e-04 | 7.20e-02 | 0.0655 |
| 55754 | TMEM30A | LZE6T | Human | Esophagus | ESCC | 2.45e-03 | 1.92e-01 | 0.0845 |
| 55754 | TMEM30A | P1T-E | Human | Esophagus | ESCC | 5.06e-07 | 2.98e-01 | 0.0875 |
| 55754 | TMEM30A | P2T-E | Human | Esophagus | ESCC | 1.92e-33 | 6.57e-01 | 0.1177 |
| 55754 | TMEM30A | P4T-E | Human | Esophagus | ESCC | 4.09e-20 | 6.67e-01 | 0.1323 |
| 55754 | TMEM30A | P5T-E | Human | Esophagus | ESCC | 2.83e-16 | 3.70e-01 | 0.1327 |
| 55754 | TMEM30A | P8T-E | Human | Esophagus | ESCC | 3.52e-40 | 9.84e-01 | 0.0889 |
| 55754 | TMEM30A | P9T-E | Human | Esophagus | ESCC | 1.06e-07 | 2.12e-01 | 0.1131 |
| 55754 | TMEM30A | P10T-E | Human | Esophagus | ESCC | 3.91e-35 | 7.01e-01 | 0.116 |
| 55754 | TMEM30A | P11T-E | Human | Esophagus | ESCC | 1.60e-16 | 9.80e-01 | 0.1426 |
| 55754 | TMEM30A | P12T-E | Human | Esophagus | ESCC | 1.69e-33 | 7.10e-01 | 0.1122 |
| 55754 | TMEM30A | P15T-E | Human | Esophagus | ESCC | 3.74e-31 | 9.14e-01 | 0.1149 |
| 55754 | TMEM30A | P16T-E | Human | Esophagus | ESCC | 2.63e-34 | 7.43e-01 | 0.1153 |
| 55754 | TMEM30A | P17T-E | Human | Esophagus | ESCC | 8.79e-08 | 5.30e-01 | 0.1278 |
| Page: 1 2 3 4 5 6 7 8 |
| Tissue | Expression Dynamics | Abbreviation |
| Esophagus | 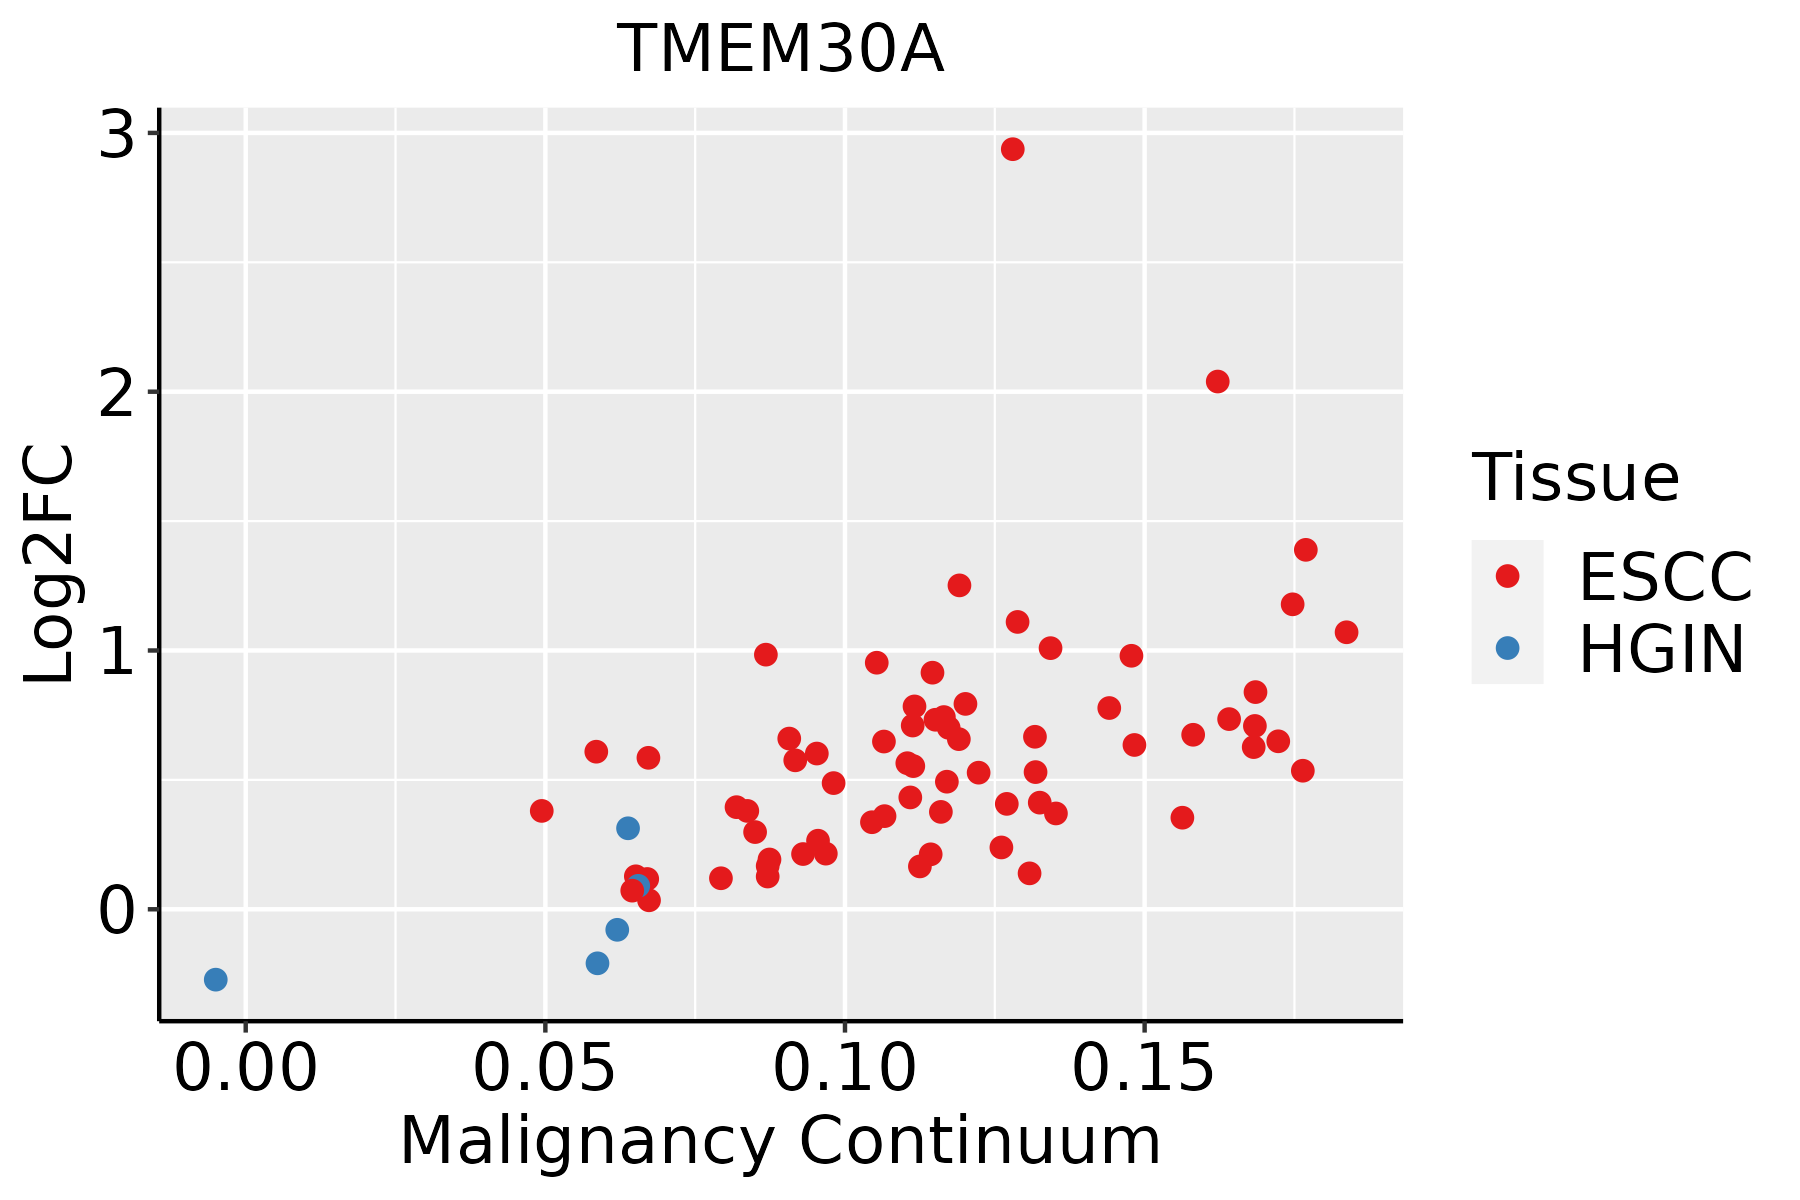 | ESCC: Esophageal squamous cell carcinoma |
| HGIN: High-grade intraepithelial neoplasias | ||
| LGIN: Low-grade intraepithelial neoplasias | ||
| Liver | 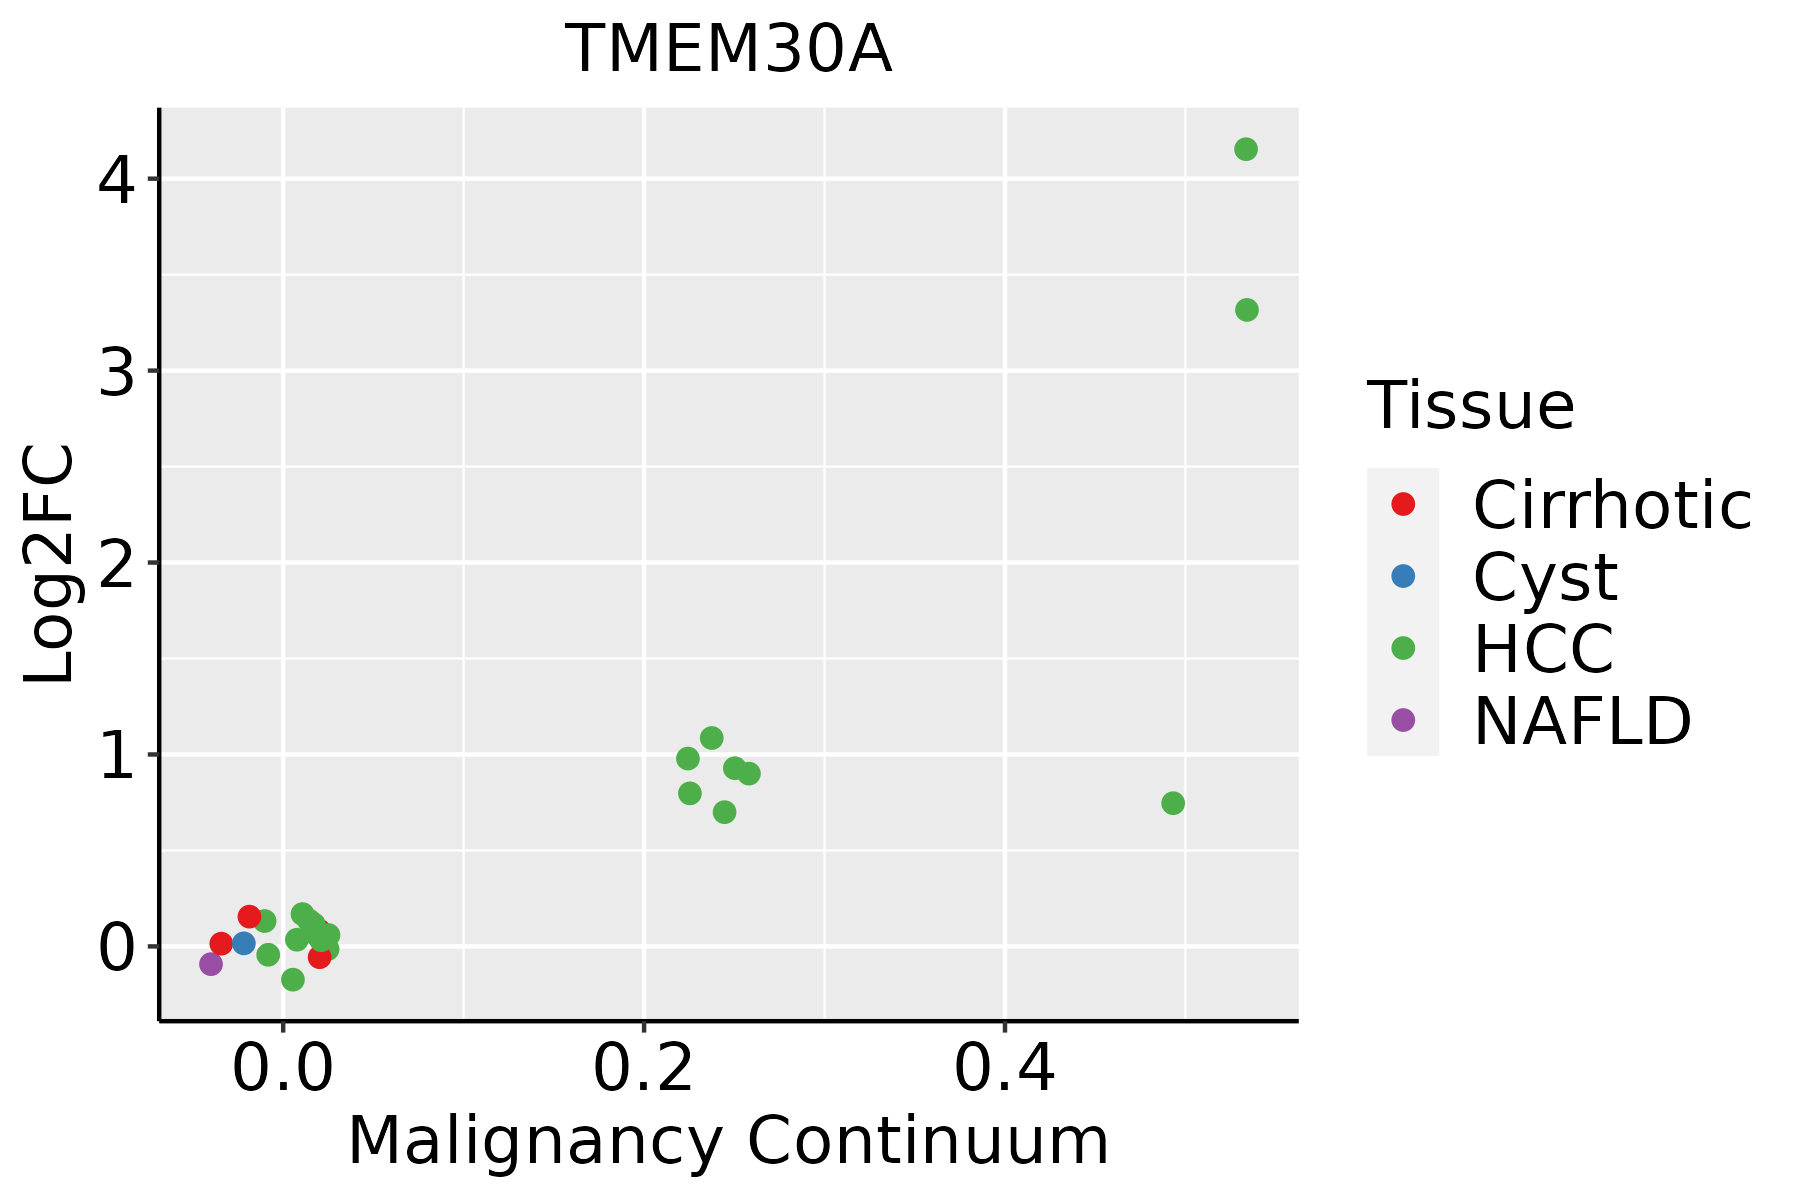 | HCC: Hepatocellular carcinoma |
| NAFLD: Non-alcoholic fatty liver disease | ||
| Oral Cavity | 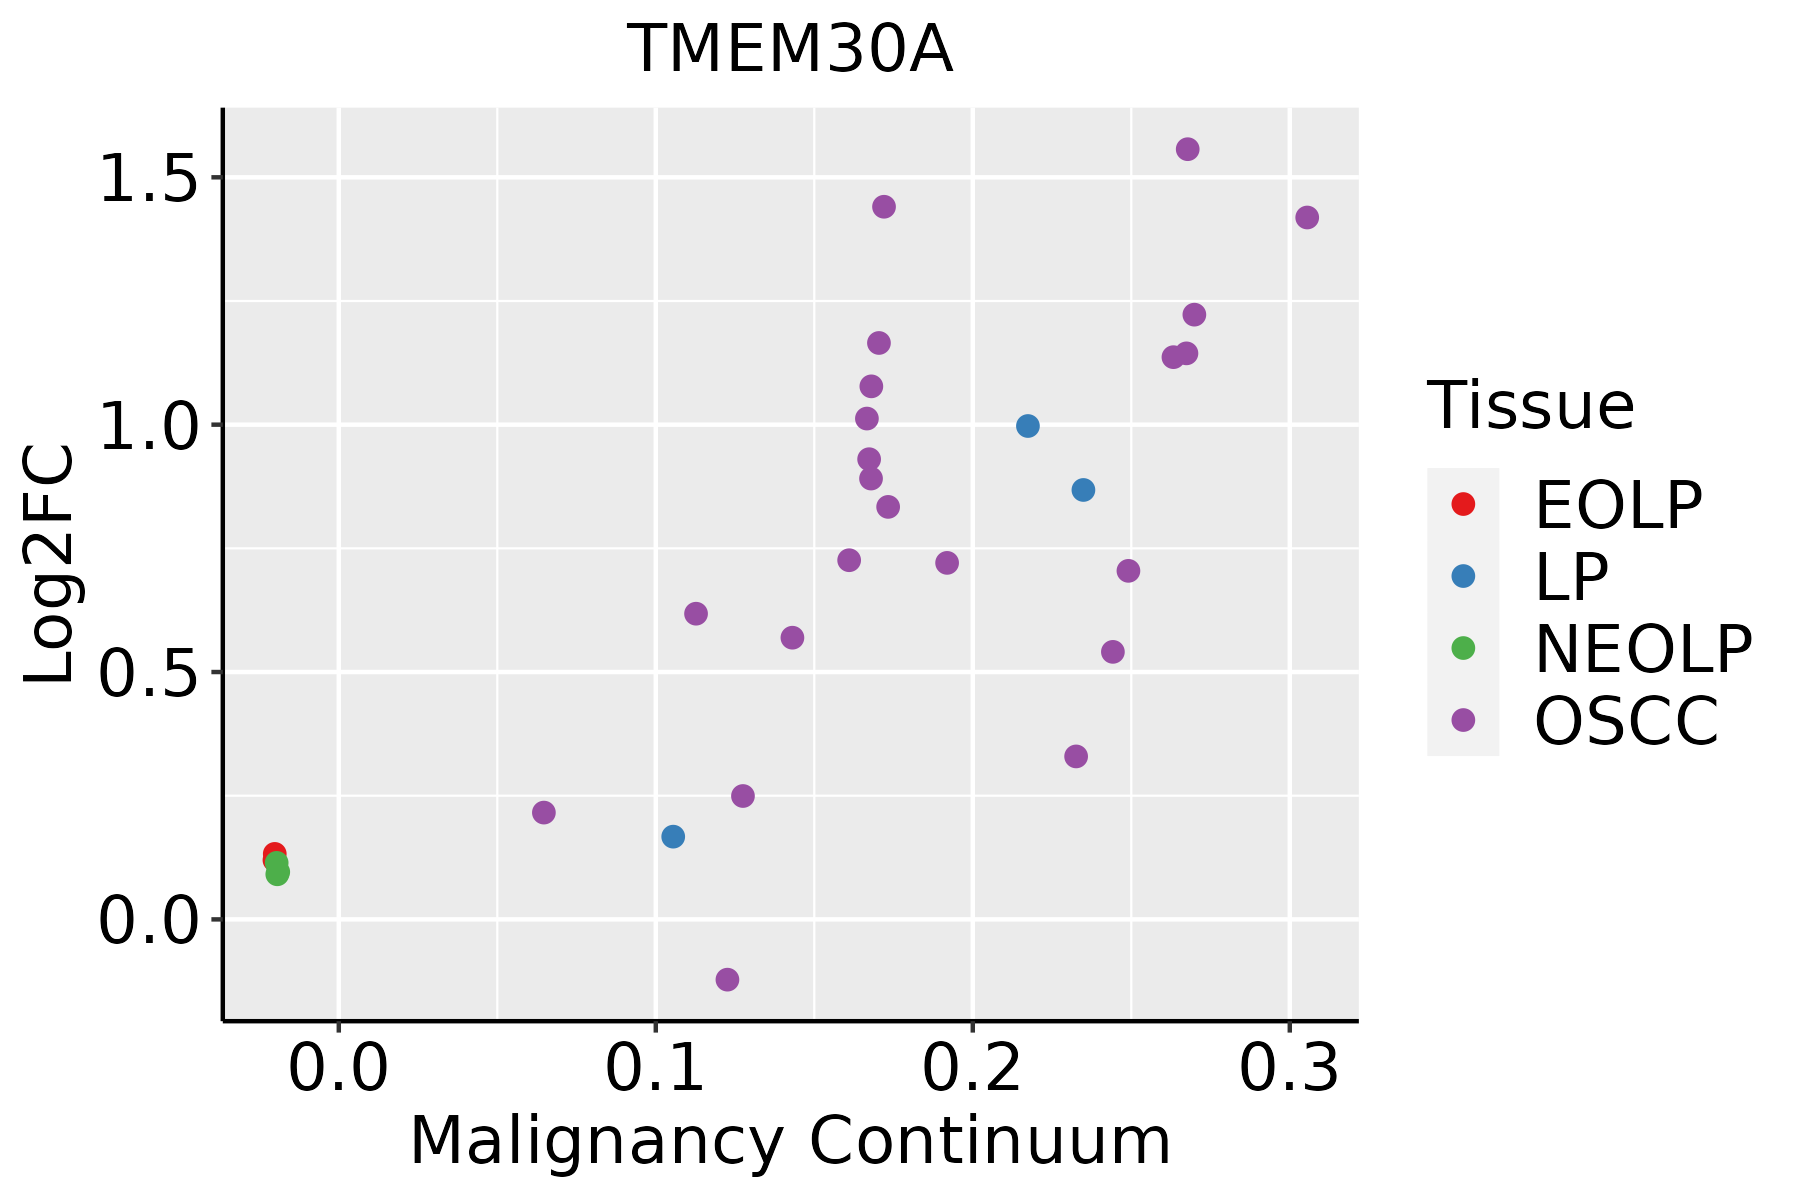 | EOLP: Erosive Oral lichen planus |
| LP: leukoplakia | ||
| NEOLP: Non-erosive oral lichen planus | ||
| OSCC: Oral squamous cell carcinoma | ||
| Prostate | 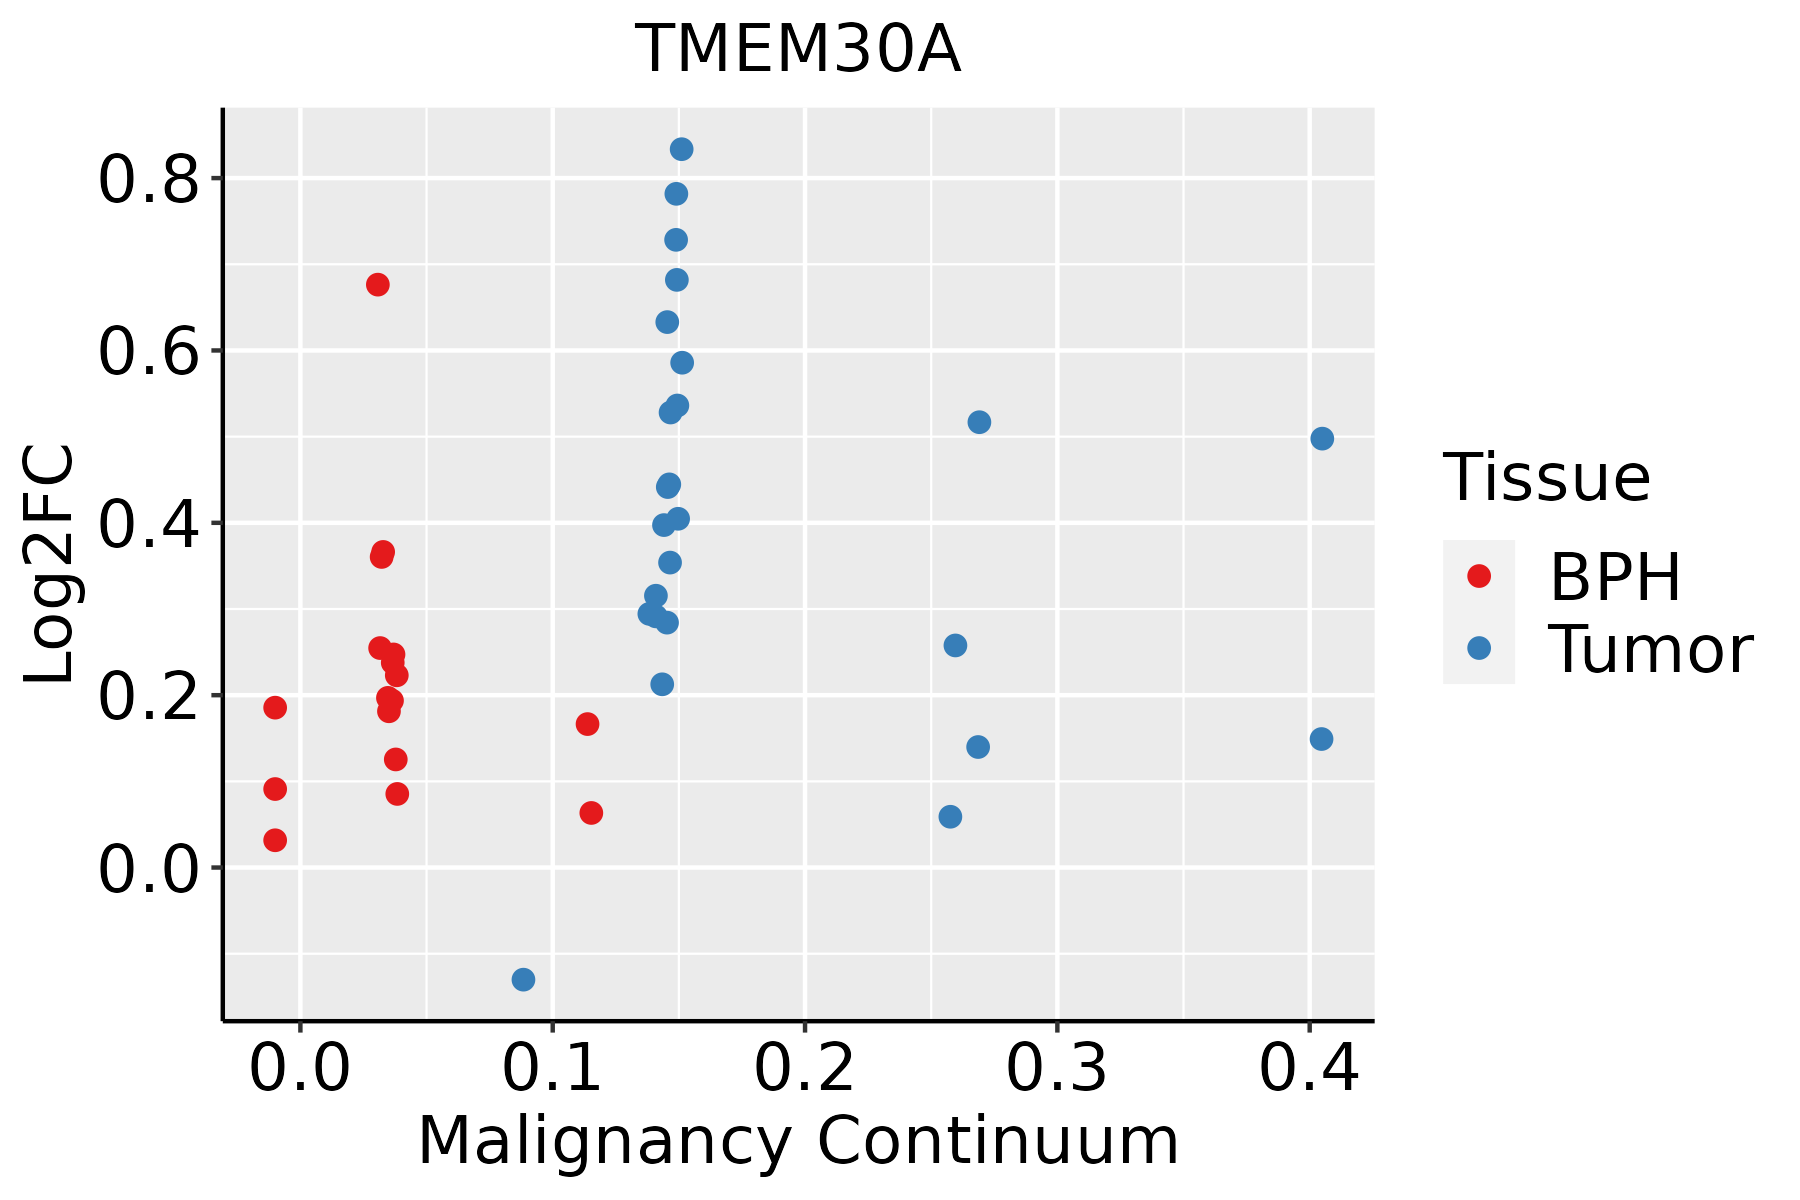 | BPH: Benign Prostatic Hyperplasia |
| Skin | 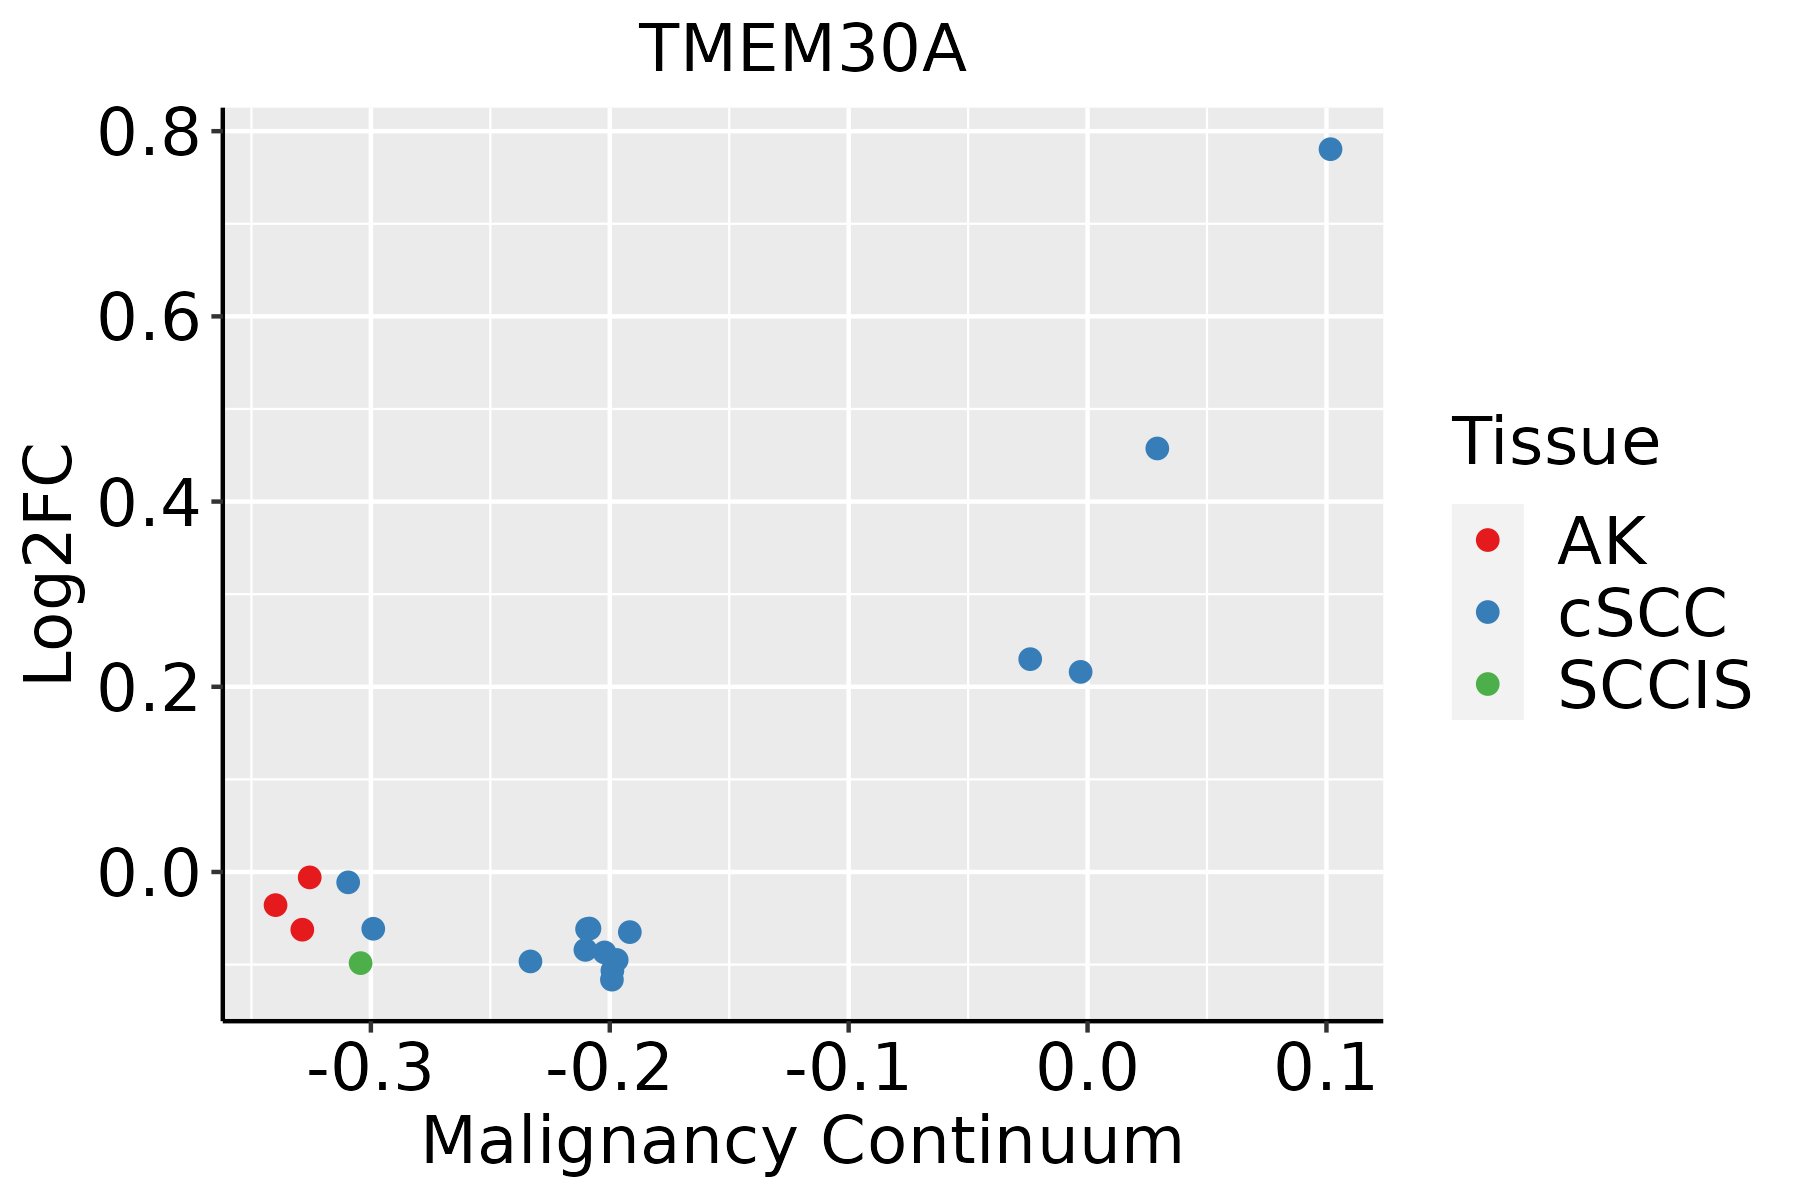 | AK: Actinic keratosis |
| cSCC: Cutaneous squamous cell carcinoma | ||
| SCCIS:squamous cell carcinoma in situ | ||
| Thyroid | 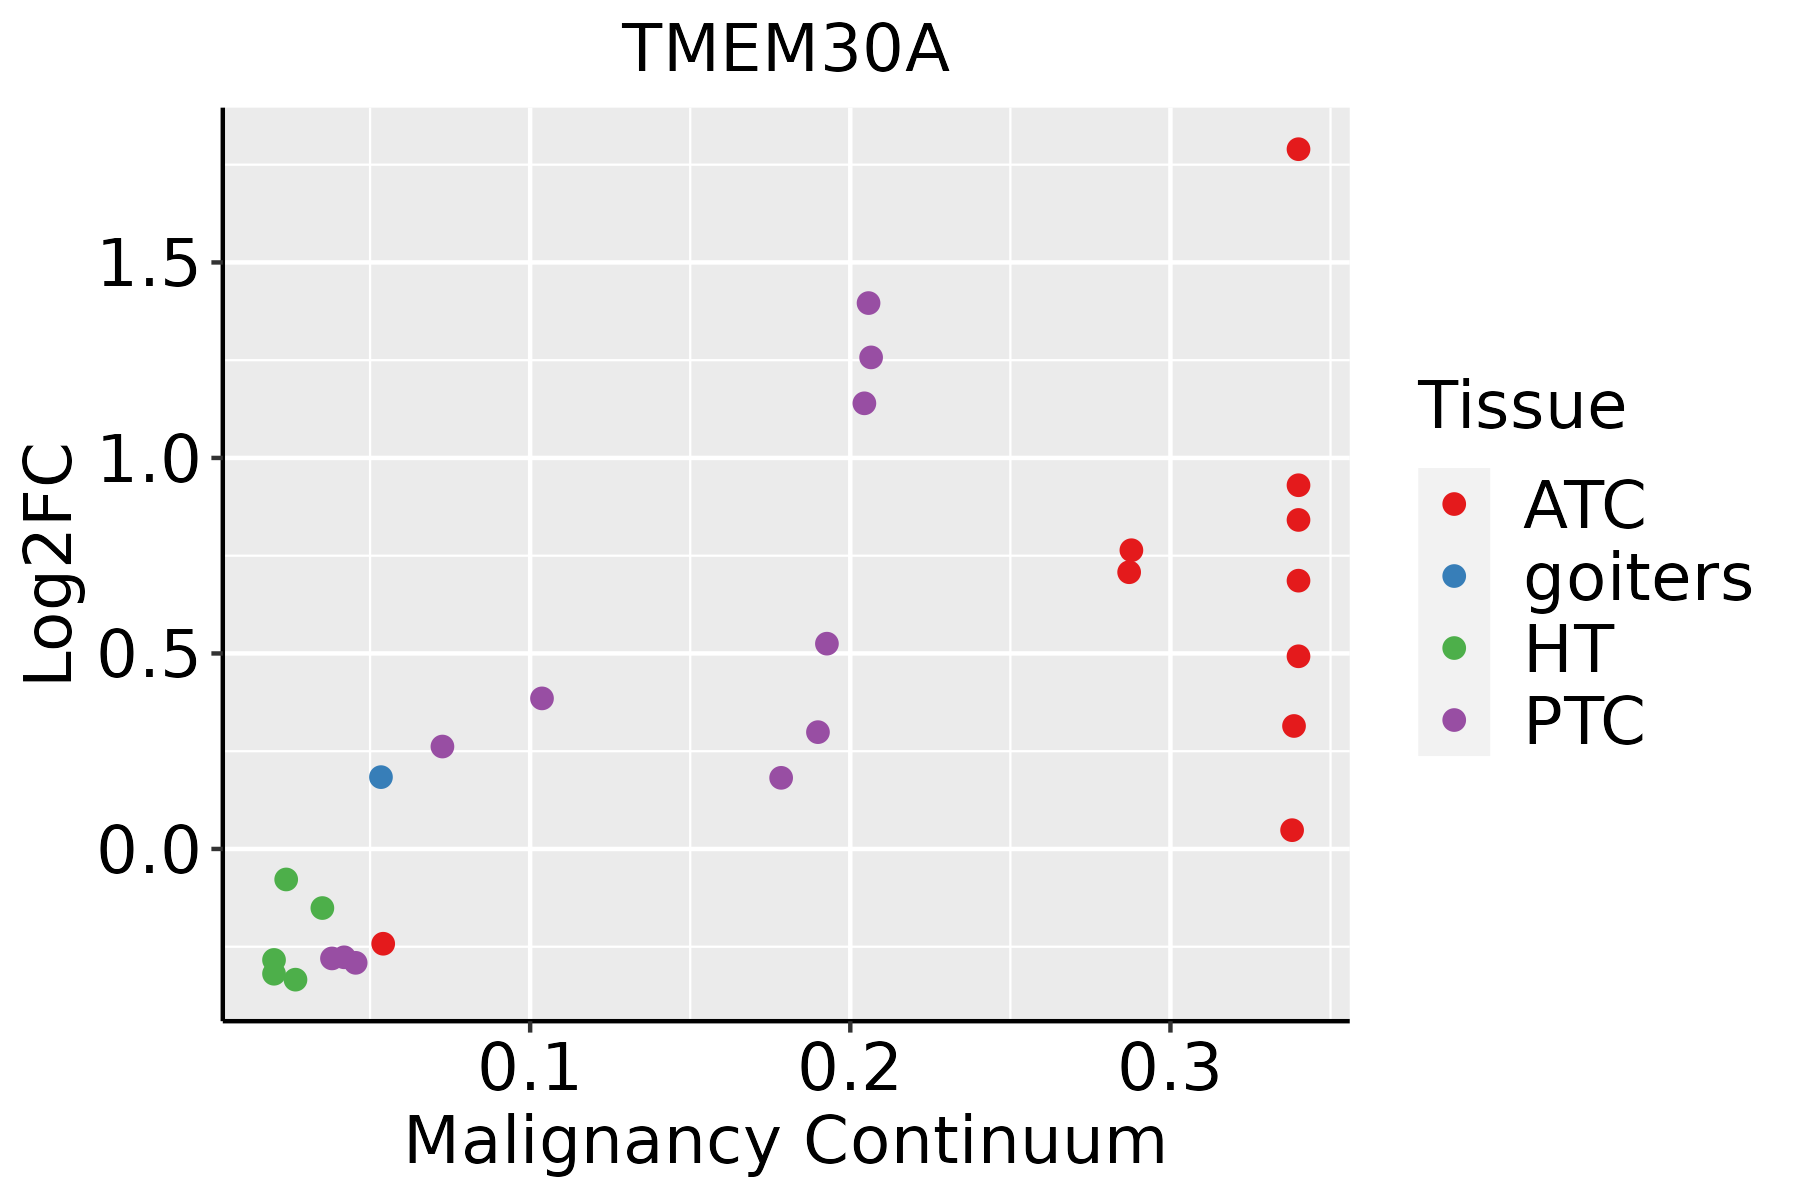 | ATC: Anaplastic thyroid cancer |
| HT: Hashimoto's thyroiditis | ||
| PTC: Papillary thyroid cancer |
| ∗log2FC in expression of this searched gene in stem-like cells from each diseased tissue sample relative to stem-like cells in normal samples in each tissue plotted against the malignancy continuum. Samples are colored based on if they are from different disease stage. |
Top |
Malignant transformation related pathway analysis |
| Find out the enriched GO biological processes and KEGG pathways involved in transition from healthy to precancer to cancer |
| Tissue | Disease Stage | Enriched GO biological Processes |
| Colorectum | AD |  |
| Colorectum | SER |  |
| Colorectum | MSS |  |
| Colorectum | MSI-H |  |
| Colorectum | FAP |  |
| ∗Top 15 enriched GO BP terms are showed in the bar plot of each disease state in each tissue. Each row represents a significant GO biological process which is colored according to the -log10(p.adjust). |
| Page: 1 2 3 4 5 6 7 8 9 |
| GO ID | Tissue | Disease Stage | Description | Gene Ratio | Bg Ratio | pvalue | p.adjust | Count |
| GO:003601012 | Oral cavity | LP | protein localization to endosome | 14/4623 | 24/18723 | 4.52e-04 | 4.30e-03 | 14 |
| GO:007086112 | Oral cavity | LP | regulation of protein exit from endoplasmic reticulum | 14/4623 | 27/18723 | 2.14e-03 | 1.57e-02 | 14 |
| GO:0070863 | Oral cavity | LP | positive regulation of protein exit from endoplasmic reticulum | 9/4623 | 15/18723 | 3.82e-03 | 2.48e-02 | 9 |
| GO:003134615 | Oral cavity | LP | positive regulation of cell projection organization | 109/4623 | 353/18723 | 4.59e-03 | 2.93e-02 | 109 |
| GO:001097612 | Oral cavity | LP | positive regulation of neuron projection development | 55/4623 | 163/18723 | 5.74e-03 | 3.44e-02 | 55 |
| GO:003238622 | Oral cavity | EOLP | regulation of intracellular transport | 91/2218 | 337/18723 | 1.51e-14 | 6.47e-12 | 91 |
| GO:003315722 | Oral cavity | EOLP | regulation of intracellular protein transport | 63/2218 | 229/18723 | 7.28e-11 | 9.09e-09 | 63 |
| GO:005122225 | Oral cavity | EOLP | positive regulation of protein transport | 72/2218 | 303/18723 | 4.20e-09 | 2.41e-07 | 72 |
| GO:003238822 | Oral cavity | EOLP | positive regulation of intracellular transport | 54/2218 | 202/18723 | 4.95e-09 | 2.74e-07 | 54 |
| GO:190495125 | Oral cavity | EOLP | positive regulation of establishment of protein localization | 73/2218 | 319/18723 | 1.80e-08 | 7.94e-07 | 73 |
| GO:003252721 | Oral cavity | EOLP | protein exit from endoplasmic reticulum | 20/2218 | 48/18723 | 1.68e-07 | 5.43e-06 | 20 |
| GO:009031622 | Oral cavity | EOLP | positive regulation of intracellular protein transport | 42/2218 | 160/18723 | 4.18e-07 | 1.19e-05 | 42 |
| GO:003134621 | Oral cavity | EOLP | positive regulation of cell projection organization | 74/2218 | 353/18723 | 6.00e-07 | 1.56e-05 | 74 |
| GO:001097515 | Oral cavity | EOLP | regulation of neuron projection development | 86/2218 | 445/18723 | 2.75e-06 | 6.05e-05 | 86 |
| GO:007086121 | Oral cavity | EOLP | regulation of protein exit from endoplasmic reticulum | 12/2218 | 27/18723 | 2.32e-05 | 3.50e-04 | 12 |
| GO:001097621 | Oral cavity | EOLP | positive regulation of neuron projection development | 35/2218 | 163/18723 | 3.25e-04 | 3.03e-03 | 35 |
| GO:00157483 | Oral cavity | EOLP | organophosphate ester transport | 28/2218 | 140/18723 | 3.66e-03 | 2.05e-02 | 28 |
| GO:003238631 | Oral cavity | NEOLP | regulation of intracellular transport | 77/2005 | 337/18723 | 7.66e-11 | 8.58e-09 | 77 |
| GO:003315731 | Oral cavity | NEOLP | regulation of intracellular protein transport | 53/2005 | 229/18723 | 4.28e-08 | 1.77e-06 | 53 |
| GO:003238831 | Oral cavity | NEOLP | positive regulation of intracellular transport | 45/2005 | 202/18723 | 1.35e-06 | 3.46e-05 | 45 |
| Page: 1 2 3 4 5 6 7 8 |
| Pathway ID | Tissue | Disease Stage | Description | Gene Ratio | Bg Ratio | pvalue | p.adjust | qvalue | Count |
| Page: 1 |
Top |
Cell-cell communication analysis |
| Identification of potential cell-cell interactions between two cell types and their ligand-receptor pairs for different disease states |
| Ligand | Receptor | LRpair | Pathway | Tissue | Disease Stage |
| Page: 1 |
Top |
Single-cell gene regulatory network inference analysis |
| Find out the significant the regulons (TFs) and the target genes of each regulon across cell types for different disease states |
| TF | Cell Type | Tissue | Disease Stage | Target Gene | RSS | Regulon Activity |
| ∗The dot plots of a searched regulon are shown for all cell subpopulations in each disease state of each tissue based on the regulon specific score inferred using pySCENIC and by calculating the average expression. |
| Page: 1 |
Top |
Somatic mutation of malignant transformation related genes |
| Annotation of somatic variants for genes involved in malignant transformation |
| Hugo Symbol | Variant Class | Variant Classification | dbSNP RS | HGVSc | HGVSp | HGVSp Short | SWISSPROT | BIOTYPE | SIFT | PolyPhen | Tumor Sample Barcode | Tissue | Histology | Sex | Age | Stage | Therapy Types | Drugs | Outcome |
| TMEM30A | SNV | Missense_Mutation | novel | c.549A>C | p.Leu183Phe | p.L183F | Q9NV96 | protein_coding | tolerated(0.75) | benign(0.405) | TCGA-A7-A56D-01 | Breast | breast invasive carcinoma | Female | >=65 | I/II | Hormone Therapy | arimidex | SD |
| TMEM30A | SNV | Missense_Mutation | rs766839161 | c.808C>T | p.Arg270Cys | p.R270C | Q9NV96 | protein_coding | deleterious(0) | probably_damaging(1) | TCGA-AN-A046-01 | Breast | breast invasive carcinoma | Female | >=65 | I/II | Unknown | Unknown | SD |
| TMEM30A | SNV | Missense_Mutation | novel | c.149T>G | p.Val50Gly | p.V50G | Q9NV96 | protein_coding | deleterious(0) | possibly_damaging(0.885) | TCGA-LL-A8F5-01 | Breast | breast invasive carcinoma | Female | <65 | I/II | Chemotherapy | cyclophosphamide | SD |
| TMEM30A | deletion | Frame_Shift_Del | novel | c.216delN | p.Asn73ThrfsTer27 | p.N73Tfs*27 | Q9NV96 | protein_coding | TCGA-EW-A2FV-01 | Breast | breast invasive carcinoma | Female | <65 | III/IV | Chemotherapy | docetaxel | SD | ||
| TMEM30A | SNV | Missense_Mutation | novel | c.14N>G | p.Tyr5Cys | p.Y5C | Q9NV96 | protein_coding | tolerated_low_confidence(0.1) | benign(0.005) | TCGA-MA-AA41-01 | Cervix | cervical & endocervical cancer | Female | <65 | I/II | Unknown | Unknown | SD |
| TMEM30A | SNV | Missense_Mutation | c.851C>T | p.Pro284Leu | p.P284L | Q9NV96 | protein_coding | tolerated(0.14) | benign(0.371) | TCGA-A6-2681-01 | Colorectum | colon adenocarcinoma | Female | >=65 | I/II | Unknown | Unknown | PD | |
| TMEM30A | SNV | Missense_Mutation | c.200N>A | p.Gly67Asp | p.G67D | Q9NV96 | protein_coding | deleterious(0.04) | possibly_damaging(0.829) | TCGA-AA-3672-01 | Colorectum | colon adenocarcinoma | Female | >=65 | III/IV | Unknown | Unknown | SD | |
| TMEM30A | SNV | Missense_Mutation | rs766839161 | c.808C>T | p.Arg270Cys | p.R270C | Q9NV96 | protein_coding | deleterious(0) | probably_damaging(1) | TCGA-AA-3977-01 | Colorectum | colon adenocarcinoma | Male | >=65 | I/II | Unknown | Unknown | SD |
| TMEM30A | SNV | Missense_Mutation | rs778890689 | c.920N>A | p.Arg307Gln | p.R307Q | Q9NV96 | protein_coding | tolerated(0.06) | benign(0.393) | TCGA-AA-3984-01 | Colorectum | colon adenocarcinoma | Female | <65 | I/II | Unknown | Unknown | SD |
| TMEM30A | SNV | Missense_Mutation | c.769T>G | p.Phe257Val | p.F257V | Q9NV96 | protein_coding | deleterious(0) | possibly_damaging(0.79) | TCGA-AA-A00N-01 | Colorectum | colon adenocarcinoma | Male | >=65 | I/II | Unknown | Unknown | PD |
| Page: 1 2 3 4 |
Top |
Related drugs of malignant transformation related genes |
| Identification of chemicals and drugs interact with genes involved in malignant transfromation |
| (DGIdb 4.0) |
| Entrez ID | Symbol | Category | Interaction Types | Drug Claim Name | Drug Name | PMIDs |
| Page: 1 |

Copyright 2023-Present -The University of Texas Health Science Center at Houston |