Schematic overview of the cellular and molecular mechanisms involved in the cancer progression, including the proposed cellular and molecular mechanisms in cancer cells trajectory. AT1: alveolar type 1 cells; AT2: alveolar type 2 cells; AAH: atypical adenomatous hyperplasia; AIS: adenocarcinoma in situ; MIA: minimally invasive adenocarcinoma; IA: invasive adenocarcinoma; EMT: epithelial-mesenchymal transition

Home

Download

Statistics

Help

Contact

Center for Computational Systems Medicine
leaf

Gene summary

leaf

Malignant transformation analysis

leaf

Malignant transformation related pathway analysis

leaf

Cell-cell communication analysis

leaf

Single-cell gene regulatory network inference analysis

leaf

Somatic mutation of malignant transformation related genes

leaf

Related drugs of malignant transformation related genes

Gene: TMEM109

Gene summary for TMEM109

check button Gene summary.

Gene informationSpeciesHuman
Gene symbol

TMEM109

Gene ID

79073

Gene nametransmembrane protein 109
Gene AliasTMEM109
Cytomap11q12.2
Gene Typeprotein-coding
GO ID

GO:0006810

UniProtAcc

Q9BVC6


Top

Malignant transformation analysis

check button Identification of the aberrant gene expression in precancerous and cancerous lesions by comparing the gene expression of stem-like cells in diseased tissues with normal stem cells
check button Malignant transformation involving gene list.
Entrez IDSymbolReplicatesSpeciesOrganTissueAdj P-valueLog2FCMalignancy
79073TMEM109LZE2THumanEsophagusESCC3.00e-039.12e-010.082
79073TMEM109LZE3DHumanEsophagusHGIN4.48e-024.91e-010.0668
79073TMEM109LZE4THumanEsophagusESCC1.83e-156.36e-010.0811
79073TMEM109LZE7THumanEsophagusESCC2.58e-024.18e-010.0667
79073TMEM109LZE8THumanEsophagusESCC3.08e-042.47e-010.067
79073TMEM109LZE20THumanEsophagusESCC6.89e-038.41e-020.0662
79073TMEM109LZE24THumanEsophagusESCC1.68e-176.59e-010.0596
79073TMEM109LZE22D3HumanEsophagusHGIN4.25e-022.53e-010.0653
79073TMEM109LZE21THumanEsophagusESCC7.13e-041.78e-010.0655
79073TMEM109LZE6THumanEsophagusESCC9.77e-103.16e-010.0845
79073TMEM109P1T-EHumanEsophagusESCC1.49e-074.96e-010.0875
79073TMEM109P2T-EHumanEsophagusESCC2.21e-326.88e-010.1177
79073TMEM109P4T-EHumanEsophagusESCC1.90e-391.12e+000.1323
79073TMEM109P5T-EHumanEsophagusESCC6.11e-398.55e-010.1327
79073TMEM109P8T-EHumanEsophagusESCC1.54e-378.53e-010.0889
79073TMEM109P9T-EHumanEsophagusESCC3.54e-286.80e-010.1131
79073TMEM109P10T-EHumanEsophagusESCC4.01e-417.93e-010.116
79073TMEM109P11T-EHumanEsophagusESCC1.92e-281.23e+000.1426
79073TMEM109P12T-EHumanEsophagusESCC1.90e-499.36e-010.1122
79073TMEM109P15T-EHumanEsophagusESCC8.36e-339.21e-010.1149
Page: 1 2 3 4 5 6 

check button Transcriptomic changes along malignancy continuum.
TissueExpression DynamicsAbbreviation
EsophagusThe image shows the transcriptomic changes along malignancy continuum.log2FC in expression of this searched gene in stem-like cells from each diseased tissue sample relative to stem-like cells in normal samples in each tissue plotted against the malignancy continuum. Samples are colored based on if they are from different disease stage.ESCC: Esophageal squamous cell carcinoma
HGIN: High-grade intraepithelial neoplasias
LGIN: Low-grade intraepithelial neoplasias
LiverThe image shows the transcriptomic changes along malignancy continuum.log2FC in expression of this searched gene in stem-like cells from each diseased tissue sample relative to stem-like cells in normal samples in each tissue plotted against the malignancy continuum. Samples are colored based on if they are from different disease stage.
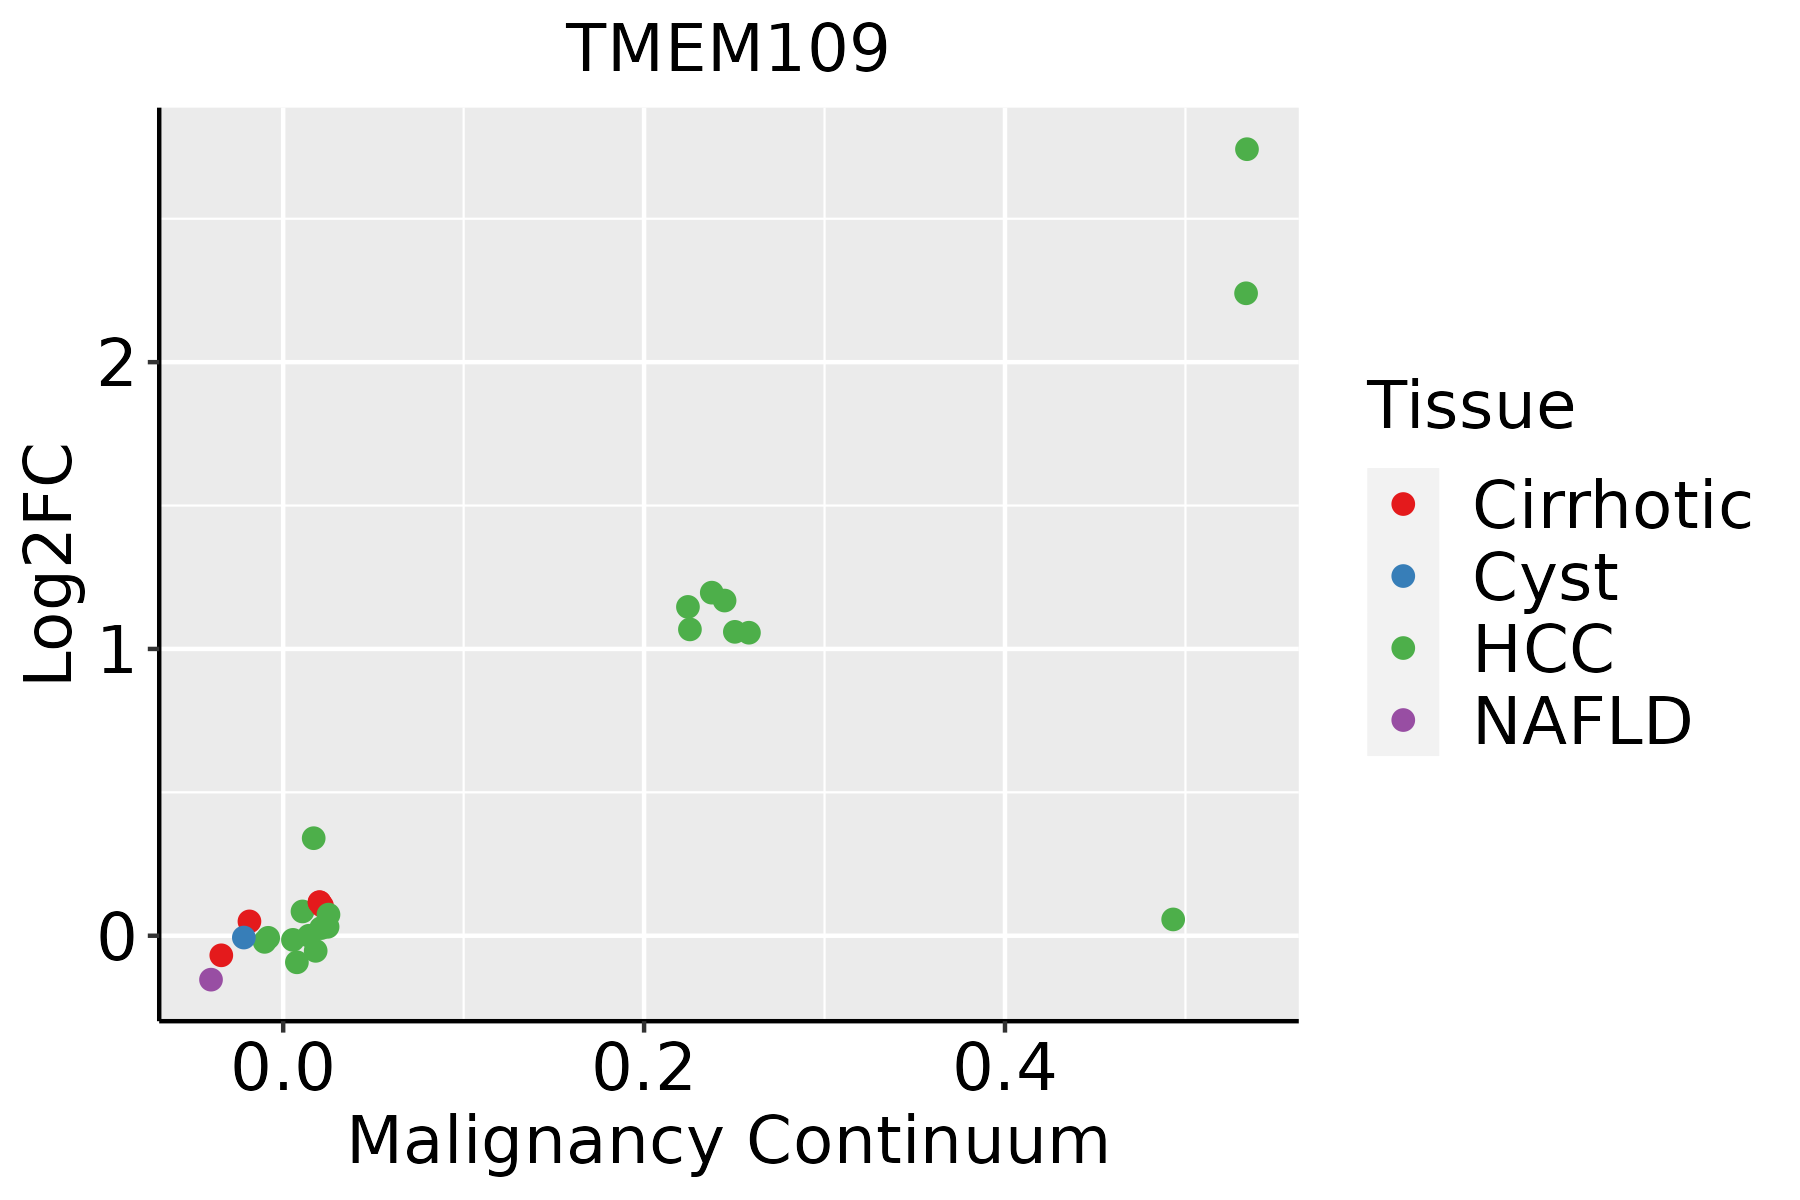
HCC: Hepatocellular carcinoma
NAFLD: Non-alcoholic fatty liver disease
Oral CavityThe image shows the transcriptomic changes along malignancy continuum.log2FC in expression of this searched gene in stem-like cells from each diseased tissue sample relative to stem-like cells in normal samples in each tissue plotted against the malignancy continuum. Samples are colored based on if they are from different disease stage.
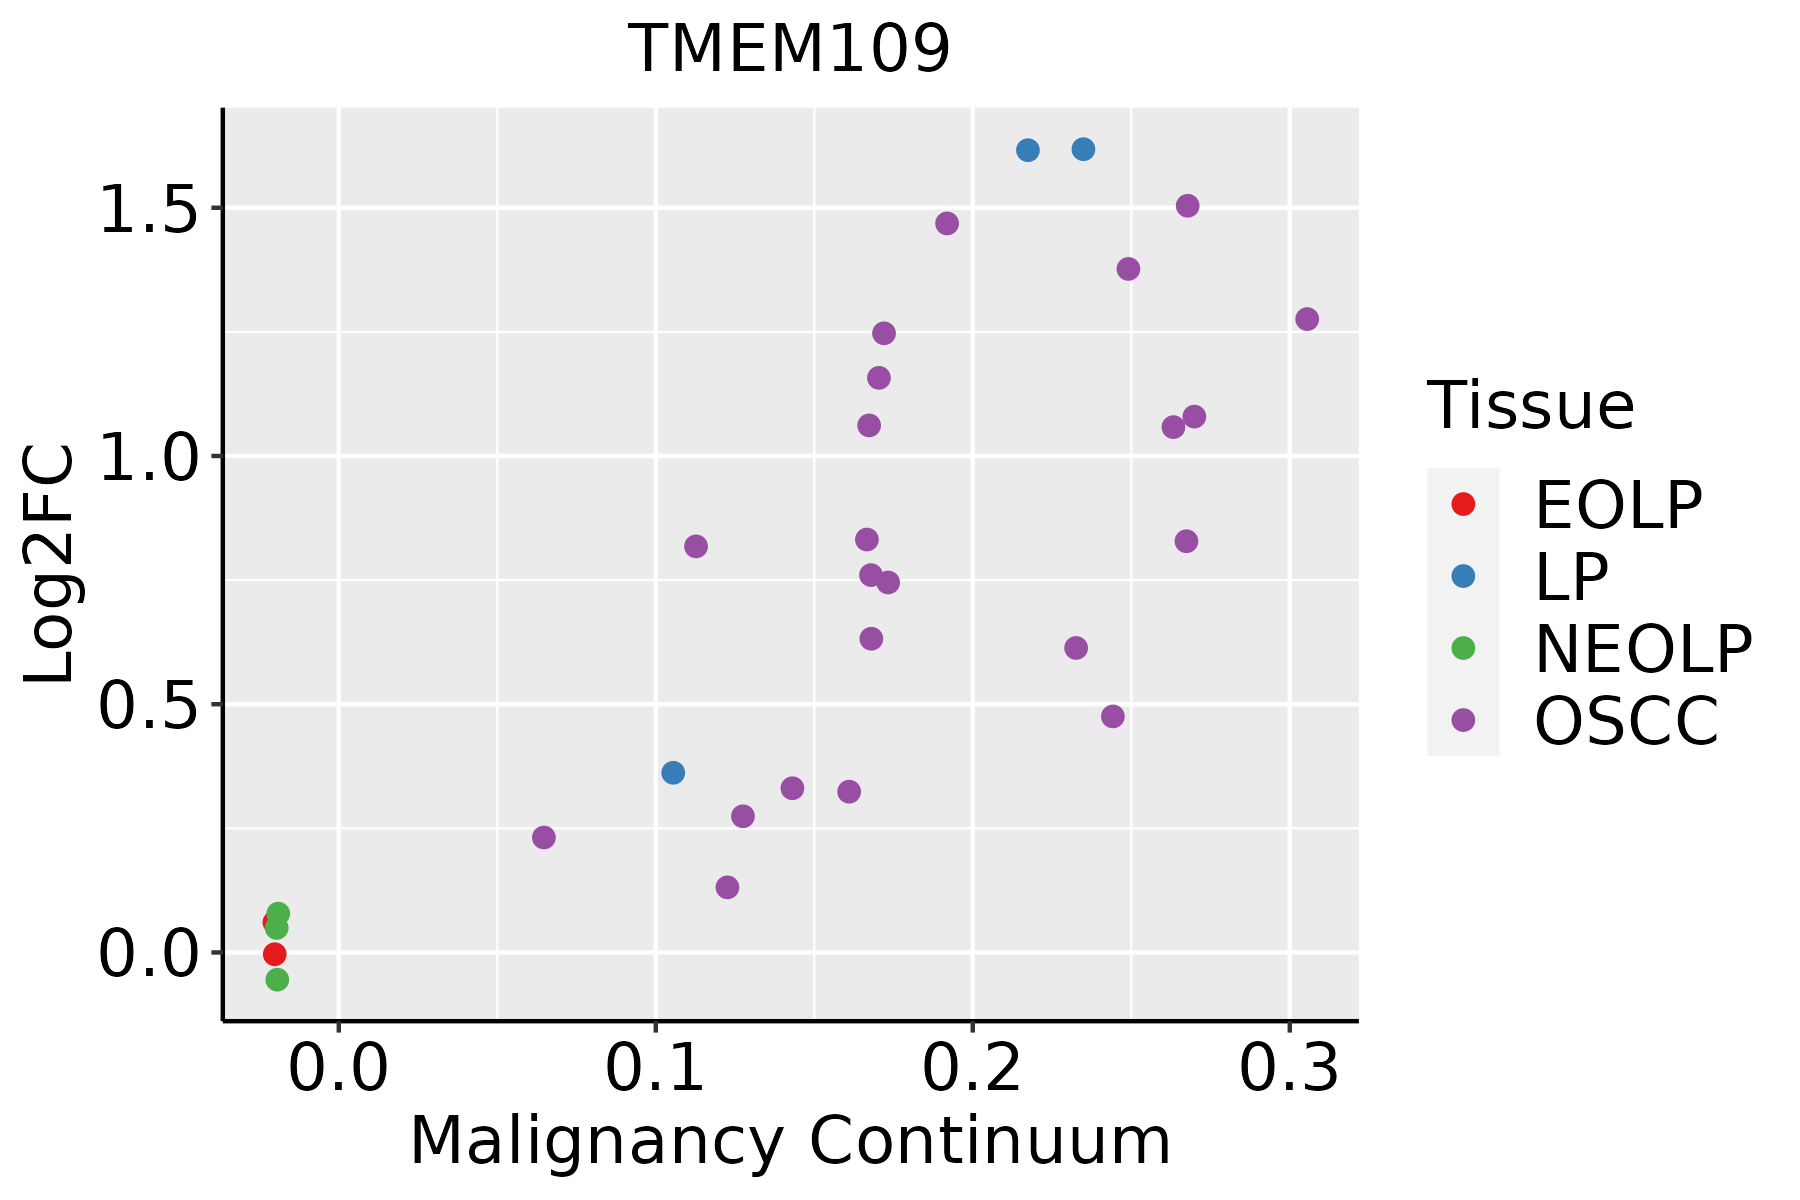
EOLP: Erosive Oral lichen planus
LP: leukoplakia
NEOLP: Non-erosive oral lichen planus
OSCC: Oral squamous cell carcinoma
SkinThe image shows the transcriptomic changes along malignancy continuum.log2FC in expression of this searched gene in stem-like cells from each diseased tissue sample relative to stem-like cells in normal samples in each tissue plotted against the malignancy continuum. Samples are colored based on if they are from different disease stage.AK: Actinic keratosis
cSCC: Cutaneous squamous cell carcinoma
SCCIS:squamous cell carcinoma in situ
ThyroidThe image shows the transcriptomic changes along malignancy continuum.log2FC in expression of this searched gene in stem-like cells from each diseased tissue sample relative to stem-like cells in normal samples in each tissue plotted against the malignancy continuum. Samples are colored based on if they are from different disease stage.
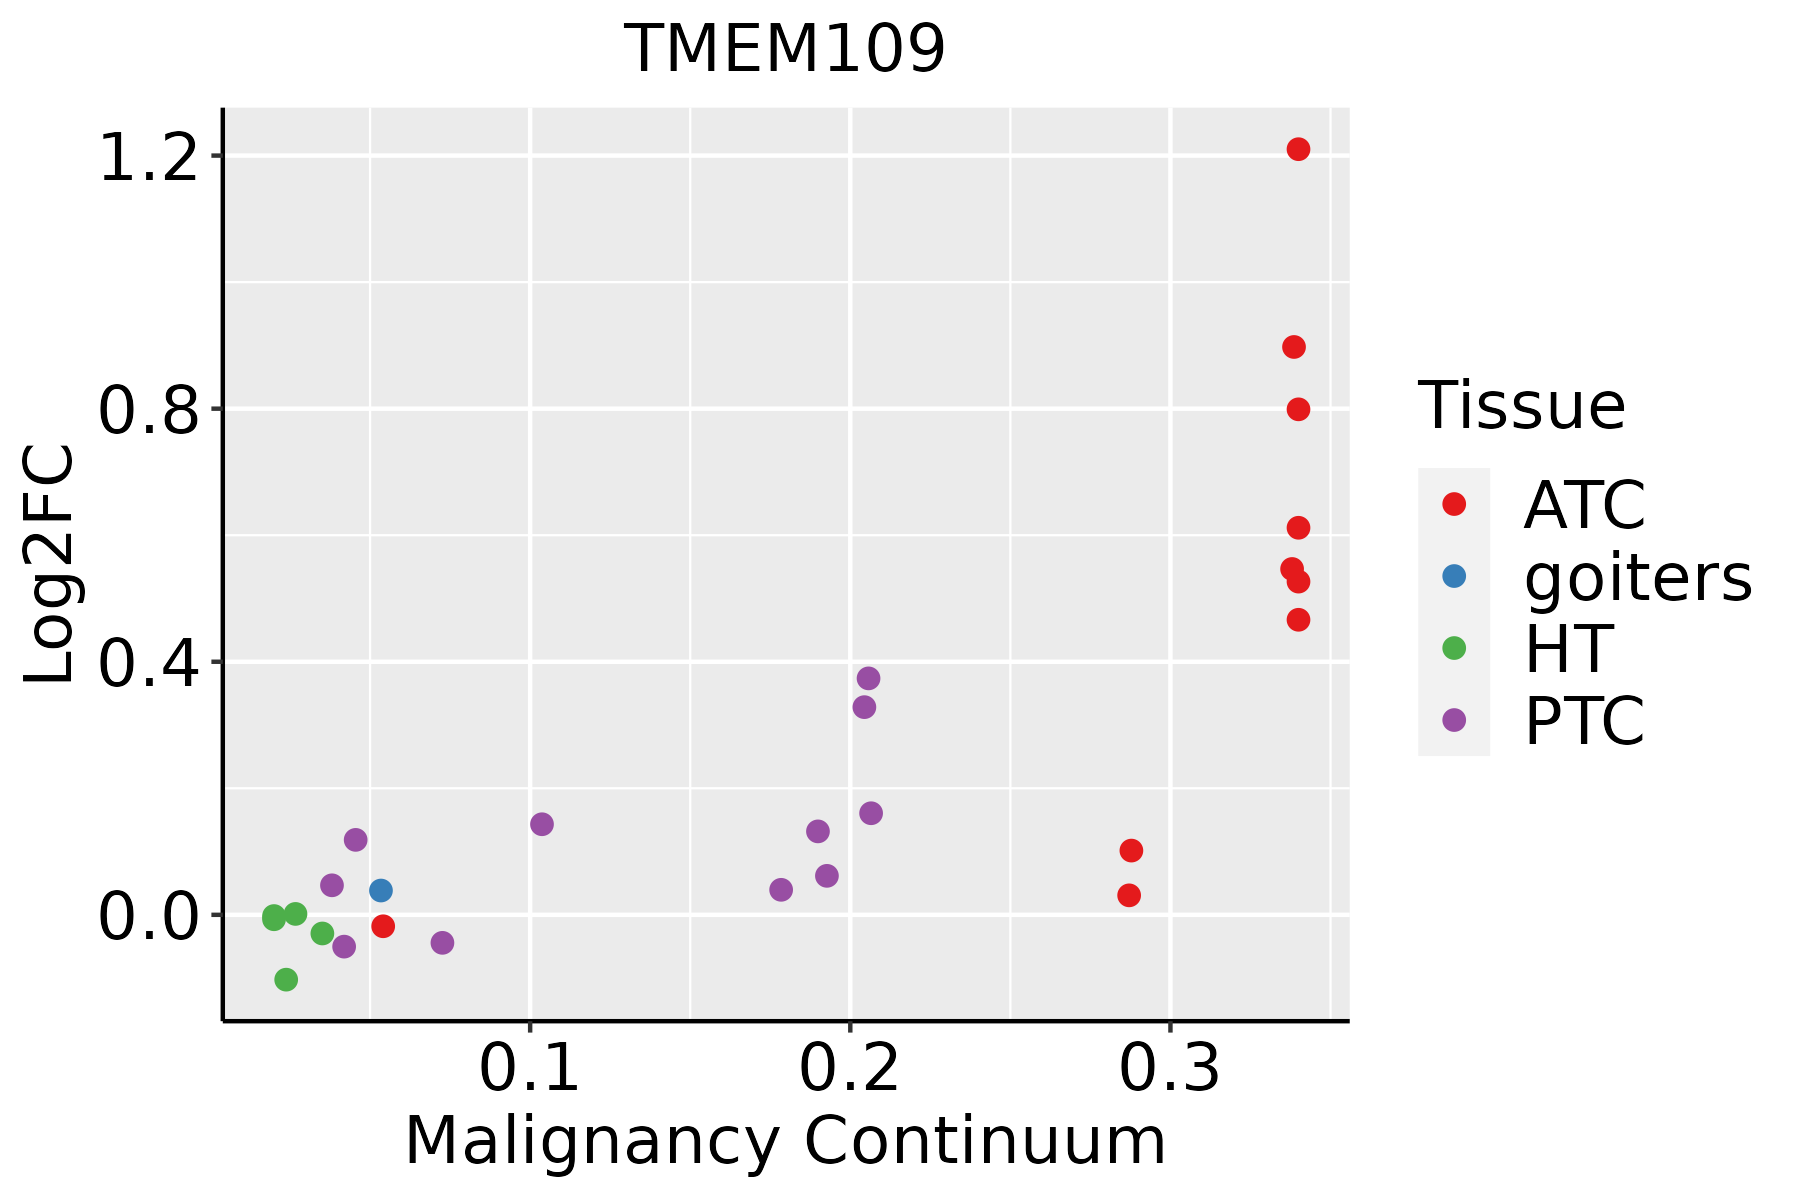
ATC: Anaplastic thyroid cancer
HT: Hashimoto's thyroiditis
PTC: Papillary thyroid cancer
∗log2FC in expression of this searched gene in stem-like cells from each diseased tissue sample relative to stem-like cells in normal samples in each tissue plotted against the malignancy continuum. Samples are colored based on if they are from different disease stage.

Top

Malignant transformation related pathway analysis

check buttonFind out the enriched GO biological processes and KEGG pathways involved in transition from healthy to precancer to cancer
check button Figure of enriched GO biological processes.
TissueDisease StageEnriched GO biological Processes
ColorectumADGO analysis - Figure of enriched GO biological processes: Top 15 enriched GO BP terms are showed in the bar plot of each disease state in each tissue. Each row represents a significant GO biological process which is colored according to the -log10(p.adjust).
ColorectumSERGO analysis - Figure of enriched GO biological processes: Top 15 enriched GO BP terms are showed in the bar plot of each disease state in each tissue. Each row represents a significant GO biological process which is colored according to the -log10(p.adjust).
ColorectumMSSGO analysis - Figure of enriched GO biological processes: Top 15 enriched GO BP terms are showed in the bar plot of each disease state in each tissue. Each row represents a significant GO biological process which is colored according to the -log10(p.adjust).
ColorectumMSI-HGO analysis - Figure of enriched GO biological processes: Top 15 enriched GO BP terms are showed in the bar plot of each disease state in each tissue. Each row represents a significant GO biological process which is colored according to the -log10(p.adjust).
ColorectumFAPGO analysis - Figure of enriched GO biological processes: Top 15 enriched GO BP terms are showed in the bar plot of each disease state in each tissue. Each row represents a significant GO biological process which is colored according to the -log10(p.adjust).
∗Top 15 enriched GO BP terms are showed in the bar plot of each disease state in each tissue. Each row represents a significant GO biological process which is colored according to the -log10(p.adjust).
Page: 1 2 3 4 5 6 7 8 9 

check button Enriched GO biological processes.
GO IDTissueDisease StageDescriptionGene RatioBg Ratiopvaluep.adjustCount
GO:007147917Oral cavityOSCCcellular response to ionizing radiation49/730572/187235.59e-078.13e-0649
GO:00103326Oral cavityOSCCresponse to gamma radiation36/730556/187231.12e-048.24e-0436
GO:00714809Oral cavityOSCCcellular response to gamma radiation21/730531/187231.13e-035.75e-0321
GO:0097193110Oral cavityLPintrinsic apoptotic signaling pathway146/4623288/187239.76e-222.78e-19146
GO:000863019Oral cavityLPintrinsic apoptotic signaling pathway in response to DNA damage51/462399/187238.01e-093.20e-0751
GO:0072331110Oral cavityLPsignal transduction by p53 class mediator72/4623163/187233.99e-081.41e-0672
GO:0072332110Oral cavityLPintrinsic apoptotic signaling pathway by p53 class mediator39/462376/187235.10e-071.40e-0539
GO:001021216Oral cavityLPresponse to ionizing radiation64/4623148/187235.60e-071.51e-0564
GO:007121417Oral cavityLPcellular response to abiotic stimulus121/4623331/187238.45e-072.20e-05121
GO:010400417Oral cavityLPcellular response to environmental stimulus121/4623331/187238.45e-072.20e-05121
GO:004277119Oral cavityLPintrinsic apoptotic signaling pathway in response to DNA damage by p53 class mediator25/462343/187233.00e-066.47e-0525
GO:000931417Oral cavityLPresponse to radiation155/4623456/187234.12e-068.49e-05155
GO:007147815Oral cavityLPcellular response to radiation73/4623186/187237.44e-061.41e-0473
GO:007147918Oral cavityLPcellular response to ionizing radiation34/462372/187232.71e-054.30e-0434
GO:001033214Oral cavityLPresponse to gamma radiation27/462356/187231.14e-041.36e-0327
GO:007148015Oral cavityLPcellular response to gamma radiation17/462331/187233.09e-043.15e-0317
GO:009719329SkincSCCintrinsic apoptotic signaling pathway150/4864288/187231.76e-213.34e-19150
GO:007233129SkincSCCsignal transduction by p53 class mediator83/4864163/187237.71e-124.00e-1083
GO:007147824SkincSCCcellular response to radiation86/4864186/187231.81e-096.67e-0886
GO:007121425SkincSCCcellular response to abiotic stimulus135/4864331/187232.26e-098.11e-08135
Page: 1 2 3 4 5 6 

check button Enriched KEGG pathways.
Pathway IDTissueDisease StageDescriptionGene RatioBg Ratiopvaluep.adjustqvalueCount
Page: 1 

Top

Cell-cell communication analysis

check buttonIdentification of potential cell-cell interactions between two cell types and their ligand-receptor pairs for different disease states
LigandReceptorLRpairPathwayTissueDisease Stage
Page: 1 

Top

Single-cell gene regulatory network inference analysis

check buttonFind out the significant the regulons (TFs) and the target genes of each regulon across cell types for different disease states
TFCell TypeTissueDisease StageTarget GeneRSSRegulon Activity
∗The dot plots of a searched regulon are shown for all cell subpopulations in each disease state of each tissue based on the regulon specific score inferred using pySCENIC and by calculating the average expression.
Page: 1 

Top

Somatic mutation of malignant transformation related genes

check buttonAnnotation of somatic variants for genes involved in malignant transformation
Hugo SymbolVariant ClassVariant ClassificationdbSNP RSHGVScHGVSpHGVSp ShortSWISSPROTBIOTYPESIFTPolyPhenTumor Sample BarcodeTissueHistologySexAgeStageTherapy TypesDrugsOutcome
TMEM109insertionNonsense_Mutationnovelc.531_532insCAGGAAGGAGAGACAGCCTGTTGGCCATCCCTGTAGACp.Ser178GlnfsTer12p.S178Qfs*12Q9BVC6protein_codingTCGA-B6-A0I8-01Breastbreast invasive carcinomaFemale<65I/IIUnknownUnknownPD
TMEM109insertionFrame_Shift_Insnovelc.98_99insGGp.Gln34AlafsTer22p.Q34Afs*22Q9BVC6protein_codingTCGA-BH-A0AY-01Breastbreast invasive carcinomaFemale<65I/IIChemotherapySD
TMEM109insertionFrame_Shift_Insnovelc.99_100insAGACAGCCACTGGAGAGTTGGGGCTGGCACAGAAp.Gln34ArgfsTer30p.Q34Rfs*30Q9BVC6protein_codingTCGA-BH-A0AY-01Breastbreast invasive carcinomaFemale<65I/IIChemotherapySD
TMEM109insertionNonsense_Mutationnovelc.136_137insGGGTCATCCTATGGCAGAAGGCAGAACCCAGCACATGp.Lys46ArgfsTer13p.K46Rfs*13Q9BVC6protein_codingTCGA-BH-A0DS-01Breastbreast invasive carcinomaFemale>=65III/IVChemotherapycyclophosphamideSD
TMEM109deletionFrame_Shift_Delnovelc.29delNp.Gly11GlufsTer9p.G11Efs*9Q9BVC6protein_codingTCGA-2W-A8YY-01Cervixcervical & endocervical cancerFemale<65I/IIChemotherapycisplatinCR
TMEM109SNVMissense_Mutationc.690N>Tp.Gln230Hisp.Q230HQ9BVC6protein_codingdeleterious(0)possibly_damaging(0.81)TCGA-A6-5665-01Colorectumcolon adenocarcinomaFemale>=65I/IIUnknownUnknownPD
TMEM109SNVMissense_Mutationnovelc.553C>Tp.Arg185Trpp.R185WQ9BVC6protein_codingdeleterious(0)benign(0.023)TCGA-AA-3947-01Colorectumcolon adenocarcinomaFemale<65I/IIUnknownUnknownSD
TMEM109SNVMissense_Mutationc.298T>Cp.Ser100Prop.S100PQ9BVC6protein_codingtolerated(0.23)probably_damaging(0.992)TCGA-AY-6196-01Colorectumcolon adenocarcinomaMale<65III/IVUnknownUnknownSD
TMEM109SNVMissense_Mutationnovelc.50C>Tp.Ala17Valp.A17VQ9BVC6protein_codingtolerated_low_confidence(0.7)benign(0.001)TCGA-AZ-4315-01Colorectumcolon adenocarcinomaMale<65I/IIUnknownUnknownSD
TMEM109SNVMissense_Mutationrs753654818c.310N>Ap.Ala104Thrp.A104TQ9BVC6protein_codingdeleterious(0.04)benign(0.029)TCGA-F4-6856-01Colorectumcolon adenocarcinomaMale<65I/IIAncillaryleucovorinCR
Page: 1 2 3 4 

Top

Related drugs of malignant transformation related genes

check buttonIdentification of chemicals and drugs interact with genes involved in malignant transfromation
(DGIdb 4.0)
Entrez IDSymbolCategoryInteraction TypesDrug Claim NameDrug NamePMIDs
Page: 1