
|
|||||
|
 | |
| |
| |
| |
| |
| |
|
Gene: TJP3 |
Gene summary for TJP3 |
| Gene information | Species | Human | Gene symbol | TJP3 | Gene ID | 27134 |
| Gene name | tight junction protein 3 | |
| Gene Alias | ZO-3 | |
| Cytomap | 19p13.3 | |
| Gene Type | protein-coding | GO ID | GO:0001885 | UniProtAcc | O95049 |
Top |
Malignant transformation analysis |
| Identification of the aberrant gene expression in precancerous and cancerous lesions by comparing the gene expression of stem-like cells in diseased tissues with normal stem cells |
| Entrez ID | Symbol | Replicates | Species | Organ | Tissue | Adj P-value | Log2FC | Malignancy |
| 27134 | TJP3 | HTA11_2487_2000001011 | Human | Colorectum | SER | 3.31e-22 | 1.13e+00 | -0.1808 |
| 27134 | TJP3 | HTA11_1938_2000001011 | Human | Colorectum | AD | 1.86e-10 | 6.47e-01 | -0.0811 |
| 27134 | TJP3 | HTA11_78_2000001011 | Human | Colorectum | AD | 8.47e-07 | 4.87e-01 | -0.1088 |
| 27134 | TJP3 | HTA11_347_2000001011 | Human | Colorectum | AD | 6.53e-33 | 9.86e-01 | -0.1954 |
| 27134 | TJP3 | HTA11_411_2000001011 | Human | Colorectum | SER | 1.14e-09 | 1.94e+00 | -0.2602 |
| 27134 | TJP3 | HTA11_2112_2000001011 | Human | Colorectum | SER | 3.11e-15 | 1.43e+00 | -0.2196 |
| 27134 | TJP3 | HTA11_3361_2000001011 | Human | Colorectum | AD | 1.28e-18 | 9.65e-01 | -0.1207 |
| 27134 | TJP3 | HTA11_83_2000001011 | Human | Colorectum | SER | 4.54e-18 | 1.13e+00 | -0.1526 |
| 27134 | TJP3 | HTA11_696_2000001011 | Human | Colorectum | AD | 9.90e-35 | 1.23e+00 | -0.1464 |
| 27134 | TJP3 | HTA11_866_2000001011 | Human | Colorectum | AD | 3.19e-20 | 8.86e-01 | -0.1001 |
| 27134 | TJP3 | HTA11_1391_2000001011 | Human | Colorectum | AD | 4.07e-19 | 9.29e-01 | -0.059 |
| 27134 | TJP3 | HTA11_2992_2000001011 | Human | Colorectum | SER | 1.78e-10 | 1.09e+00 | -0.1706 |
| 27134 | TJP3 | HTA11_5212_2000001011 | Human | Colorectum | AD | 7.31e-09 | 8.81e-01 | -0.2061 |
| 27134 | TJP3 | HTA11_546_2000001011 | Human | Colorectum | AD | 4.08e-13 | 8.55e-01 | -0.0842 |
| 27134 | TJP3 | HTA11_866_3004761011 | Human | Colorectum | AD | 3.86e-03 | 3.18e-01 | 0.096 |
| 27134 | TJP3 | HTA11_7696_3000711011 | Human | Colorectum | AD | 4.65e-14 | 6.99e-01 | 0.0674 |
| 27134 | TJP3 | HTA11_6818_2000001011 | Human | Colorectum | AD | 3.42e-06 | 7.00e-01 | 0.0112 |
| 27134 | TJP3 | HTA11_99999971662_82457 | Human | Colorectum | MSS | 4.38e-02 | 3.96e-01 | 0.3859 |
| 27134 | TJP3 | A001-C-207 | Human | Colorectum | FAP | 4.17e-02 | -2.92e-01 | 0.1278 |
| 27134 | TJP3 | A015-C-203 | Human | Colorectum | FAP | 5.09e-15 | -2.64e-01 | -0.1294 |
| Page: 1 2 3 4 |
| Tissue | Expression Dynamics | Abbreviation |
| Colorectum (GSE201348) |  | FAP: Familial adenomatous polyposis |
| CRC: Colorectal cancer | ||
| Colorectum (HTA11) |  | AD: Adenomas |
| SER: Sessile serrated lesions | ||
| MSI-H: Microsatellite-high colorectal cancer | ||
| MSS: Microsatellite stable colorectal cancer | ||
| Esophagus | 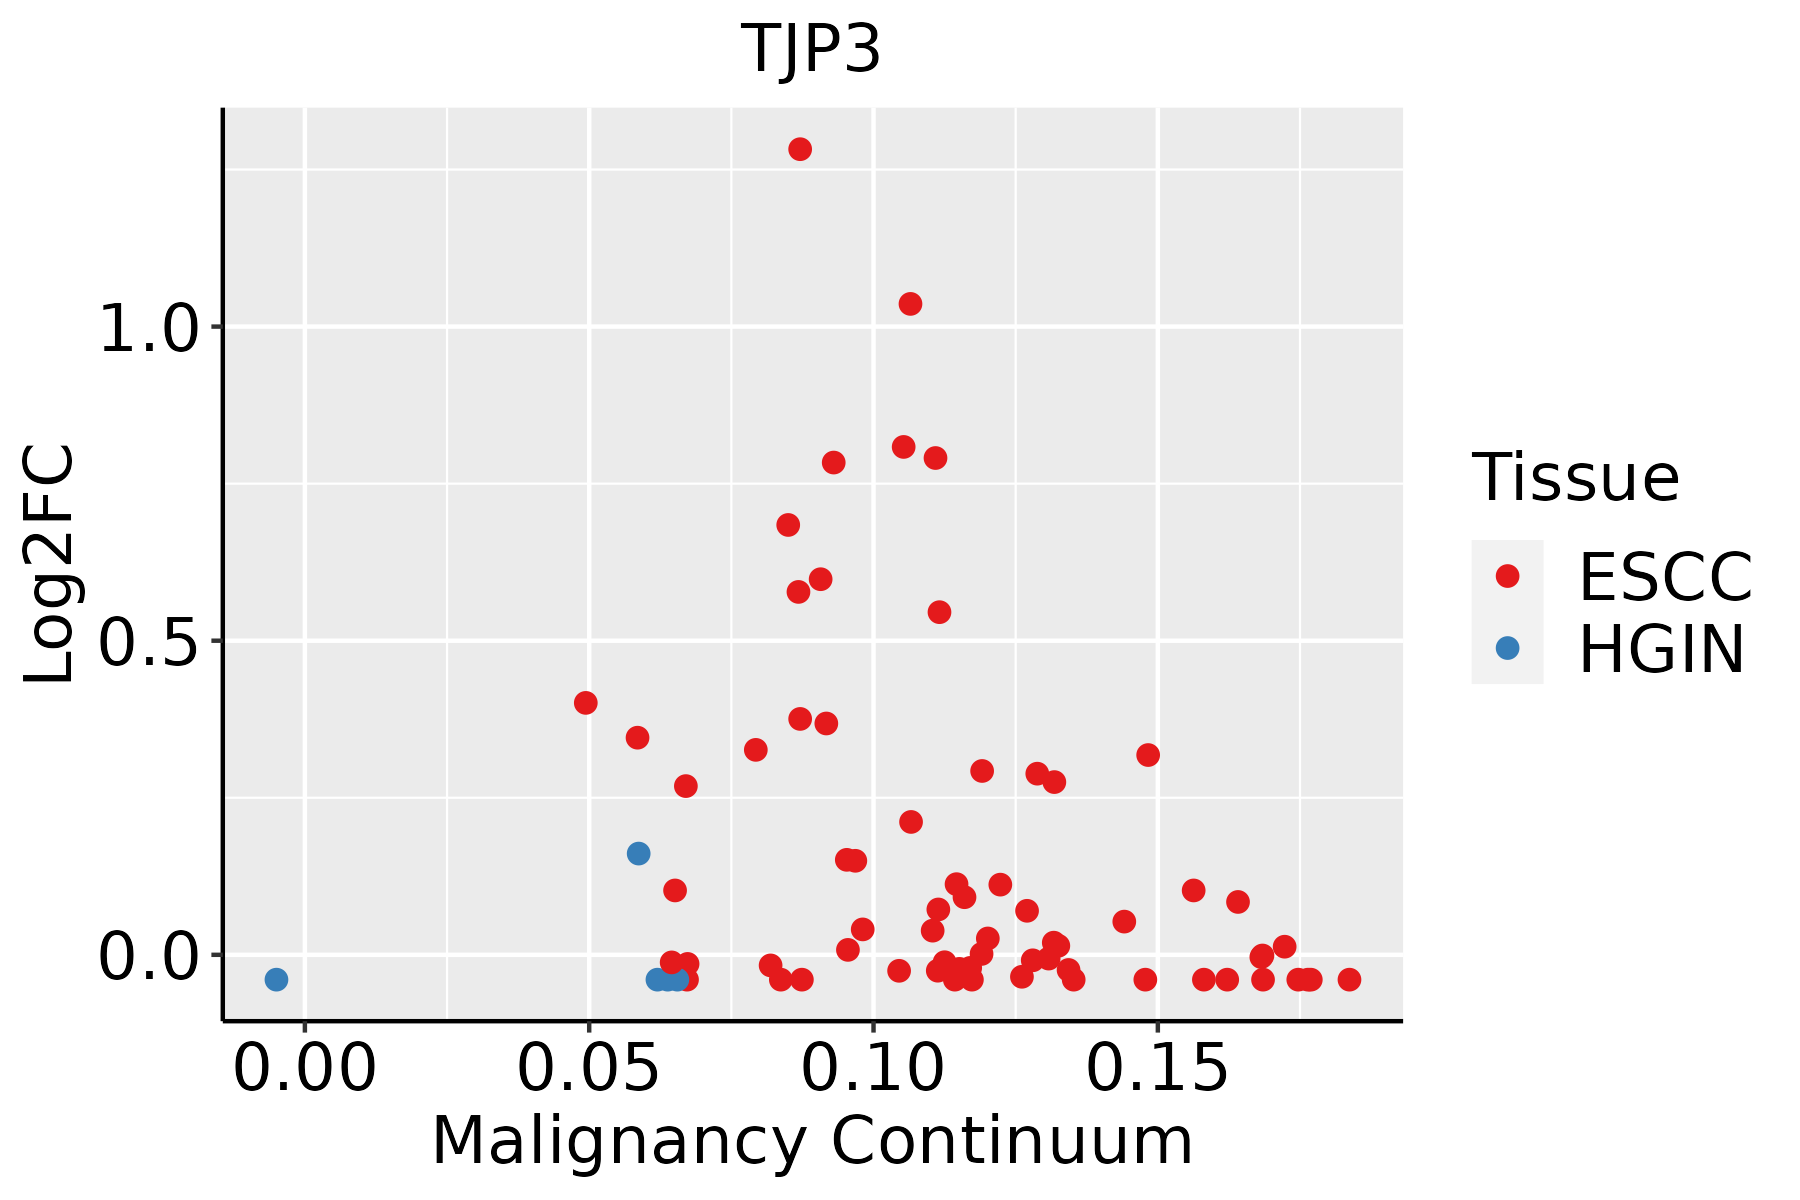 | ESCC: Esophageal squamous cell carcinoma |
| HGIN: High-grade intraepithelial neoplasias | ||
| LGIN: Low-grade intraepithelial neoplasias | ||
| GC | 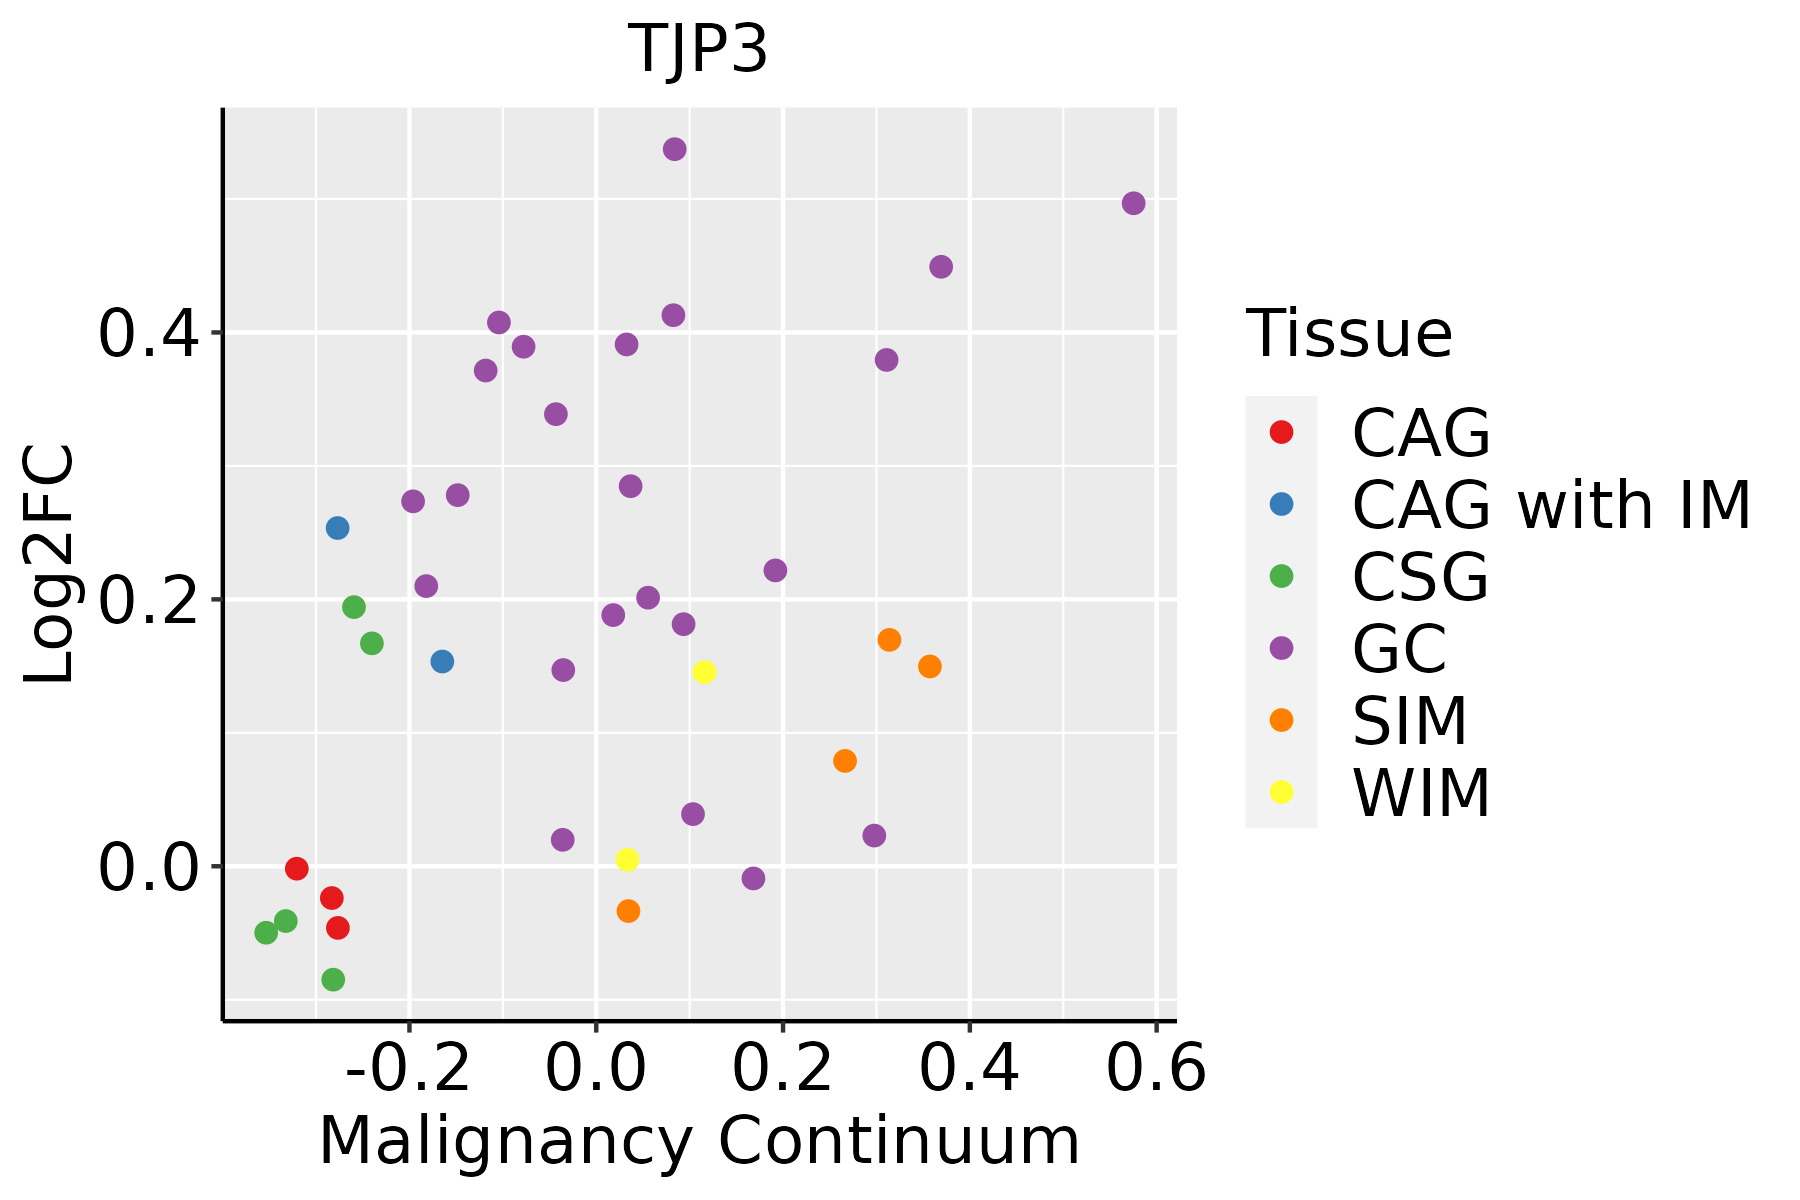 | CAG: Chronic atrophic gastritis |
| CAG with IM: Chronic atrophic gastritis with intestinal metaplasia | ||
| CSG: Chronic superficial gastritis | ||
| GC: Gastric cancer | ||
| SIM: Severe intestinal metaplasia | ||
| WIM: Wild intestinal metaplasia |
| ∗log2FC in expression of this searched gene in stem-like cells from each diseased tissue sample relative to stem-like cells in normal samples in each tissue plotted against the malignancy continuum. Samples are colored based on if they are from different disease stage. |
Top |
Malignant transformation related pathway analysis |
| Find out the enriched GO biological processes and KEGG pathways involved in transition from healthy to precancer to cancer |
| Tissue | Disease Stage | Enriched GO biological Processes |
| Colorectum | AD |  |
| Colorectum | SER |  |
| Colorectum | MSS |  |
| Colorectum | MSI-H |  |
| Colorectum | FAP |  |
| ∗Top 15 enriched GO BP terms are showed in the bar plot of each disease state in each tissue. Each row represents a significant GO biological process which is colored according to the -log10(p.adjust). |
| Page: 1 2 3 4 5 6 7 8 9 |
| GO ID | Tissue | Disease Stage | Description | Gene Ratio | Bg Ratio | pvalue | p.adjust | Count |
| GO:00020646 | Stomach | GC | epithelial cell development | 30/1159 | 220/18723 | 3.92e-05 | 9.90e-04 | 30 |
| GO:00610285 | Stomach | GC | establishment of endothelial barrier | 10/1159 | 46/18723 | 4.18e-04 | 6.32e-03 | 10 |
| GO:00031585 | Stomach | GC | endothelium development | 19/1159 | 136/18723 | 7.19e-04 | 9.47e-03 | 19 |
| GO:00018854 | Stomach | GC | endothelial cell development | 11/1159 | 64/18723 | 1.75e-03 | 1.83e-02 | 11 |
| GO:00454464 | Stomach | GC | endothelial cell differentiation | 16/1159 | 118/18723 | 2.50e-03 | 2.36e-02 | 16 |
| GO:00905573 | Stomach | GC | establishment of endothelial intestinal barrier | 4/1159 | 12/18723 | 4.84e-03 | 3.87e-02 | 4 |
| GO:00356332 | Stomach | GC | maintenance of blood-brain barrier | 7/1159 | 35/18723 | 4.99e-03 | 3.96e-02 | 7 |
| GO:000189411 | Stomach | CAG with IM | tissue homeostasis | 42/1050 | 268/18723 | 1.40e-09 | 1.74e-07 | 42 |
| GO:006024911 | Stomach | CAG with IM | anatomical structure homeostasis | 46/1050 | 314/18723 | 2.18e-09 | 2.64e-07 | 46 |
| GO:004521611 | Stomach | CAG with IM | cell-cell junction organization | 30/1050 | 200/18723 | 8.07e-07 | 4.05e-05 | 30 |
| GO:000206411 | Stomach | CAG with IM | epithelial cell development | 29/1050 | 220/18723 | 1.64e-05 | 5.16e-04 | 29 |
| GO:006102811 | Stomach | CAG with IM | establishment of endothelial barrier | 9/1050 | 46/18723 | 8.92e-04 | 1.17e-02 | 9 |
| GO:000315811 | Stomach | CAG with IM | endothelium development | 17/1050 | 136/18723 | 1.59e-03 | 1.76e-02 | 17 |
| GO:000188511 | Stomach | CAG with IM | endothelial cell development | 10/1050 | 64/18723 | 2.82e-03 | 2.69e-02 | 10 |
| GO:009055711 | Stomach | CAG with IM | establishment of endothelial intestinal barrier | 4/1050 | 12/18723 | 3.39e-03 | 3.06e-02 | 4 |
| GO:004544611 | Stomach | CAG with IM | endothelial cell differentiation | 14/1050 | 118/18723 | 6.32e-03 | 4.79e-02 | 14 |
| GO:000189421 | Stomach | CSG | tissue homeostasis | 40/1034 | 268/18723 | 9.33e-09 | 8.66e-07 | 40 |
| GO:006024921 | Stomach | CSG | anatomical structure homeostasis | 44/1034 | 314/18723 | 1.22e-08 | 1.06e-06 | 44 |
| GO:004521621 | Stomach | CSG | cell-cell junction organization | 29/1034 | 200/18723 | 1.82e-06 | 8.48e-05 | 29 |
| GO:000206421 | Stomach | CSG | epithelial cell development | 28/1034 | 220/18723 | 3.30e-05 | 9.05e-04 | 28 |
| Page: 1 2 3 4 5 |
| Pathway ID | Tissue | Disease Stage | Description | Gene Ratio | Bg Ratio | pvalue | p.adjust | qvalue | Count |
| hsa04530 | Colorectum | AD | Tight junction | 76/2092 | 169/8465 | 5.49e-09 | 9.69e-08 | 6.18e-08 | 76 |
| hsa045301 | Colorectum | AD | Tight junction | 76/2092 | 169/8465 | 5.49e-09 | 9.69e-08 | 6.18e-08 | 76 |
| hsa045302 | Colorectum | SER | Tight junction | 59/1580 | 169/8465 | 3.24e-07 | 5.98e-06 | 4.34e-06 | 59 |
| hsa045303 | Colorectum | SER | Tight junction | 59/1580 | 169/8465 | 3.24e-07 | 5.98e-06 | 4.34e-06 | 59 |
| hsa045304 | Colorectum | MSS | Tight junction | 66/1875 | 169/8465 | 4.10e-07 | 6.25e-06 | 3.83e-06 | 66 |
| hsa045305 | Colorectum | MSS | Tight junction | 66/1875 | 169/8465 | 4.10e-07 | 6.25e-06 | 3.83e-06 | 66 |
| hsa045308 | Colorectum | FAP | Tight junction | 60/1404 | 169/8465 | 1.40e-09 | 9.33e-08 | 5.67e-08 | 60 |
| hsa045309 | Colorectum | FAP | Tight junction | 60/1404 | 169/8465 | 1.40e-09 | 9.33e-08 | 5.67e-08 | 60 |
| hsa0453010 | Colorectum | CRC | Tight junction | 44/1091 | 169/8465 | 2.51e-06 | 7.61e-05 | 5.16e-05 | 44 |
| hsa0453011 | Colorectum | CRC | Tight junction | 44/1091 | 169/8465 | 2.51e-06 | 7.61e-05 | 5.16e-05 | 44 |
| hsa04530211 | Esophagus | ESCC | Tight junction | 105/4205 | 169/8465 | 6.73e-04 | 2.23e-03 | 1.14e-03 | 105 |
| hsa04530310 | Esophagus | ESCC | Tight junction | 105/4205 | 169/8465 | 6.73e-04 | 2.23e-03 | 1.14e-03 | 105 |
| hsa0453012 | Stomach | GC | Tight junction | 33/708 | 169/8465 | 3.03e-06 | 4.65e-05 | 3.28e-05 | 33 |
| hsa0453013 | Stomach | GC | Tight junction | 33/708 | 169/8465 | 3.03e-06 | 4.65e-05 | 3.28e-05 | 33 |
| hsa0453021 | Stomach | CAG with IM | Tight junction | 32/640 | 169/8465 | 9.69e-07 | 1.62e-05 | 1.14e-05 | 32 |
| hsa0453031 | Stomach | CAG with IM | Tight junction | 32/640 | 169/8465 | 9.69e-07 | 1.62e-05 | 1.14e-05 | 32 |
| hsa0453041 | Stomach | CSG | Tight junction | 31/633 | 169/8465 | 2.29e-06 | 3.45e-05 | 2.48e-05 | 31 |
| hsa0453051 | Stomach | CSG | Tight junction | 31/633 | 169/8465 | 2.29e-06 | 3.45e-05 | 2.48e-05 | 31 |
| Page: 1 |
Top |
Cell-cell communication analysis |
| Identification of potential cell-cell interactions between two cell types and their ligand-receptor pairs for different disease states |
| Ligand | Receptor | LRpair | Pathway | Tissue | Disease Stage |
| Page: 1 |
Top |
Single-cell gene regulatory network inference analysis |
| Find out the significant the regulons (TFs) and the target genes of each regulon across cell types for different disease states |
| TF | Cell Type | Tissue | Disease Stage | Target Gene | RSS | Regulon Activity |
| ∗The dot plots of a searched regulon are shown for all cell subpopulations in each disease state of each tissue based on the regulon specific score inferred using pySCENIC and by calculating the average expression. |
| Page: 1 |
Top |
Somatic mutation of malignant transformation related genes |
| Annotation of somatic variants for genes involved in malignant transformation |
| Hugo Symbol | Variant Class | Variant Classification | dbSNP RS | HGVSc | HGVSp | HGVSp Short | SWISSPROT | BIOTYPE | SIFT | PolyPhen | Tumor Sample Barcode | Tissue | Histology | Sex | Age | Stage | Therapy Types | Drugs | Outcome |
| TJP3 | SNV | Missense_Mutation | rs145208682 | c.923N>T | p.Ser308Leu | p.S308L | O95049 | protein_coding | deleterious(0) | probably_damaging(0.992) | TCGA-A8-A095-01 | Breast | breast invasive carcinoma | Female | <65 | I/II | Chemotherapy | 5-fluorouracil | CR |
| TJP3 | SNV | Missense_Mutation | c.1919C>G | p.Ala640Gly | p.A640G | O95049 | protein_coding | deleterious(0) | probably_damaging(0.952) | TCGA-AC-A2B8-01 | Breast | breast invasive carcinoma | Female | >=65 | I/II | Chemotherapy | chemo | PD | |
| TJP3 | SNV | Missense_Mutation | c.2741N>T | p.Ser914Phe | p.S914F | O95049 | protein_coding | deleterious(0) | probably_damaging(1) | TCGA-BH-A18P-01 | Breast | breast invasive carcinoma | Female | <65 | I/II | Unknown | Unknown | PD | |
| TJP3 | SNV | Missense_Mutation | novel | c.1621N>T | p.Arg541Trp | p.R541W | O95049 | protein_coding | deleterious(0) | possibly_damaging(0.858) | TCGA-BH-A1F0-01 | Breast | breast invasive carcinoma | Female | >=65 | I/II | Unknown | Unknown | PD |
| TJP3 | SNV | Missense_Mutation | c.1939N>C | p.Glu647Gln | p.E647Q | O95049 | protein_coding | deleterious(0.01) | probably_damaging(0.94) | TCGA-D8-A27G-01 | Breast | breast invasive carcinoma | Female | >=65 | I/II | Unknown | Unknown | SD | |
| TJP3 | SNV | Missense_Mutation | rs770353202 | c.1075G>A | p.Glu359Lys | p.E359K | O95049 | protein_coding | tolerated(0.86) | benign(0.005) | TCGA-GI-A2C9-01 | Breast | breast invasive carcinoma | Female | <65 | I/II | Unspecific | SD | |
| TJP3 | insertion | In_Frame_Ins | novel | c.2306_2307insCGTGCGGTGGCTCACGCC | p.Ile769_Arg770insValArgTrpLeuThrPro | p.I769_R770insVRWLTP | O95049 | protein_coding | TCGA-BH-A0B1-01 | Breast | breast invasive carcinoma | Female | >=65 | I/II | Chemotherapy | adriamycin | SD | ||
| TJP3 | SNV | Missense_Mutation | novel | c.518N>A | p.Ser173Asn | p.S173N | O95049 | protein_coding | deleterious(0.03) | possibly_damaging(0.844) | TCGA-2W-A8YY-01 | Cervix | cervical & endocervical cancer | Female | <65 | I/II | Chemotherapy | cisplatin | CR |
| TJP3 | SNV | Missense_Mutation | c.2324N>T | p.Arg775Leu | p.R775L | O95049 | protein_coding | deleterious(0.01) | possibly_damaging(0.511) | TCGA-2W-A8YY-01 | Cervix | cervical & endocervical cancer | Female | <65 | I/II | Chemotherapy | cisplatin | CR | |
| TJP3 | SNV | Missense_Mutation | c.2465N>A | p.Gly822Asp | p.G822D | O95049 | protein_coding | deleterious(0.01) | probably_damaging(0.965) | TCGA-FU-A3HZ-01 | Cervix | cervical & endocervical cancer | Female | <65 | I/II | Chemotherapy | cisplatin | CR |
| Page: 1 2 3 4 5 6 7 8 9 10 |
Top |
Related drugs of malignant transformation related genes |
| Identification of chemicals and drugs interact with genes involved in malignant transfromation |
| (DGIdb 4.0) |
| Entrez ID | Symbol | Category | Interaction Types | Drug Claim Name | Drug Name | PMIDs |
| Page: 1 |

Copyright 2023-Present -The University of Texas Health Science Center at Houston |