
|
|||||
|
 | |
| |
| |
| |
| |
| |
|
Gene: TIMM10B |
Gene summary for TIMM10B |
| Gene information | Species | Human | Gene symbol | TIMM10B | Gene ID | 26515 |
| Gene name | translocase of inner mitochondrial membrane 10B | |
| Gene Alias | FXC1 | |
| Cytomap | 11p15.4 | |
| Gene Type | protein-coding | GO ID | GO:0006605 | UniProtAcc | B2R4A9 |
Top |
Malignant transformation analysis |
| Identification of the aberrant gene expression in precancerous and cancerous lesions by comparing the gene expression of stem-like cells in diseased tissues with normal stem cells |
| Entrez ID | Symbol | Replicates | Species | Organ | Tissue | Adj P-value | Log2FC | Malignancy |
| 26515 | TIMM10B | LZE4T | Human | Esophagus | ESCC | 4.59e-02 | 7.79e-02 | 0.0811 |
| 26515 | TIMM10B | LZE24T | Human | Esophagus | ESCC | 1.01e-09 | 4.36e-01 | 0.0596 |
| 26515 | TIMM10B | LZE6T | Human | Esophagus | ESCC | 2.08e-04 | 1.41e-01 | 0.0845 |
| 26515 | TIMM10B | P2T-E | Human | Esophagus | ESCC | 1.29e-17 | 1.15e-01 | 0.1177 |
| 26515 | TIMM10B | P4T-E | Human | Esophagus | ESCC | 3.29e-09 | 2.27e-01 | 0.1323 |
| 26515 | TIMM10B | P5T-E | Human | Esophagus | ESCC | 3.01e-03 | -9.64e-02 | 0.1327 |
| 26515 | TIMM10B | P8T-E | Human | Esophagus | ESCC | 1.04e-13 | 8.29e-03 | 0.0889 |
| 26515 | TIMM10B | P9T-E | Human | Esophagus | ESCC | 1.47e-07 | 1.96e-01 | 0.1131 |
| 26515 | TIMM10B | P10T-E | Human | Esophagus | ESCC | 6.17e-22 | 2.99e-01 | 0.116 |
| 26515 | TIMM10B | P11T-E | Human | Esophagus | ESCC | 6.41e-07 | 2.77e-01 | 0.1426 |
| 26515 | TIMM10B | P12T-E | Human | Esophagus | ESCC | 7.83e-15 | 1.15e-01 | 0.1122 |
| 26515 | TIMM10B | P15T-E | Human | Esophagus | ESCC | 3.26e-14 | 2.11e-01 | 0.1149 |
| 26515 | TIMM10B | P16T-E | Human | Esophagus | ESCC | 3.58e-16 | 1.51e-01 | 0.1153 |
| 26515 | TIMM10B | P17T-E | Human | Esophagus | ESCC | 5.65e-07 | 1.90e-01 | 0.1278 |
| 26515 | TIMM10B | P19T-E | Human | Esophagus | ESCC | 9.81e-03 | 4.21e-01 | 0.1662 |
| 26515 | TIMM10B | P20T-E | Human | Esophagus | ESCC | 3.91e-16 | 1.94e-01 | 0.1124 |
| 26515 | TIMM10B | P21T-E | Human | Esophagus | ESCC | 2.06e-23 | 1.34e-01 | 0.1617 |
| 26515 | TIMM10B | P22T-E | Human | Esophagus | ESCC | 1.26e-21 | 3.20e-01 | 0.1236 |
| 26515 | TIMM10B | P23T-E | Human | Esophagus | ESCC | 9.22e-16 | 2.88e-01 | 0.108 |
| 26515 | TIMM10B | P24T-E | Human | Esophagus | ESCC | 5.61e-18 | 1.27e-01 | 0.1287 |
| Page: 1 2 3 4 5 |
| Tissue | Expression Dynamics | Abbreviation |
| Esophagus | 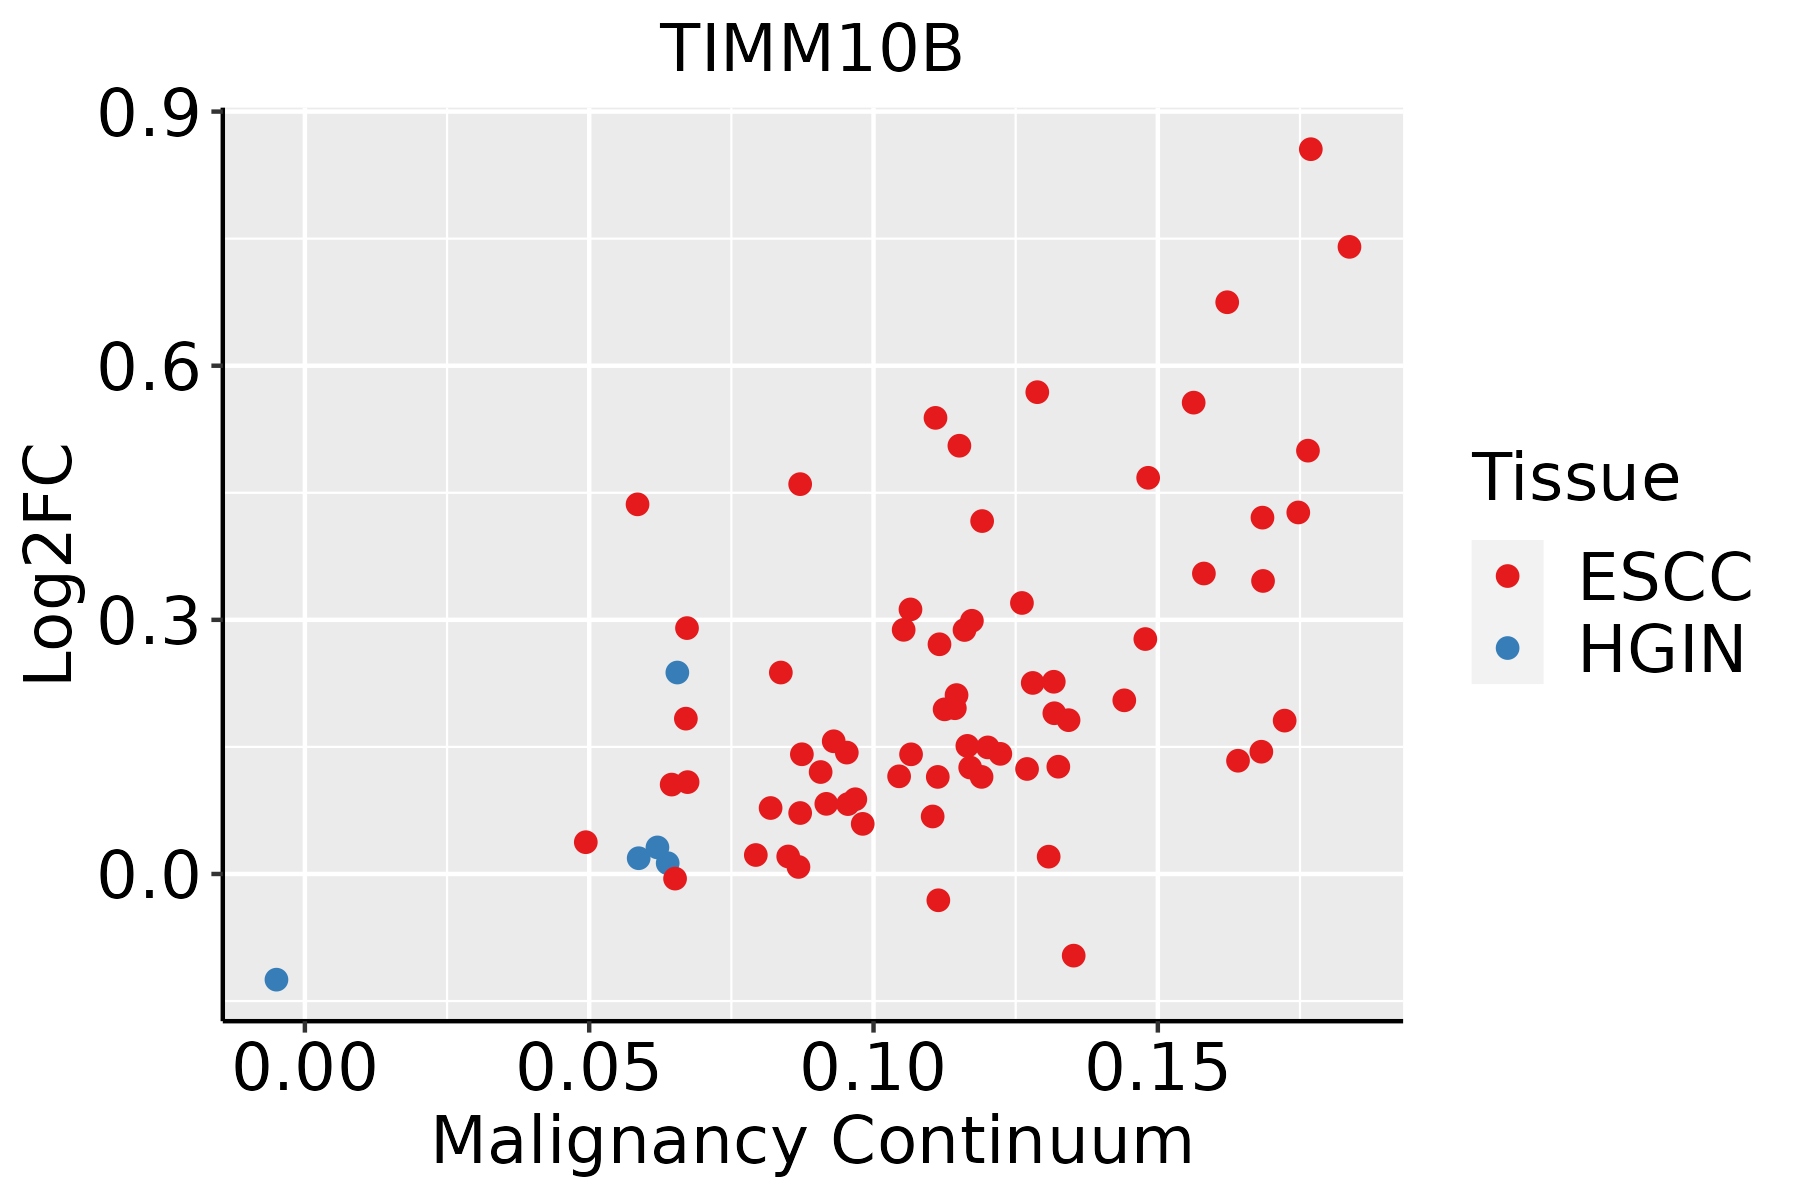 | ESCC: Esophageal squamous cell carcinoma |
| HGIN: High-grade intraepithelial neoplasias | ||
| LGIN: Low-grade intraepithelial neoplasias | ||
| Liver |  | HCC: Hepatocellular carcinoma |
| NAFLD: Non-alcoholic fatty liver disease | ||
| Oral Cavity | 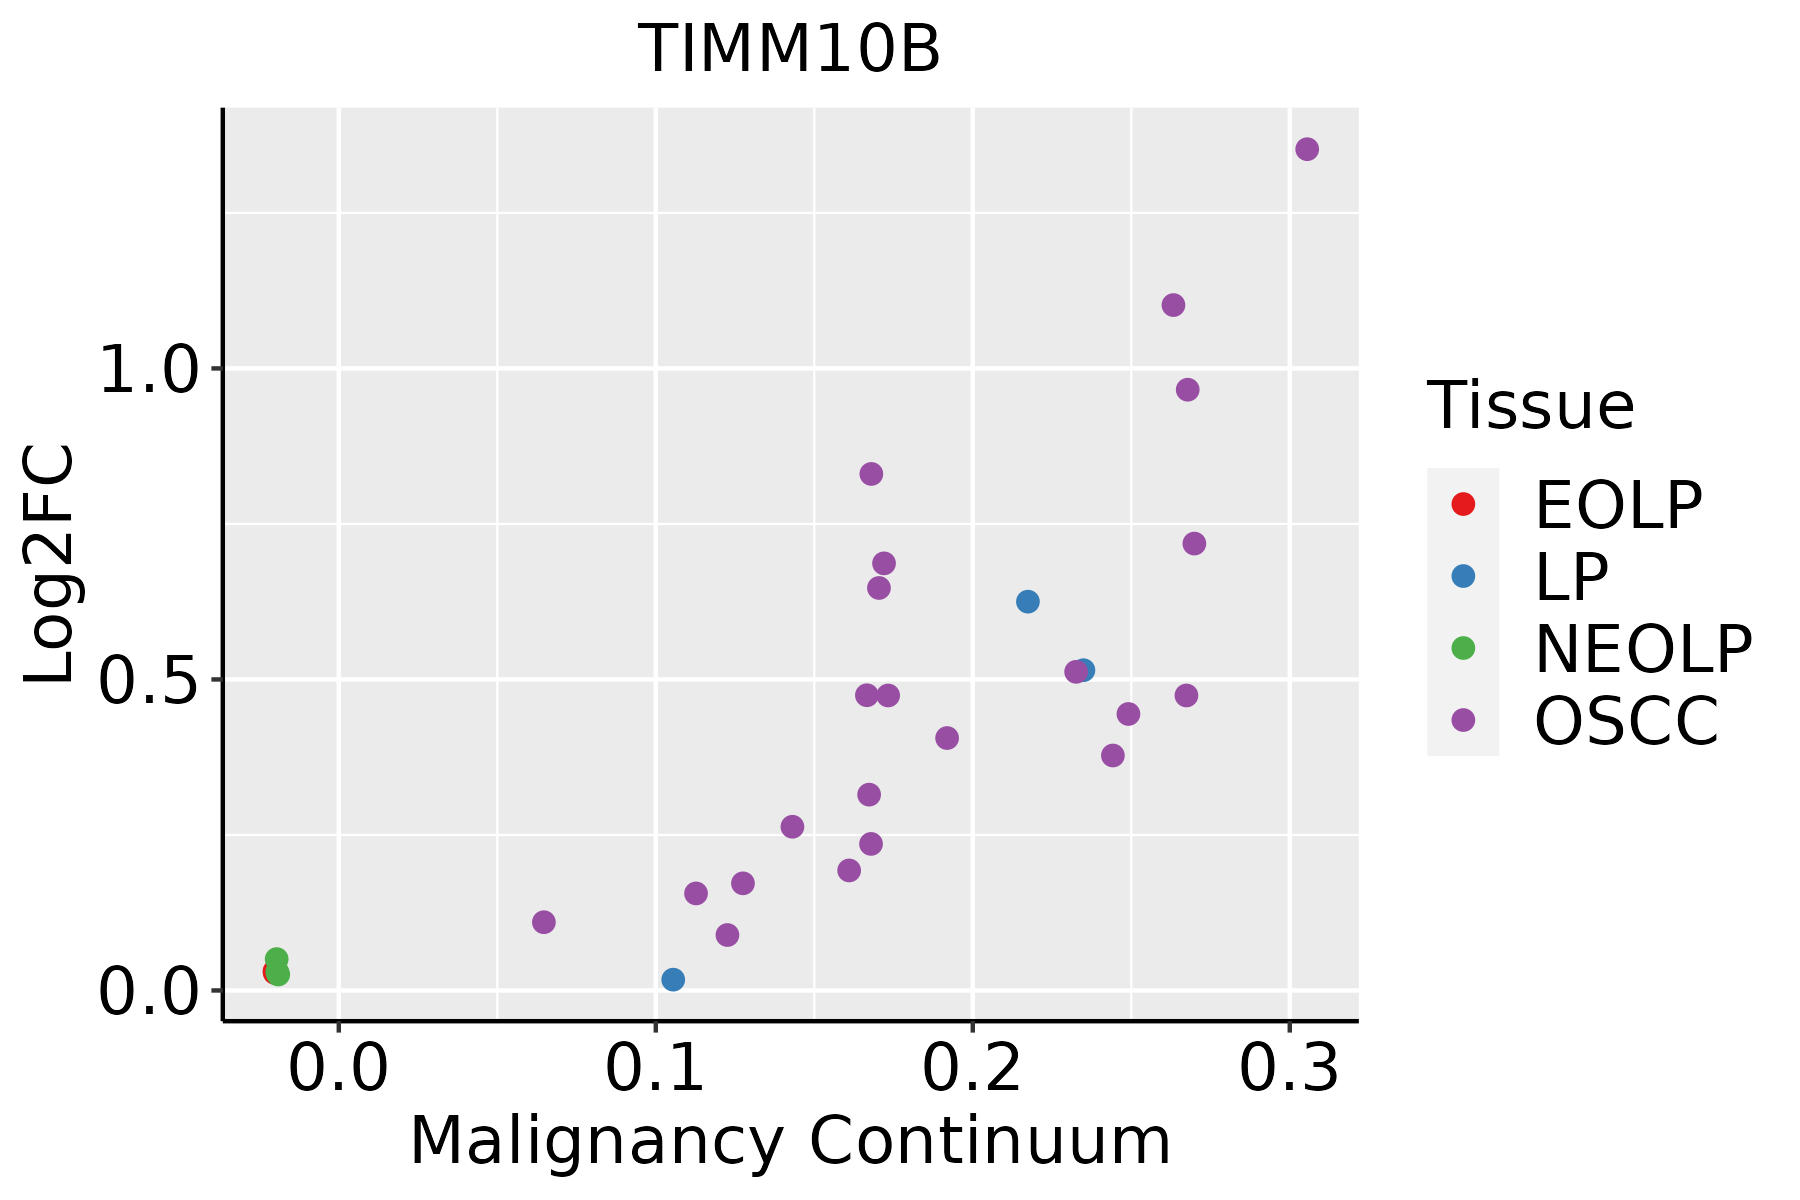 | EOLP: Erosive Oral lichen planus |
| LP: leukoplakia | ||
| NEOLP: Non-erosive oral lichen planus | ||
| OSCC: Oral squamous cell carcinoma | ||
| Skin | 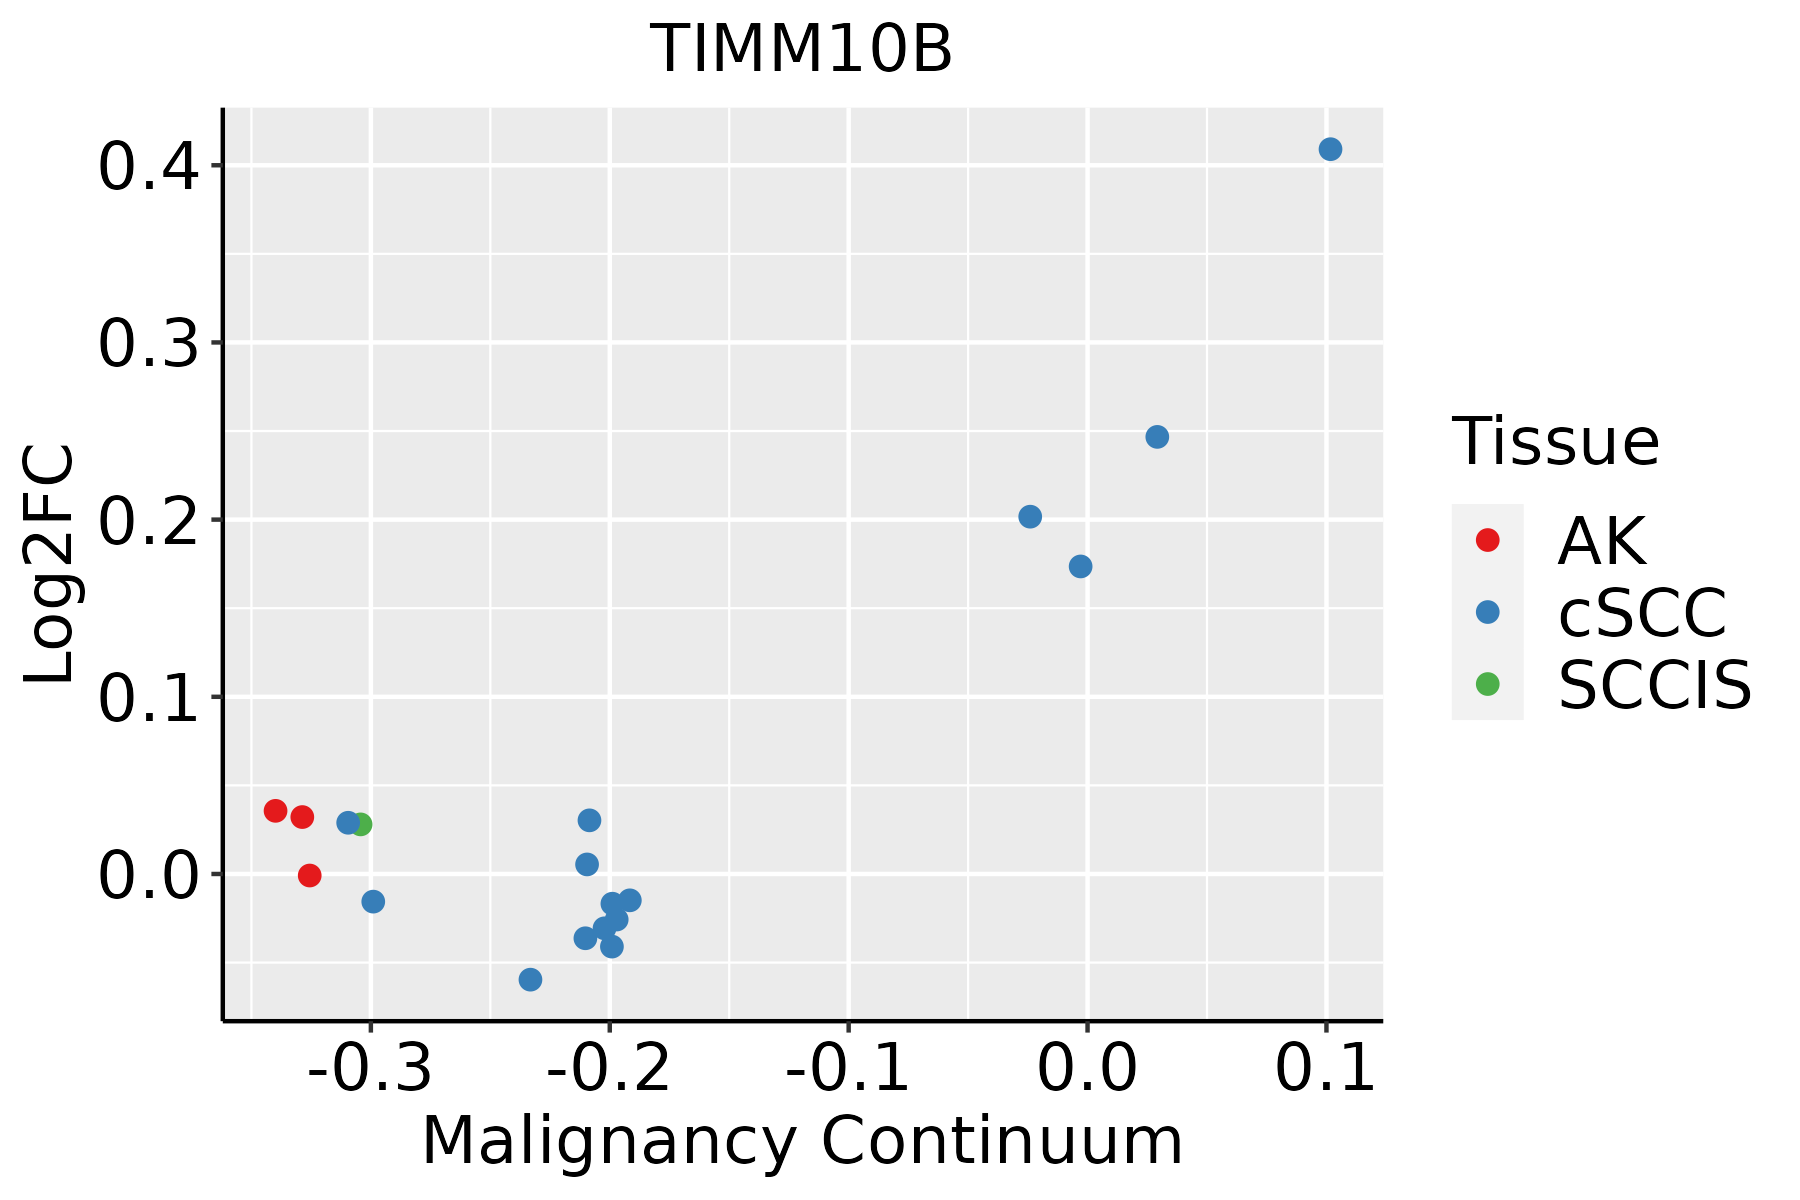 | AK: Actinic keratosis |
| cSCC: Cutaneous squamous cell carcinoma | ||
| SCCIS:squamous cell carcinoma in situ | ||
| Thyroid | 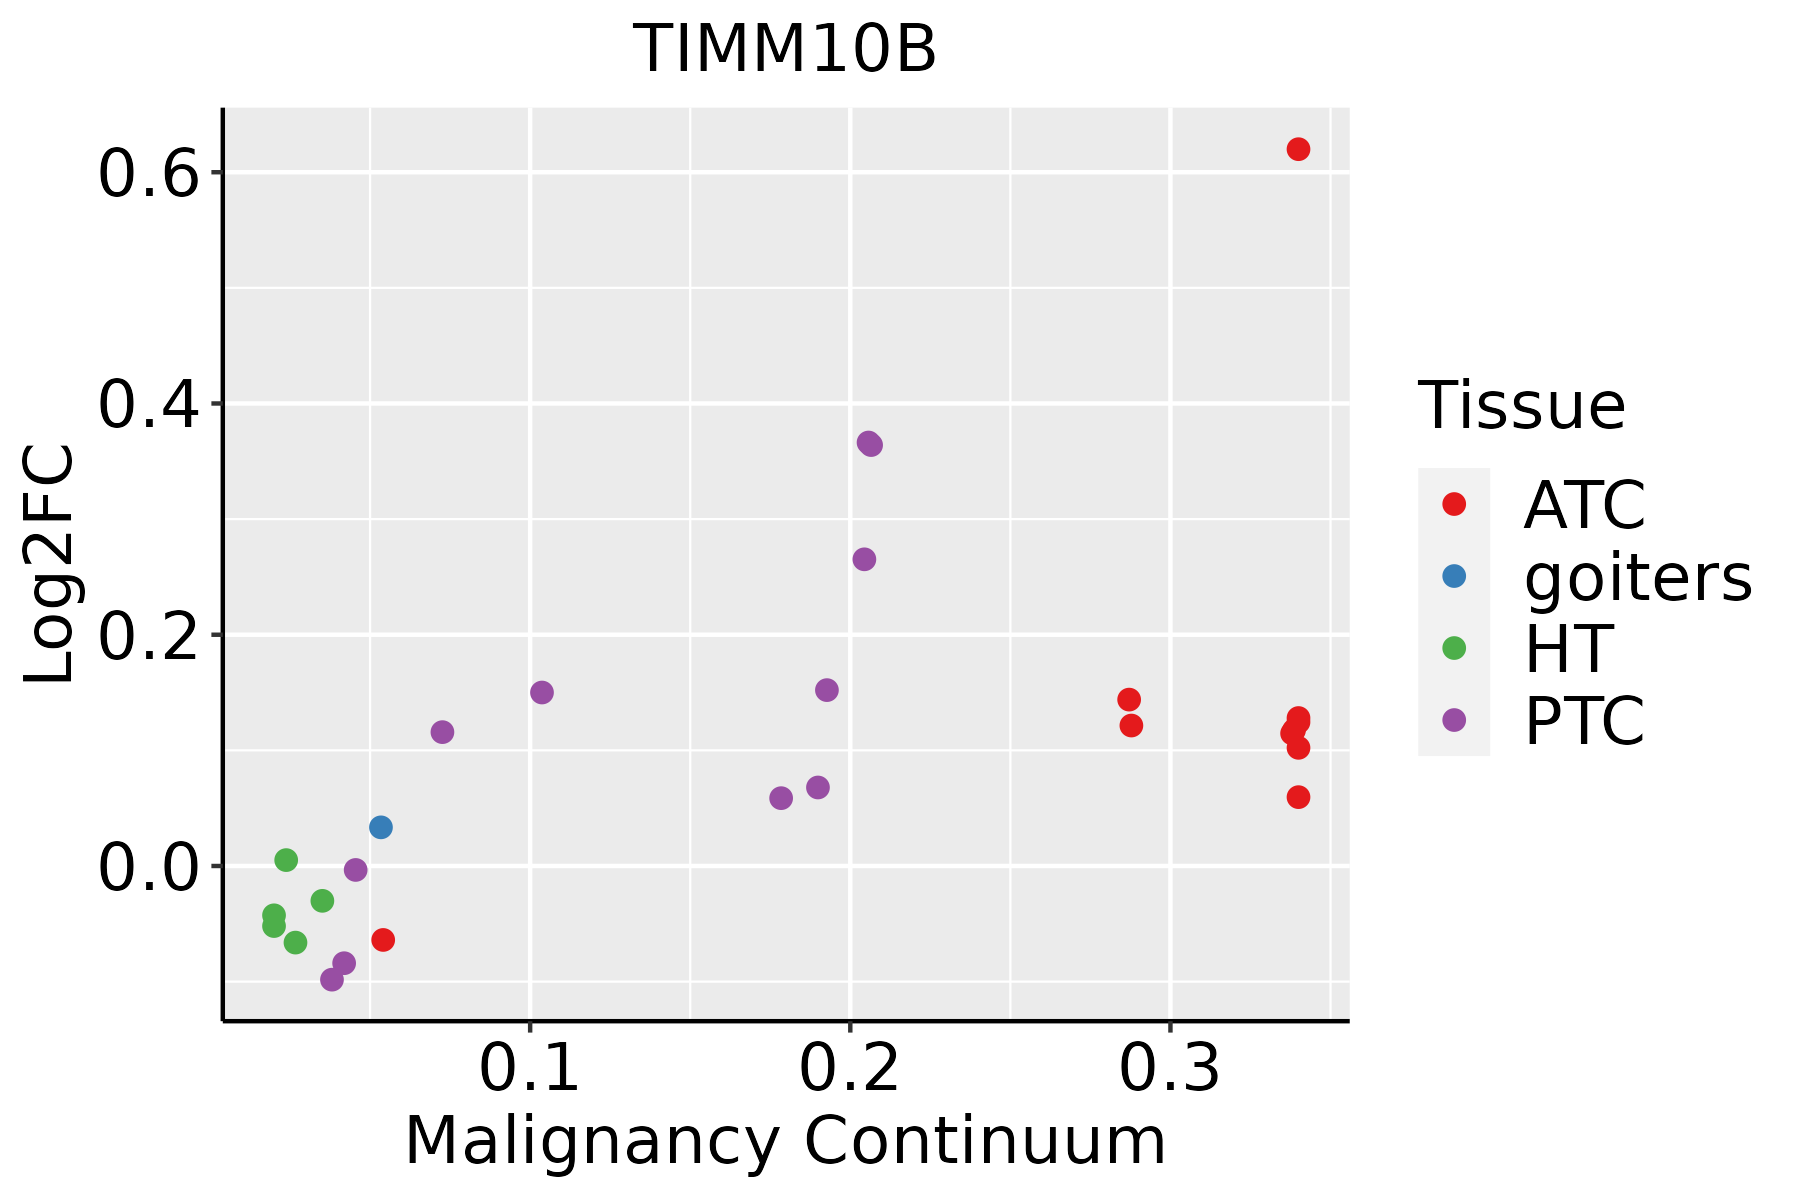 | ATC: Anaplastic thyroid cancer |
| HT: Hashimoto's thyroiditis | ||
| PTC: Papillary thyroid cancer |
| ∗log2FC in expression of this searched gene in stem-like cells from each diseased tissue sample relative to stem-like cells in normal samples in each tissue plotted against the malignancy continuum. Samples are colored based on if they are from different disease stage. |
Top |
Malignant transformation related pathway analysis |
| Find out the enriched GO biological processes and KEGG pathways involved in transition from healthy to precancer to cancer |
| Tissue | Disease Stage | Enriched GO biological Processes |
| Colorectum | AD |  |
| Colorectum | SER |  |
| Colorectum | MSS |  |
| Colorectum | MSI-H |  |
| Colorectum | FAP |  |
| ∗Top 15 enriched GO BP terms are showed in the bar plot of each disease state in each tissue. Each row represents a significant GO biological process which is colored according to the -log10(p.adjust). |
| Page: 1 2 3 4 5 6 7 8 9 |
| GO ID | Tissue | Disease Stage | Description | Gene Ratio | Bg Ratio | pvalue | p.adjust | Count |
| GO:000683927 | Skin | cSCC | mitochondrial transport | 124/4864 | 254/18723 | 3.54e-15 | 2.81e-13 | 124 |
| GO:007058525 | Skin | cSCC | protein localization to mitochondrion | 74/4864 | 125/18723 | 3.95e-15 | 3.06e-13 | 74 |
| GO:007265525 | Skin | cSCC | establishment of protein localization to mitochondrion | 71/4864 | 120/18723 | 1.48e-14 | 1.04e-12 | 71 |
| GO:009015024 | Skin | cSCC | establishment of protein localization to membrane | 123/4864 | 260/18723 | 8.34e-14 | 5.18e-12 | 123 |
| GO:000662624 | Skin | cSCC | protein targeting to mitochondrion | 61/4864 | 100/18723 | 1.53e-13 | 9.32e-12 | 61 |
| GO:0007006110 | Skin | cSCC | mitochondrial membrane organization | 64/4864 | 116/18723 | 2.16e-11 | 1.08e-09 | 64 |
| GO:00512058 | Skin | cSCC | protein insertion into membrane | 34/4864 | 57/18723 | 8.07e-08 | 1.96e-06 | 34 |
| GO:00070077 | Skin | cSCC | inner mitochondrial membrane organization | 24/4864 | 38/18723 | 1.54e-06 | 2.62e-05 | 24 |
| GO:009015119 | Skin | cSCC | establishment of protein localization to mitochondrial membrane | 20/4864 | 30/18723 | 3.41e-06 | 5.20e-05 | 20 |
| GO:003158926 | Skin | cSCC | cell-substrate adhesion | 130/4864 | 363/18723 | 1.87e-05 | 2.23e-04 | 130 |
| GO:005120410 | Skin | cSCC | protein insertion into mitochondrial membrane | 16/4864 | 25/18723 | 7.07e-05 | 6.83e-04 | 16 |
| GO:000716024 | Skin | cSCC | cell-matrix adhesion | 85/4864 | 233/18723 | 2.43e-04 | 1.98e-03 | 85 |
| GO:00450394 | Skin | cSCC | protein insertion into mitochondrial inner membrane | 8/4864 | 12/18723 | 3.61e-03 | 1.94e-02 | 8 |
| GO:0072594112 | Thyroid | PTC | establishment of protein localization to organelle | 244/5968 | 422/18723 | 1.18e-28 | 4.97e-26 | 244 |
| GO:0006605113 | Thyroid | PTC | protein targeting | 180/5968 | 314/18723 | 6.81e-21 | 1.19e-18 | 180 |
| GO:000683928 | Thyroid | PTC | mitochondrial transport | 150/5968 | 254/18723 | 2.76e-19 | 3.34e-17 | 150 |
| GO:0090150112 | Thyroid | PTC | establishment of protein localization to membrane | 149/5968 | 260/18723 | 1.64e-17 | 1.59e-15 | 149 |
| GO:0070585112 | Thyroid | PTC | protein localization to mitochondrion | 83/5968 | 125/18723 | 2.15e-15 | 1.56e-13 | 83 |
| GO:0072655112 | Thyroid | PTC | establishment of protein localization to mitochondrion | 80/5968 | 120/18723 | 4.87e-15 | 3.30e-13 | 80 |
| GO:0006626111 | Thyroid | PTC | protein targeting to mitochondrion | 67/5968 | 100/18723 | 5.55e-13 | 2.74e-11 | 67 |
| Page: 1 2 3 4 5 6 |
| Pathway ID | Tissue | Disease Stage | Description | Gene Ratio | Bg Ratio | pvalue | p.adjust | qvalue | Count |
| Page: 1 |
Top |
Cell-cell communication analysis |
| Identification of potential cell-cell interactions between two cell types and their ligand-receptor pairs for different disease states |
| Ligand | Receptor | LRpair | Pathway | Tissue | Disease Stage |
| Page: 1 |
Top |
Single-cell gene regulatory network inference analysis |
| Find out the significant the regulons (TFs) and the target genes of each regulon across cell types for different disease states |
| TF | Cell Type | Tissue | Disease Stage | Target Gene | RSS | Regulon Activity |
| ∗The dot plots of a searched regulon are shown for all cell subpopulations in each disease state of each tissue based on the regulon specific score inferred using pySCENIC and by calculating the average expression. |
| Page: 1 |
Top |
Somatic mutation of malignant transformation related genes |
| Annotation of somatic variants for genes involved in malignant transformation |
| Hugo Symbol | Variant Class | Variant Classification | dbSNP RS | HGVSc | HGVSp | HGVSp Short | SWISSPROT | BIOTYPE | SIFT | PolyPhen | Tumor Sample Barcode | Tissue | Histology | Sex | Age | Stage | Therapy Types | Drugs | Outcome |
| TIMM10B | SNV | Missense_Mutation | rs769574214 | c.140N>T | p.Ala47Val | p.A47V | Q9Y5J6 | protein_coding | tolerated(0.2) | benign(0.177) | TCGA-2W-A8YY-01 | Cervix | cervical & endocervical cancer | Female | <65 | I/II | Chemotherapy | cisplatin | CR |
| TIMM10B | SNV | Missense_Mutation | c.278C>T | p.Ala93Val | p.A93V | Q9Y5J6 | protein_coding | tolerated(0.2) | benign(0.021) | TCGA-VS-A9V1-01 | Cervix | cervical & endocervical cancer | Female | <65 | I/II | Chemotherapy | cisplatin | PD | |
| TIMM10B | SNV | Missense_Mutation | novel | c.53N>G | p.Leu18Arg | p.L18R | Q9Y5J6 | protein_coding | deleterious(0) | probably_damaging(0.998) | TCGA-AG-A014-01 | Colorectum | rectum adenocarcinoma | Male | >=65 | I/II | Unknown | Unknown | SD |
| TIMM10B | SNV | Missense_Mutation | rs373041023 | c.152N>T | p.Ser51Ile | p.S51I | Q9Y5J6 | protein_coding | deleterious(0.02) | probably_damaging(0.916) | TCGA-A5-A0G2-01 | Endometrium | uterine corpus endometrioid carcinoma | Female | <65 | III/IV | Unknown | Unknown | SD |
| TIMM10B | SNV | Missense_Mutation | rs757357862 | c.296C>T | p.Ser99Phe | p.S99F | Q9Y5J6 | protein_coding | deleterious(0.01) | benign(0.276) | TCGA-D1-A175-01 | Endometrium | uterine corpus endometrioid carcinoma | Female | <65 | I/II | Chemotherapy | paclitaxel | SD |
| TIMM10B | SNV | Missense_Mutation | novel | c.76N>A | p.Glu26Lys | p.E26K | Q9Y5J6 | protein_coding | deleterious(0) | probably_damaging(0.999) | TCGA-E6-A1LX-01 | Endometrium | uterine corpus endometrioid carcinoma | Female | <65 | I/II | Unknown | Unknown | SD |
| TIMM10B | SNV | Missense_Mutation | novel | c.107T>C | p.Leu36Ser | p.L36S | Q9Y5J6 | protein_coding | deleterious(0) | probably_damaging(0.986) | TCGA-DD-AAD0-01 | Liver | liver hepatocellular carcinoma | Female | >=65 | I/II | Unknown | Unknown | PD |
| Page: 1 |
Top |
Related drugs of malignant transformation related genes |
| Identification of chemicals and drugs interact with genes involved in malignant transfromation |
| (DGIdb 4.0) |
| Entrez ID | Symbol | Category | Interaction Types | Drug Claim Name | Drug Name | PMIDs |
| Page: 1 |

Copyright 2023-Present -The University of Texas Health Science Center at Houston |