
|
|||||
|
 | |
| |
| |
| |
| |
| |
|
Gene: TARBP2 |
Gene summary for TARBP2 |
| Gene information | Species | Human | Gene symbol | TARBP2 | Gene ID | 6895 |
| Gene name | TARBP2 subunit of RISC loading complex | |
| Gene Alias | LOQS | |
| Cytomap | 12q13.13 | |
| Gene Type | protein-coding | GO ID | GO:0001932 | UniProtAcc | Q15633 |
Top |
Malignant transformation analysis |
| Identification of the aberrant gene expression in precancerous and cancerous lesions by comparing the gene expression of stem-like cells in diseased tissues with normal stem cells |
| Entrez ID | Symbol | Replicates | Species | Organ | Tissue | Adj P-value | Log2FC | Malignancy |
| 6895 | TARBP2 | LZE4T | Human | Esophagus | ESCC | 2.54e-03 | 8.10e-02 | 0.0811 |
| 6895 | TARBP2 | LZE7T | Human | Esophagus | ESCC | 5.42e-04 | 3.80e-01 | 0.0667 |
| 6895 | TARBP2 | LZE8T | Human | Esophagus | ESCC | 5.95e-08 | 1.28e-01 | 0.067 |
| 6895 | TARBP2 | LZE24T | Human | Esophagus | ESCC | 1.33e-14 | 3.29e-01 | 0.0596 |
| 6895 | TARBP2 | LZE6T | Human | Esophagus | ESCC | 4.48e-03 | 1.54e-01 | 0.0845 |
| 6895 | TARBP2 | P1T-E | Human | Esophagus | ESCC | 6.73e-08 | 3.32e-01 | 0.0875 |
| 6895 | TARBP2 | P2T-E | Human | Esophagus | ESCC | 1.12e-28 | 5.63e-01 | 0.1177 |
| 6895 | TARBP2 | P4T-E | Human | Esophagus | ESCC | 1.94e-12 | 3.48e-01 | 0.1323 |
| 6895 | TARBP2 | P5T-E | Human | Esophagus | ESCC | 2.34e-13 | 1.78e-01 | 0.1327 |
| 6895 | TARBP2 | P8T-E | Human | Esophagus | ESCC | 2.99e-14 | 3.11e-01 | 0.0889 |
| 6895 | TARBP2 | P9T-E | Human | Esophagus | ESCC | 5.36e-10 | 1.45e-01 | 0.1131 |
| 6895 | TARBP2 | P10T-E | Human | Esophagus | ESCC | 7.42e-25 | 4.71e-01 | 0.116 |
| 6895 | TARBP2 | P11T-E | Human | Esophagus | ESCC | 1.45e-09 | 3.52e-01 | 0.1426 |
| 6895 | TARBP2 | P12T-E | Human | Esophagus | ESCC | 2.92e-15 | 3.55e-01 | 0.1122 |
| 6895 | TARBP2 | P15T-E | Human | Esophagus | ESCC | 1.76e-20 | 4.31e-01 | 0.1149 |
| 6895 | TARBP2 | P16T-E | Human | Esophagus | ESCC | 3.67e-26 | 3.62e-01 | 0.1153 |
| 6895 | TARBP2 | P17T-E | Human | Esophagus | ESCC | 1.50e-15 | 4.32e-01 | 0.1278 |
| 6895 | TARBP2 | P19T-E | Human | Esophagus | ESCC | 1.61e-11 | 5.48e-01 | 0.1662 |
| 6895 | TARBP2 | P20T-E | Human | Esophagus | ESCC | 2.93e-22 | 3.98e-01 | 0.1124 |
| 6895 | TARBP2 | P21T-E | Human | Esophagus | ESCC | 2.15e-18 | 3.46e-01 | 0.1617 |
| Page: 1 2 3 4 5 |
| Tissue | Expression Dynamics | Abbreviation |
| Esophagus | 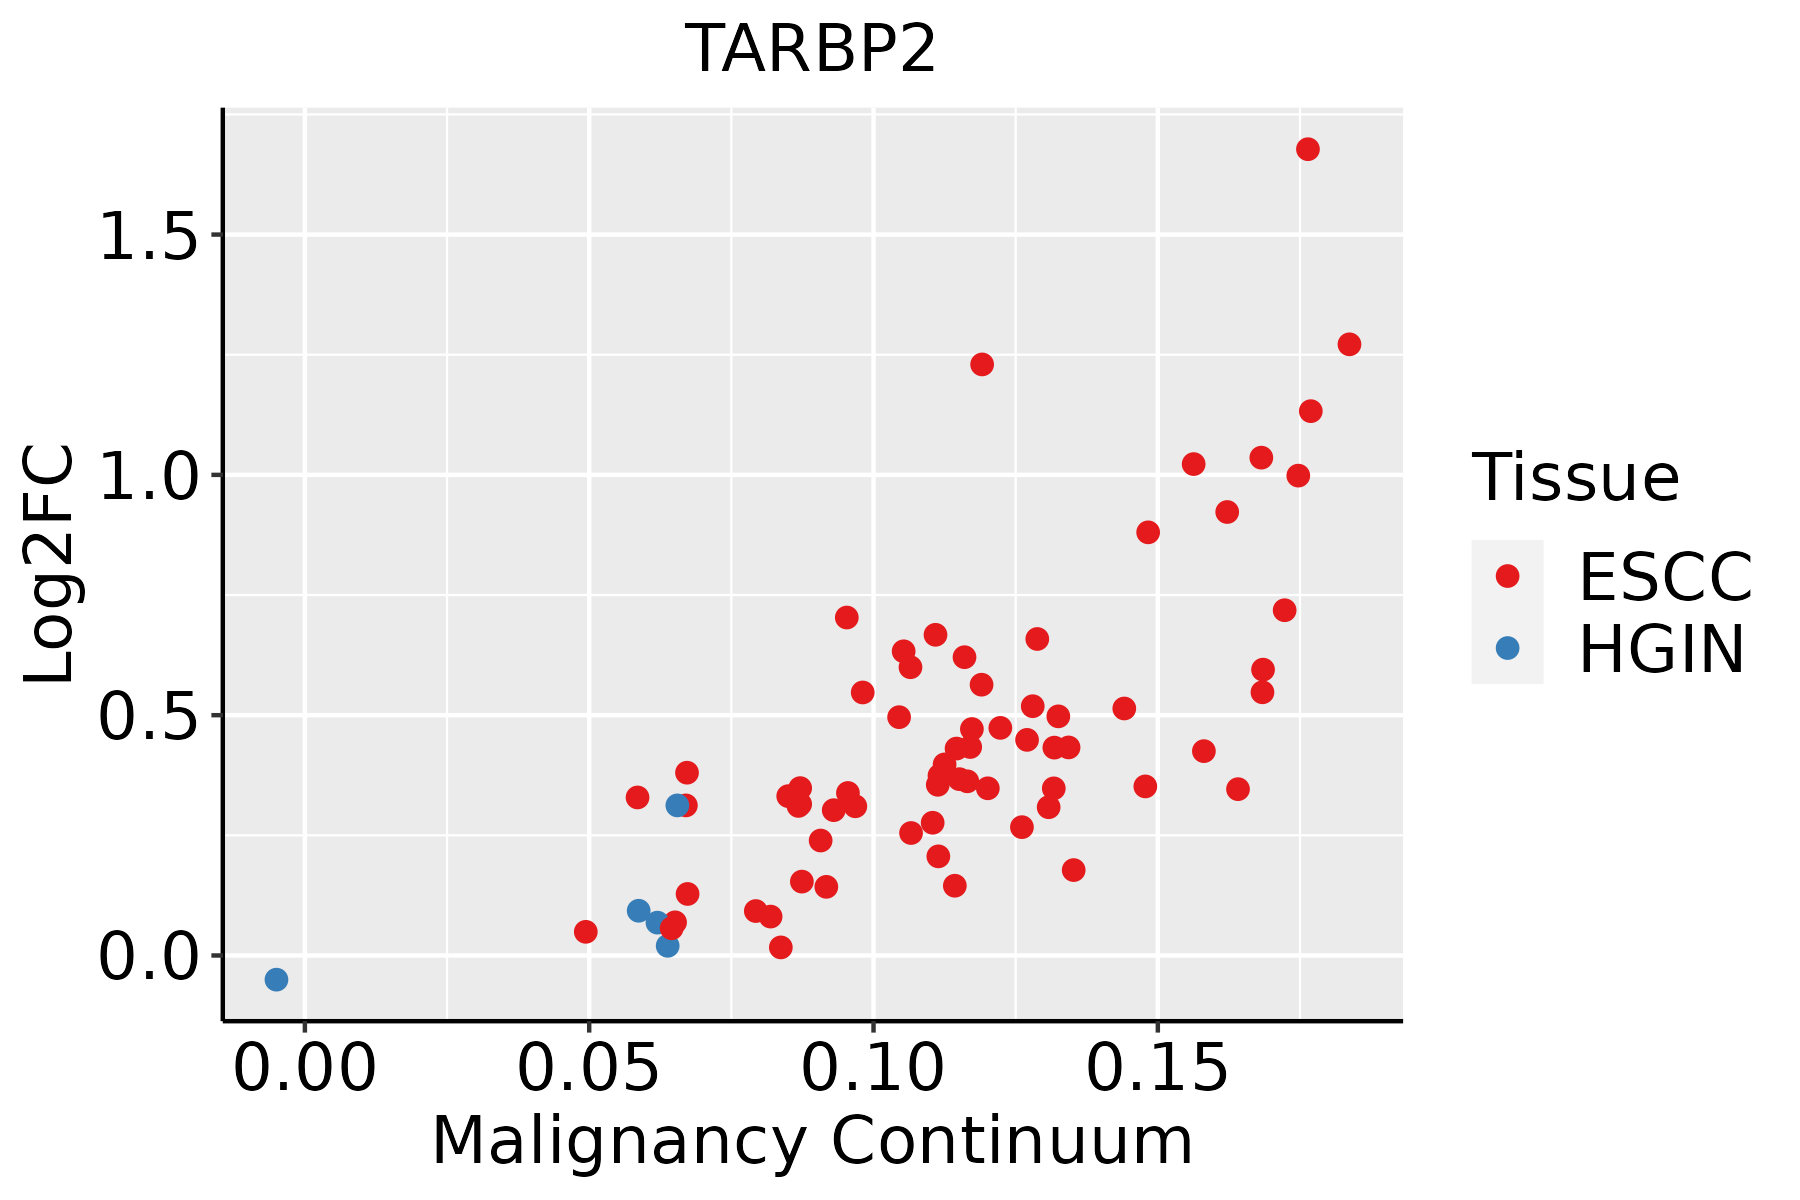 | ESCC: Esophageal squamous cell carcinoma |
| HGIN: High-grade intraepithelial neoplasias | ||
| LGIN: Low-grade intraepithelial neoplasias | ||
| Liver | 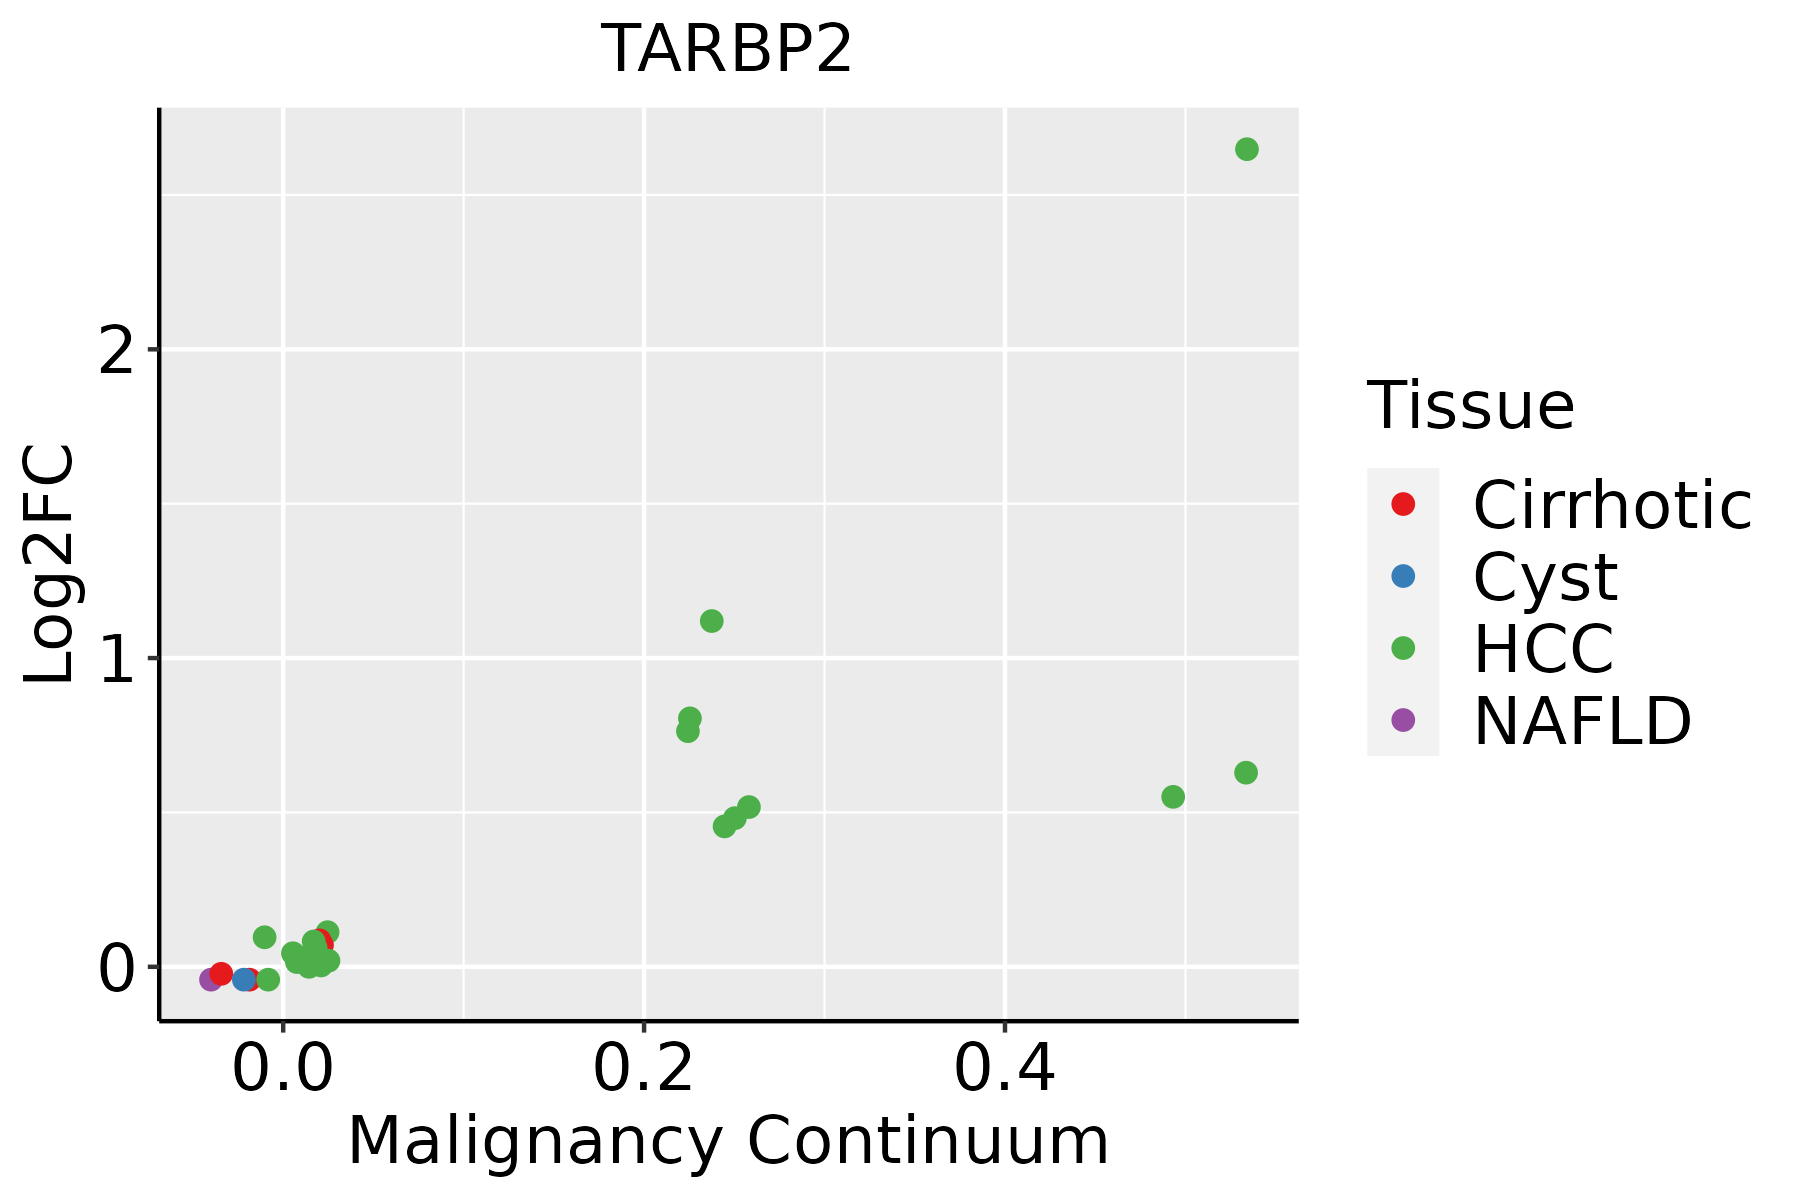 | HCC: Hepatocellular carcinoma |
| NAFLD: Non-alcoholic fatty liver disease | ||
| Oral Cavity | 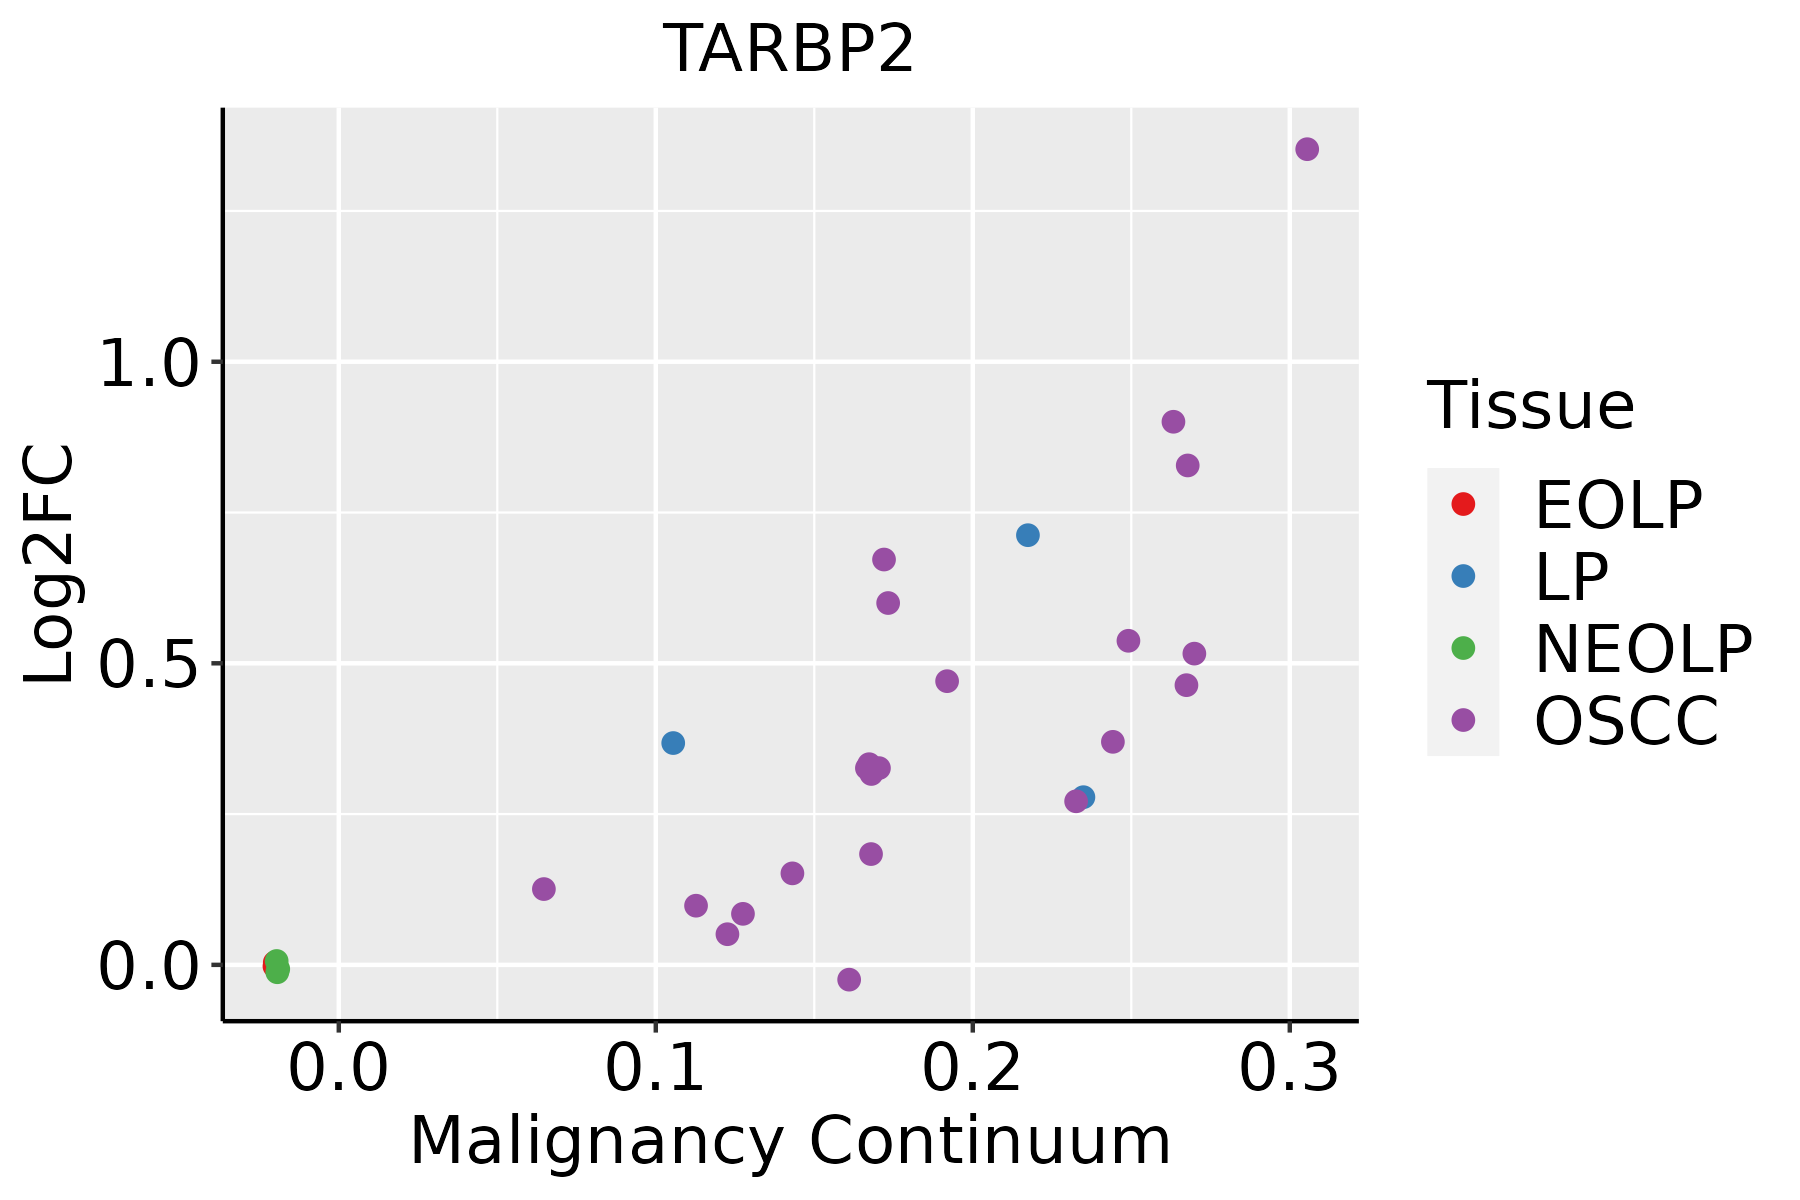 | EOLP: Erosive Oral lichen planus |
| LP: leukoplakia | ||
| NEOLP: Non-erosive oral lichen planus | ||
| OSCC: Oral squamous cell carcinoma | ||
| Skin | 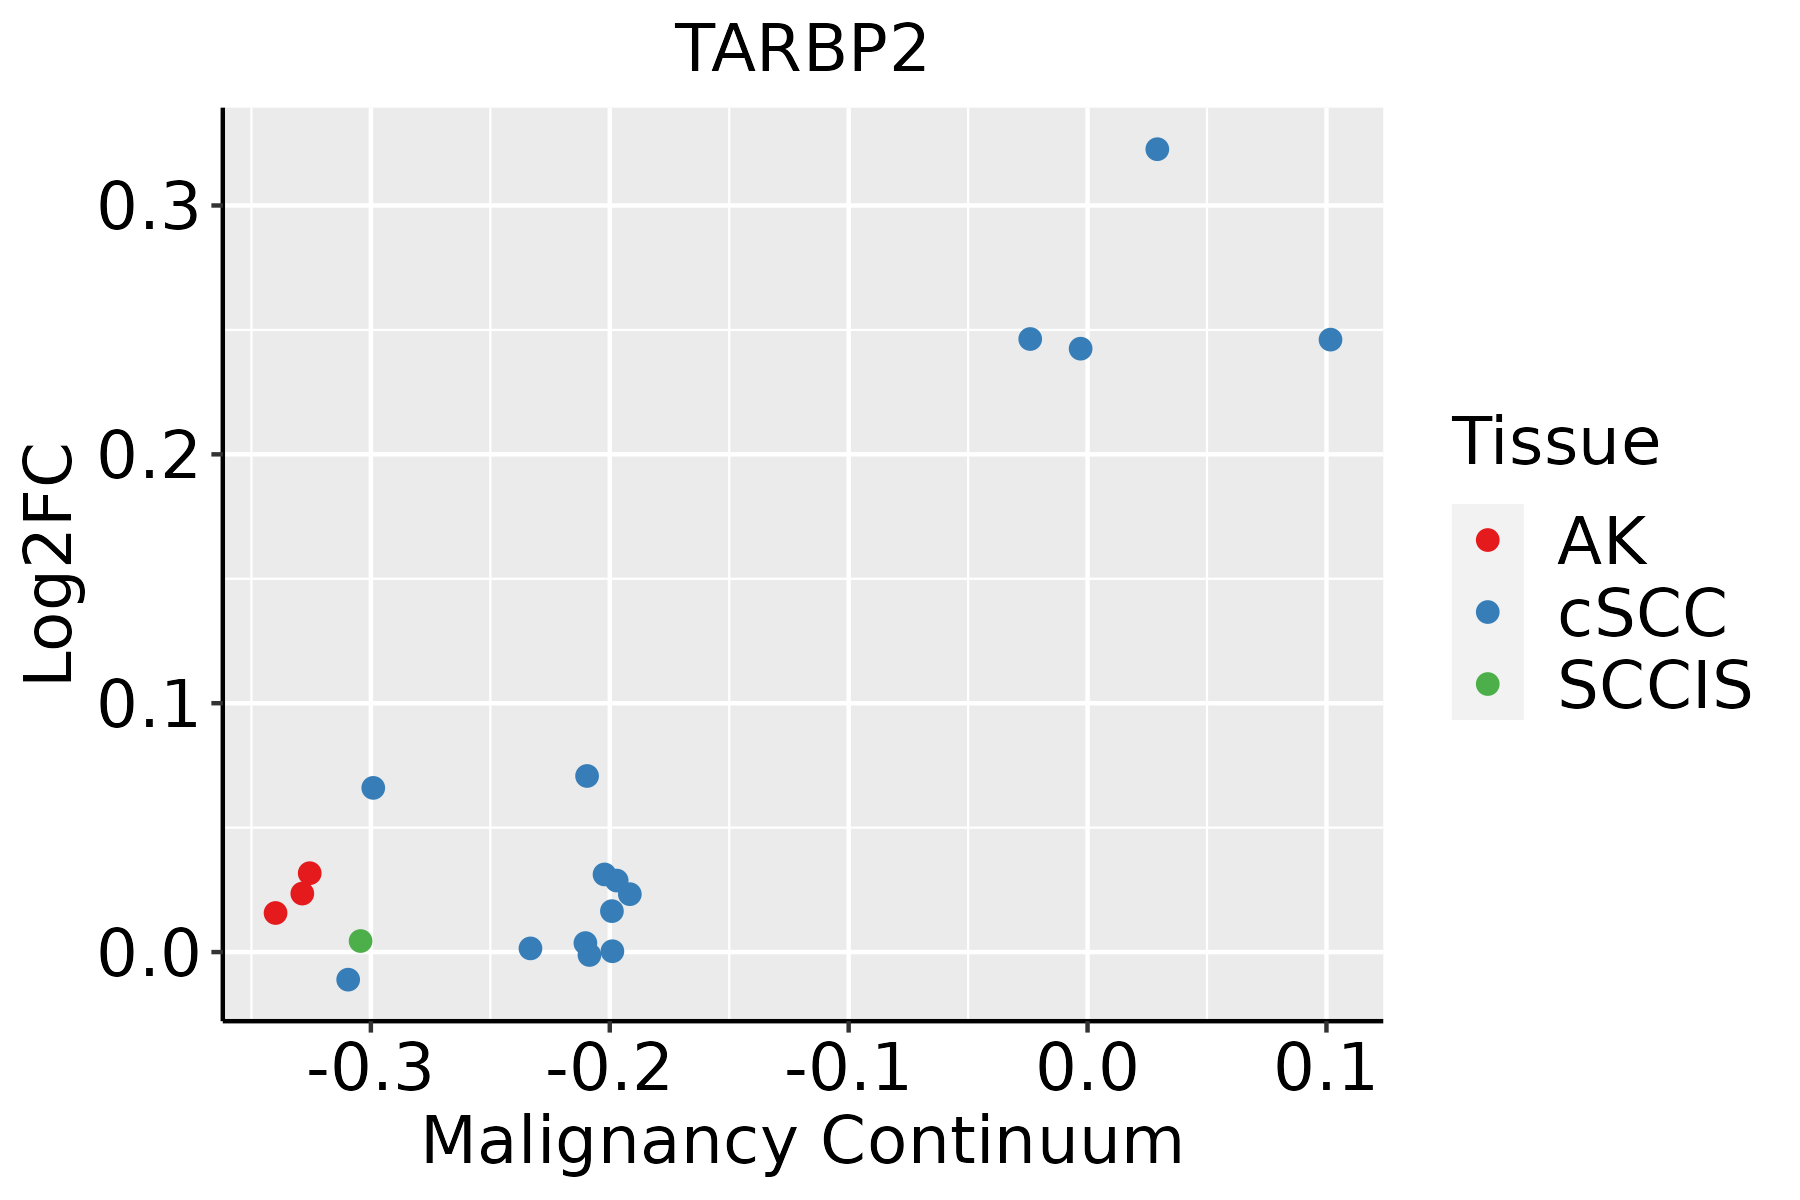 | AK: Actinic keratosis |
| cSCC: Cutaneous squamous cell carcinoma | ||
| SCCIS:squamous cell carcinoma in situ |
| ∗log2FC in expression of this searched gene in stem-like cells from each diseased tissue sample relative to stem-like cells in normal samples in each tissue plotted against the malignancy continuum. Samples are colored based on if they are from different disease stage. |
Top |
Malignant transformation related pathway analysis |
| Find out the enriched GO biological processes and KEGG pathways involved in transition from healthy to precancer to cancer |
| Tissue | Disease Stage | Enriched GO biological Processes |
| Colorectum | AD |  |
| Colorectum | SER |  |
| Colorectum | MSS |  |
| Colorectum | MSI-H |  |
| Colorectum | FAP |  |
| ∗Top 15 enriched GO BP terms are showed in the bar plot of each disease state in each tissue. Each row represents a significant GO biological process which is colored according to the -log10(p.adjust). |
| Page: 1 2 3 4 5 6 7 8 9 |
| GO ID | Tissue | Disease Stage | Description | Gene Ratio | Bg Ratio | pvalue | p.adjust | Count |
| GO:004506922 | Liver | HCC | regulation of viral genome replication | 59/7958 | 85/18723 | 4.66e-07 | 7.61e-06 | 59 |
| GO:004507021 | Liver | HCC | positive regulation of viral genome replication | 26/7958 | 30/18723 | 7.18e-07 | 1.12e-05 | 26 |
| GO:00516071 | Liver | HCC | defense response to virus | 151/7958 | 265/18723 | 1.27e-06 | 1.85e-05 | 151 |
| GO:01405461 | Liver | HCC | defense response to symbiont | 151/7958 | 265/18723 | 1.27e-06 | 1.85e-05 | 151 |
| GO:003105021 | Liver | HCC | dsRNA processing | 38/7958 | 54/18723 | 3.15e-05 | 3.21e-04 | 38 |
| GO:007091821 | Liver | HCC | production of small RNA involved in gene silencing by RNA | 38/7958 | 54/18723 | 3.15e-05 | 3.21e-04 | 38 |
| GO:00028321 | Liver | HCC | negative regulation of response to biotic stimulus | 66/7958 | 108/18723 | 7.24e-05 | 6.50e-04 | 66 |
| GO:00028312 | Liver | HCC | regulation of response to biotic stimulus | 173/7958 | 327/18723 | 8.55e-05 | 7.48e-04 | 173 |
| GO:003519621 | Liver | HCC | production of miRNAs involved in gene silencing by miRNA | 36/7958 | 52/18723 | 8.79e-05 | 7.66e-04 | 36 |
| GO:00310541 | Liver | HCC | pre-miRNA processing | 13/7958 | 14/18723 | 1.25e-04 | 1.03e-03 | 13 |
| GO:006096621 | Liver | HCC | regulation of gene silencing by RNA | 35/7958 | 53/18723 | 4.59e-04 | 3.04e-03 | 35 |
| GO:0050687 | Liver | HCC | negative regulation of defense response to virus | 18/7958 | 24/18723 | 1.27e-03 | 6.92e-03 | 18 |
| GO:0046782 | Liver | HCC | regulation of viral transcription | 15/7958 | 19/18723 | 1.36e-03 | 7.28e-03 | 15 |
| GO:0050688 | Liver | HCC | regulation of defense response to virus | 41/7958 | 69/18723 | 3.38e-03 | 1.54e-02 | 41 |
| GO:0050777 | Liver | HCC | negative regulation of immune response | 101/7958 | 194/18723 | 4.40e-03 | 1.90e-02 | 101 |
| GO:0016246 | Liver | HCC | RNA interference | 10/7958 | 13/18723 | 1.28e-02 | 4.61e-02 | 10 |
| GO:002261320 | Oral cavity | OSCC | ribonucleoprotein complex biogenesis | 333/7305 | 463/18723 | 8.28e-48 | 5.24e-44 | 333 |
| GO:001603220 | Oral cavity | OSCC | viral process | 274/7305 | 415/18723 | 2.42e-29 | 1.70e-26 | 274 |
| GO:00344709 | Oral cavity | OSCC | ncRNA processing | 263/7305 | 395/18723 | 4.38e-29 | 2.78e-26 | 263 |
| GO:00346605 | Oral cavity | OSCC | ncRNA metabolic process | 296/7305 | 485/18723 | 2.94e-23 | 6.65e-21 | 296 |
| Page: 1 2 3 4 5 6 7 8 9 10 |
| Pathway ID | Tissue | Disease Stage | Description | Gene Ratio | Bg Ratio | pvalue | p.adjust | qvalue | Count |
| Page: 1 |
Top |
Cell-cell communication analysis |
| Identification of potential cell-cell interactions between two cell types and their ligand-receptor pairs for different disease states |
| Ligand | Receptor | LRpair | Pathway | Tissue | Disease Stage |
| Page: 1 |
Top |
Single-cell gene regulatory network inference analysis |
| Find out the significant the regulons (TFs) and the target genes of each regulon across cell types for different disease states |
| TF | Cell Type | Tissue | Disease Stage | Target Gene | RSS | Regulon Activity |
| ∗The dot plots of a searched regulon are shown for all cell subpopulations in each disease state of each tissue based on the regulon specific score inferred using pySCENIC and by calculating the average expression. |
| Page: 1 |
Top |
Somatic mutation of malignant transformation related genes |
| Annotation of somatic variants for genes involved in malignant transformation |
| Hugo Symbol | Variant Class | Variant Classification | dbSNP RS | HGVSc | HGVSp | HGVSp Short | SWISSPROT | BIOTYPE | SIFT | PolyPhen | Tumor Sample Barcode | Tissue | Histology | Sex | Age | Stage | Therapy Types | Drugs | Outcome |
| TARBP2 | SNV | Missense_Mutation | c.791C>A | p.Thr264Asn | p.T264N | Q15633 | protein_coding | deleterious(0.01) | probably_damaging(0.987) | TCGA-AO-A128-01 | Breast | breast invasive carcinoma | Female | <65 | I/II | Chemotherapy | doxorubicin | SD | |
| TARBP2 | SNV | Missense_Mutation | c.160N>A | p.Glu54Lys | p.E54K | Q15633 | protein_coding | deleterious(0.01) | probably_damaging(0.989) | TCGA-D8-A27G-01 | Breast | breast invasive carcinoma | Female | >=65 | I/II | Unknown | Unknown | SD | |
| TARBP2 | insertion | Frame_Shift_Ins | novel | c.925_926insGCCTTGACTGTAGGCCCGC | p.Val309GlyfsTer13 | p.V309Gfs*13 | Q15633 | protein_coding | TCGA-A2-A0EO-01 | Breast | breast invasive carcinoma | Female | <65 | I/II | Hormone Therapy | tamoxiphen | SD | ||
| TARBP2 | insertion | In_Frame_Ins | novel | c.927_928insTGTAGCTCTGTTACTGGGGTGAGG | p.Val309_Ser310insCysSerSerValThrGlyValArg | p.V309_S310insCSSVTGVR | Q15633 | protein_coding | TCGA-A2-A0EO-01 | Breast | breast invasive carcinoma | Female | <65 | I/II | Hormone Therapy | tamoxiphen | SD | ||
| TARBP2 | SNV | Missense_Mutation | c.565N>T | p.Arg189Cys | p.R189C | Q15633 | protein_coding | deleterious(0) | probably_damaging(0.995) | TCGA-C5-A8XH-01 | Cervix | cervical & endocervical cancer | Female | <65 | I/II | Unknown | Unknown | SD | |
| TARBP2 | SNV | Missense_Mutation | c.590N>A | p.Arg197Gln | p.R197Q | Q15633 | protein_coding | deleterious(0.02) | benign(0.027) | TCGA-AA-A01R-01 | Colorectum | colon adenocarcinoma | Male | <65 | III/IV | Chemotherapy | 5-fluorouracil | PD | |
| TARBP2 | SNV | Missense_Mutation | c.653N>T | p.Ala218Val | p.A218V | Q15633 | protein_coding | deleterious(0) | probably_damaging(0.995) | TCGA-AA-A022-01 | Colorectum | colon adenocarcinoma | Female | >=65 | I/II | Unknown | Unknown | SD | |
| TARBP2 | SNV | Missense_Mutation | c.673N>A | p.Val225Met | p.V225M | Q15633 | protein_coding | deleterious(0.03) | possibly_damaging(0.467) | TCGA-AD-A5EJ-01 | Colorectum | colon adenocarcinoma | Female | >=65 | I/II | Unknown | Unknown | SD | |
| TARBP2 | SNV | Missense_Mutation | c.521N>A | p.Arg174Gln | p.R174Q | Q15633 | protein_coding | deleterious(0.01) | probably_damaging(0.991) | TCGA-AZ-4615-01 | Colorectum | colon adenocarcinoma | Male | >=65 | III/IV | Chemotherapy | xeloda | PD | |
| TARBP2 | SNV | Missense_Mutation | c.556C>A | p.Pro186Thr | p.P186T | Q15633 | protein_coding | deleterious(0) | probably_damaging(0.999) | TCGA-AZ-6605-01 | Colorectum | colon adenocarcinoma | Male | >=65 | III/IV | Chemotherapy | folfox | SD |
| Page: 1 2 3 4 |
Top |
Related drugs of malignant transformation related genes |
| Identification of chemicals and drugs interact with genes involved in malignant transfromation |
| (DGIdb 4.0) |
| Entrez ID | Symbol | Category | Interaction Types | Drug Claim Name | Drug Name | PMIDs |
| Page: 1 |

Copyright 2023-Present -The University of Texas Health Science Center at Houston |