
|
|||||
|
 | |
| |
| |
| |
| |
| |
|
Gene: SNF8 |
Gene summary for SNF8 |
| Gene information | Species | Human | Gene symbol | SNF8 | Gene ID | 11267 |
| Gene name | SNF8 subunit of ESCRT-II | |
| Gene Alias | Dot3 | |
| Cytomap | 17q21.32 | |
| Gene Type | protein-coding | GO ID | GO:0006139 | UniProtAcc | Q96H20 |
Top |
Malignant transformation analysis |
| Identification of the aberrant gene expression in precancerous and cancerous lesions by comparing the gene expression of stem-like cells in diseased tissues with normal stem cells |
| Entrez ID | Symbol | Replicates | Species | Organ | Tissue | Adj P-value | Log2FC | Malignancy |
| 11267 | SNF8 | HTA11_2487_2000001011 | Human | Colorectum | SER | 2.00e-04 | 2.58e-01 | -0.1808 |
| 11267 | SNF8 | HTA11_1938_2000001011 | Human | Colorectum | AD | 3.39e-03 | 2.58e-01 | -0.0811 |
| 11267 | SNF8 | HTA11_347_2000001011 | Human | Colorectum | AD | 1.48e-14 | 3.75e-01 | -0.1954 |
| 11267 | SNF8 | HTA11_3361_2000001011 | Human | Colorectum | AD | 3.95e-06 | 3.58e-01 | -0.1207 |
| 11267 | SNF8 | HTA11_696_2000001011 | Human | Colorectum | AD | 7.08e-15 | 5.25e-01 | -0.1464 |
| 11267 | SNF8 | HTA11_866_2000001011 | Human | Colorectum | AD | 2.71e-06 | 2.50e-01 | -0.1001 |
| 11267 | SNF8 | HTA11_1391_2000001011 | Human | Colorectum | AD | 2.27e-08 | 3.50e-01 | -0.059 |
| 11267 | SNF8 | HTA11_2992_2000001011 | Human | Colorectum | SER | 1.15e-10 | 5.87e-01 | -0.1706 |
| 11267 | SNF8 | HTA11_546_2000001011 | Human | Colorectum | AD | 4.55e-02 | 2.98e-01 | -0.0842 |
| 11267 | SNF8 | HTA11_866_3004761011 | Human | Colorectum | AD | 7.22e-04 | 2.32e-01 | 0.096 |
| 11267 | SNF8 | HTA11_10623_2000001011 | Human | Colorectum | AD | 5.47e-08 | 4.92e-01 | -0.0177 |
| 11267 | SNF8 | HTA11_6801_2000001011 | Human | Colorectum | SER | 9.50e-04 | 6.37e-01 | 0.0171 |
| 11267 | SNF8 | HTA11_7696_3000711011 | Human | Colorectum | AD | 6.20e-08 | 3.07e-01 | 0.0674 |
| 11267 | SNF8 | HTA11_6818_2000001021 | Human | Colorectum | AD | 3.86e-06 | 3.45e-01 | 0.0588 |
| 11267 | SNF8 | HTA11_99999971662_82457 | Human | Colorectum | MSS | 1.00e-07 | 3.70e-01 | 0.3859 |
| 11267 | SNF8 | HTA11_99999974143_84620 | Human | Colorectum | MSS | 1.37e-12 | 4.23e-01 | 0.3005 |
| 11267 | SNF8 | LZE4T | Human | Esophagus | ESCC | 2.38e-04 | 1.29e-01 | 0.0811 |
| 11267 | SNF8 | LZE5T | Human | Esophagus | ESCC | 8.22e-07 | 4.61e-01 | 0.0514 |
| 11267 | SNF8 | LZE7T | Human | Esophagus | ESCC | 9.94e-11 | 5.92e-01 | 0.0667 |
| 11267 | SNF8 | LZE8T | Human | Esophagus | ESCC | 3.85e-10 | 1.79e-01 | 0.067 |
| Page: 1 2 3 4 5 6 7 8 |
| Tissue | Expression Dynamics | Abbreviation |
| Colorectum (GSE201348) |  | FAP: Familial adenomatous polyposis |
| CRC: Colorectal cancer | ||
| Colorectum (HTA11) | 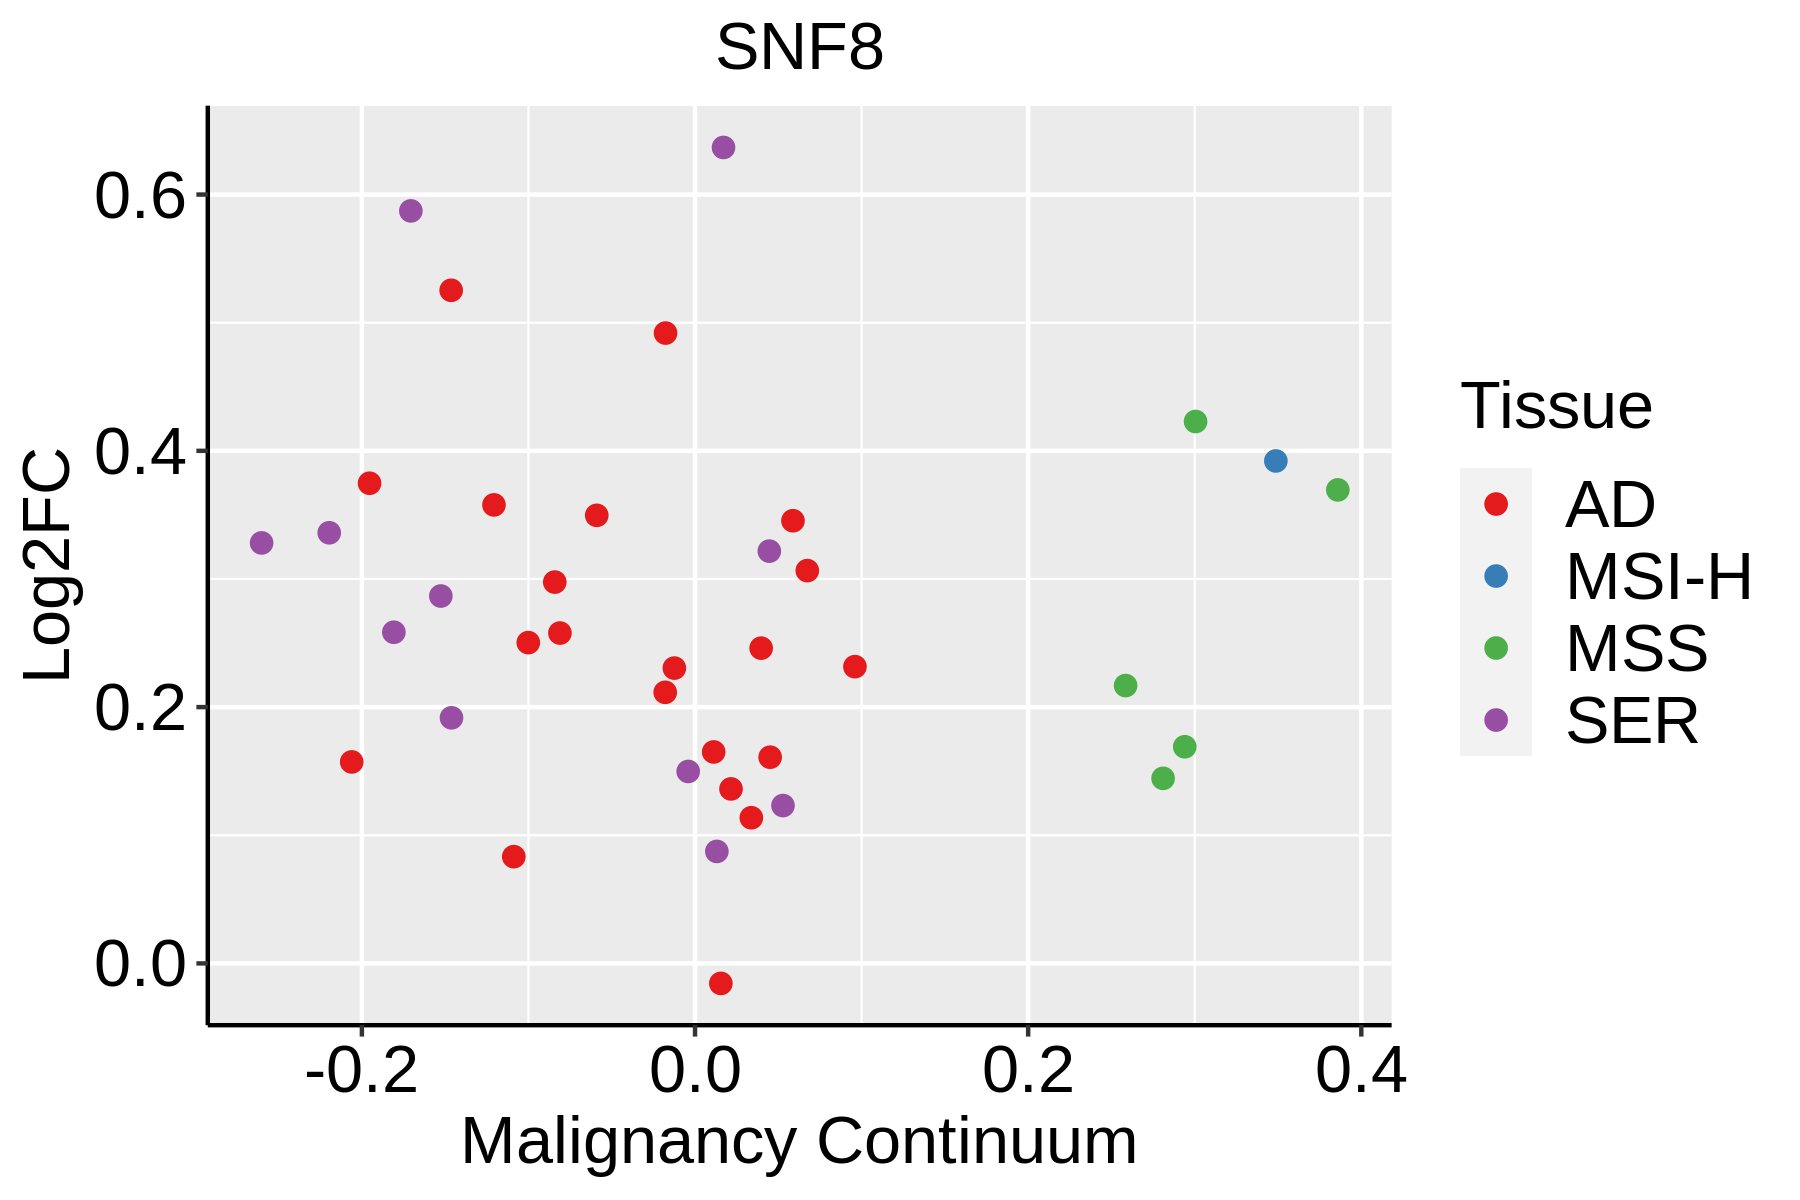 | AD: Adenomas |
| SER: Sessile serrated lesions | ||
| MSI-H: Microsatellite-high colorectal cancer | ||
| MSS: Microsatellite stable colorectal cancer | ||
| Esophagus | 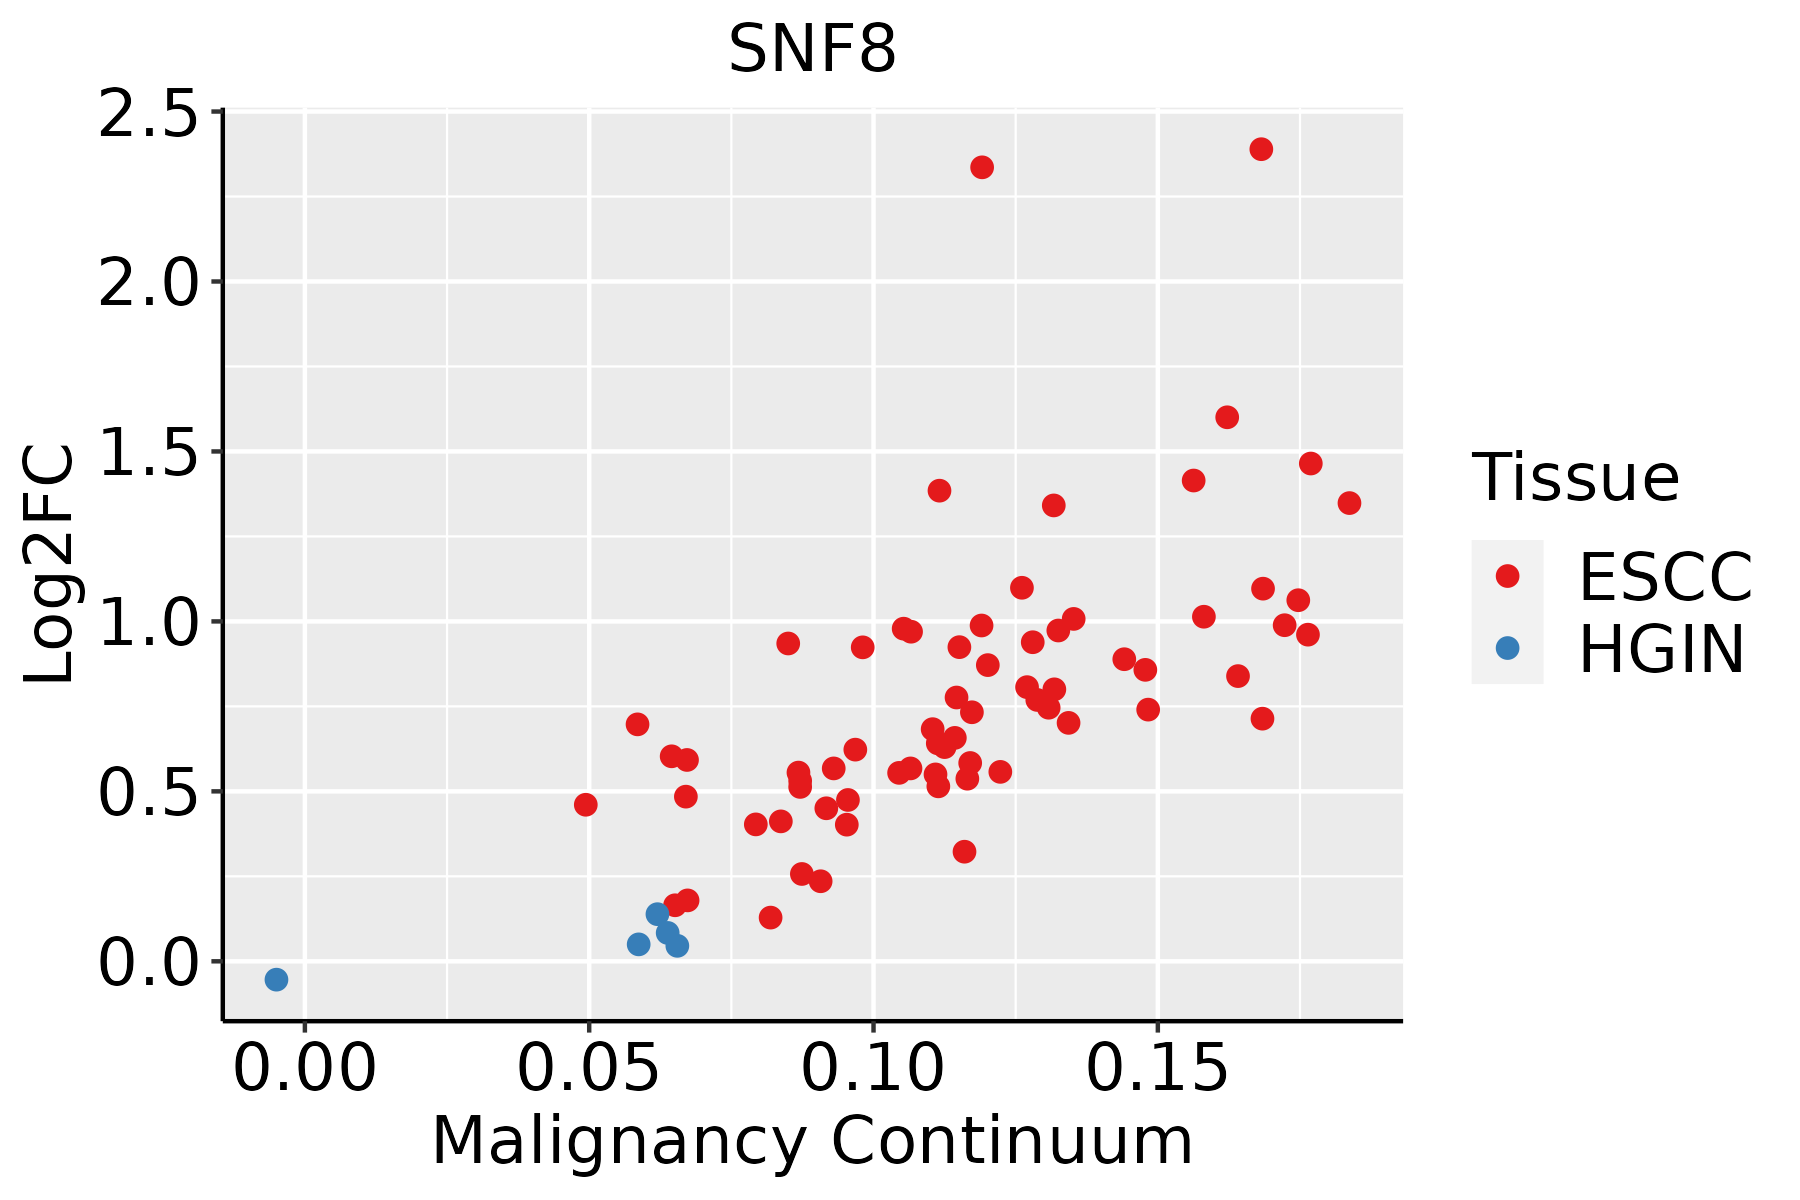 | ESCC: Esophageal squamous cell carcinoma |
| HGIN: High-grade intraepithelial neoplasias | ||
| LGIN: Low-grade intraepithelial neoplasias | ||
| Liver | 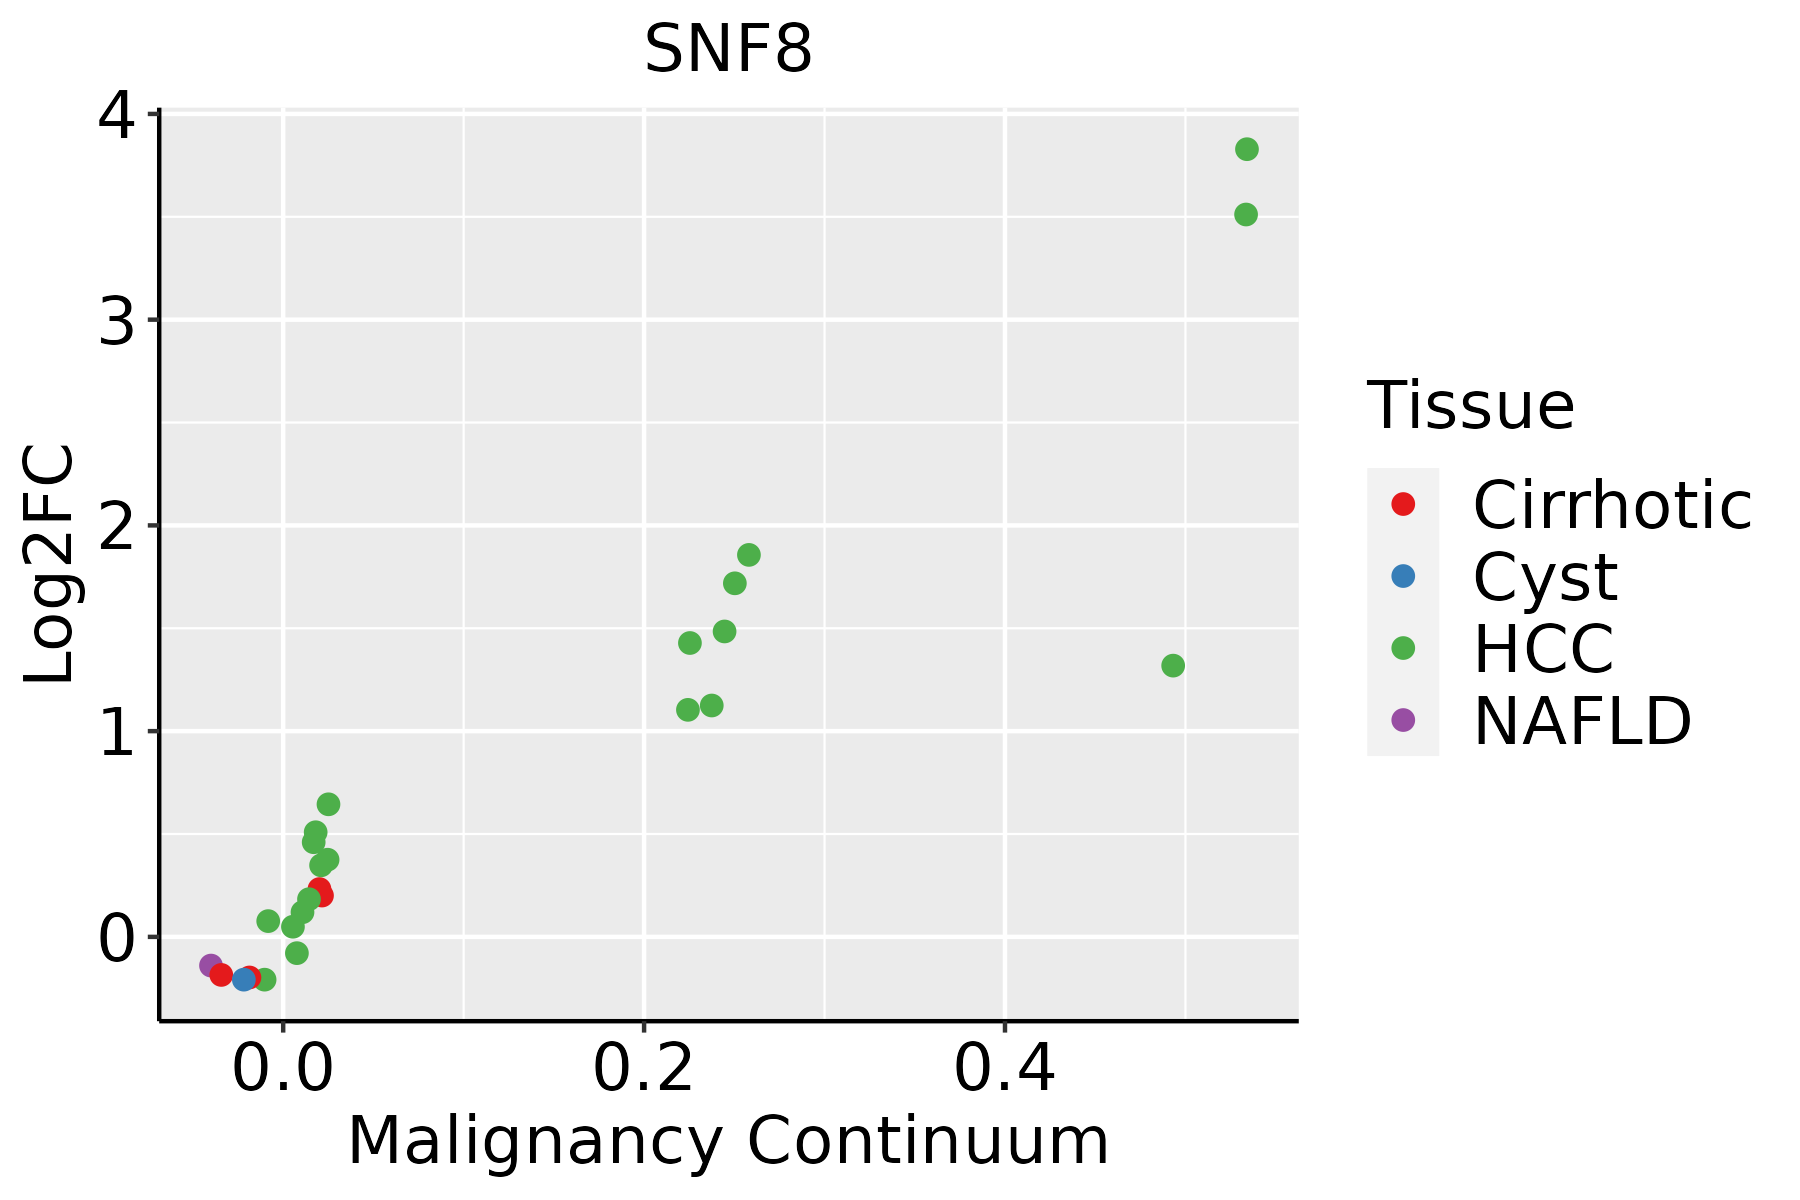 | HCC: Hepatocellular carcinoma |
| NAFLD: Non-alcoholic fatty liver disease | ||
| Oral Cavity | 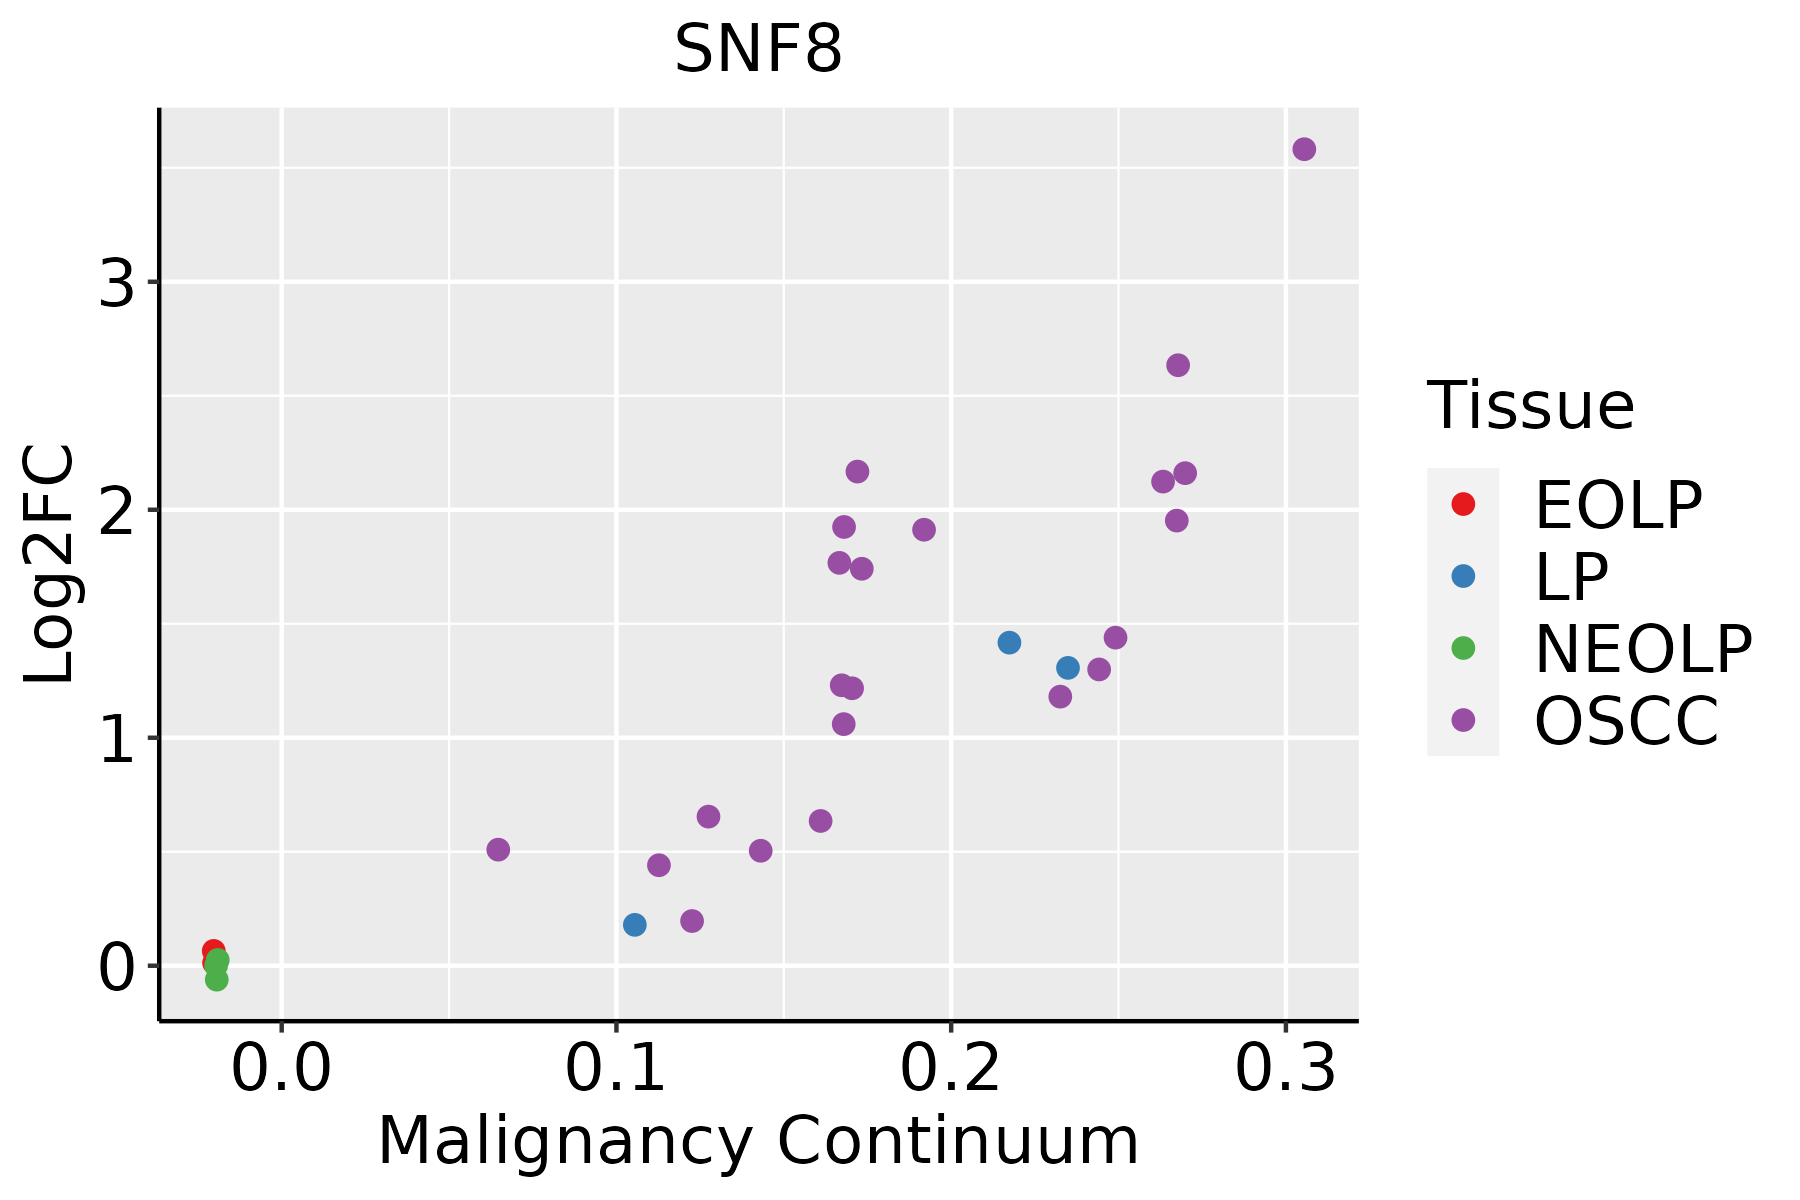 | EOLP: Erosive Oral lichen planus |
| LP: leukoplakia | ||
| NEOLP: Non-erosive oral lichen planus | ||
| OSCC: Oral squamous cell carcinoma | ||
| Prostate | 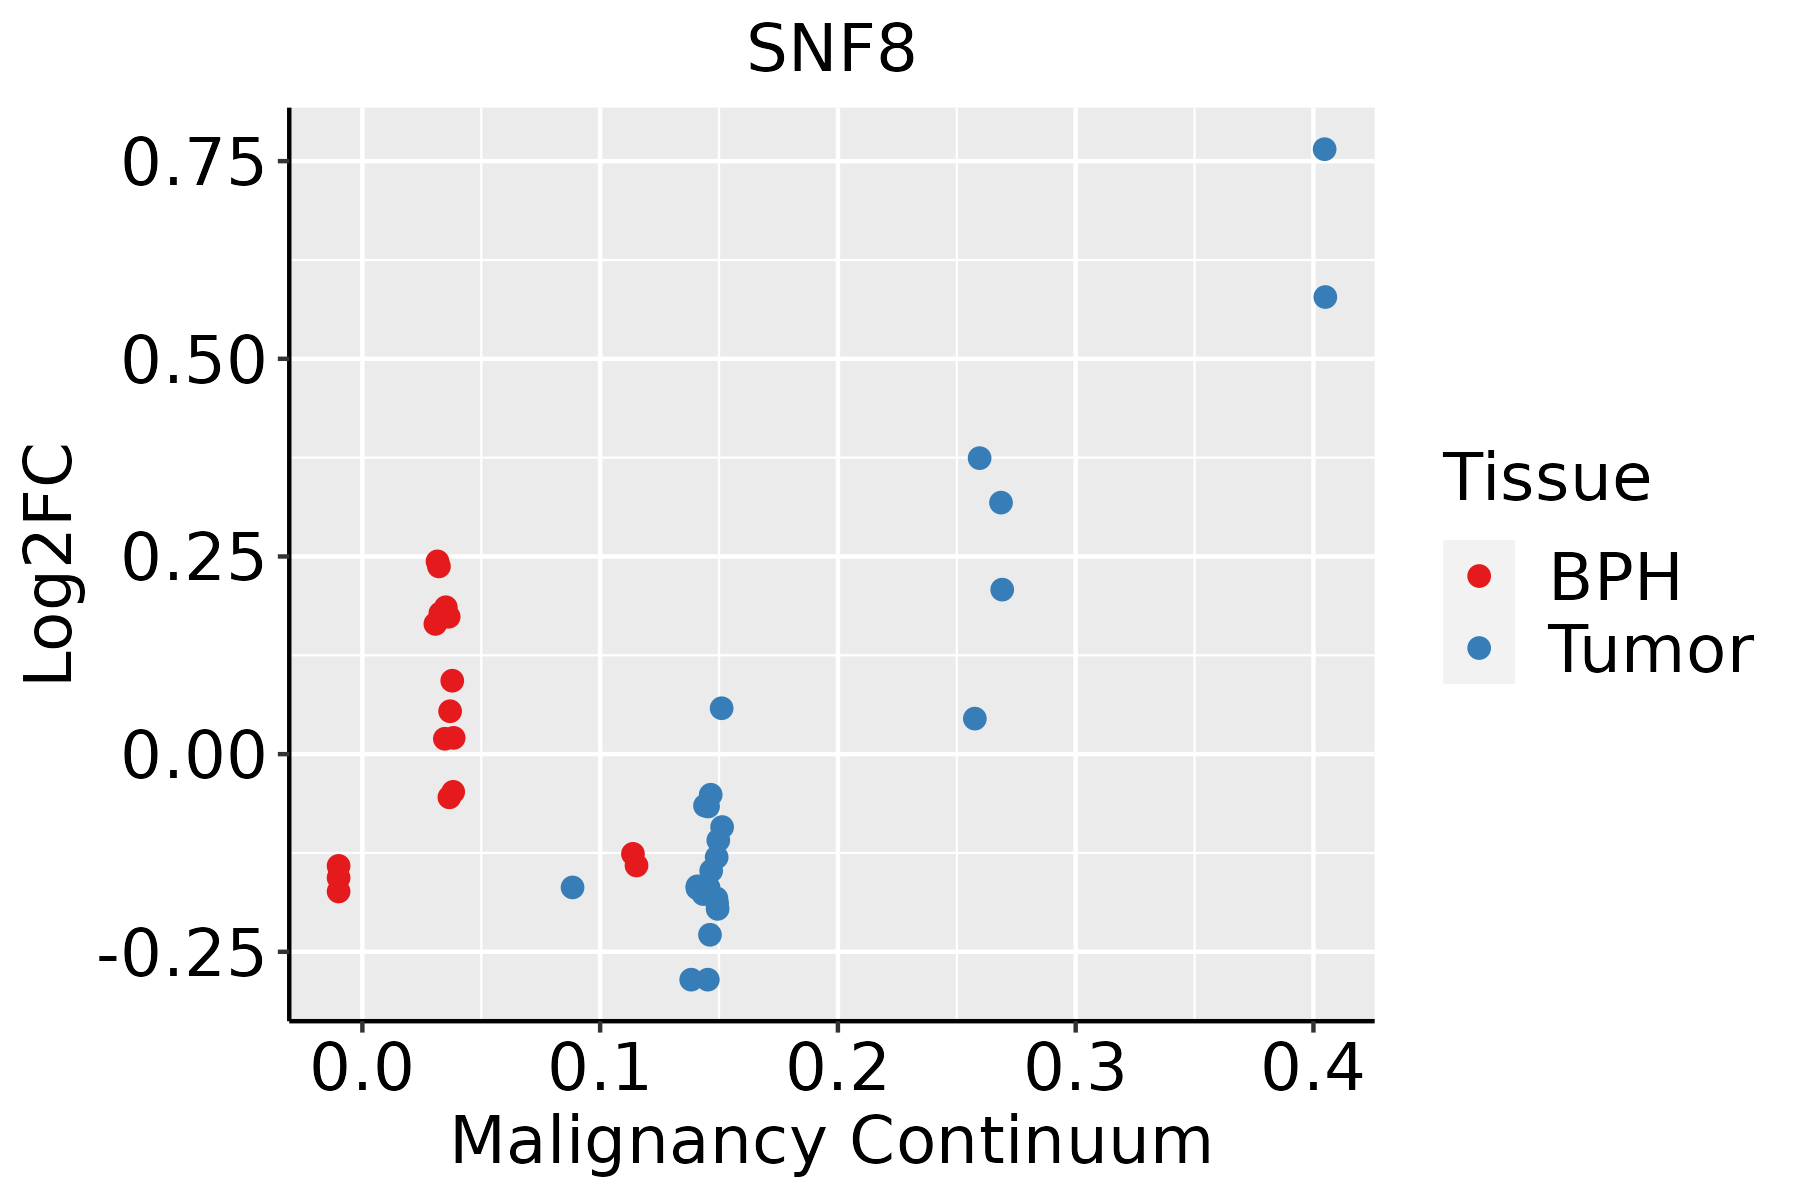 | BPH: Benign Prostatic Hyperplasia |
| Skin |  | AK: Actinic keratosis |
| cSCC: Cutaneous squamous cell carcinoma | ||
| SCCIS:squamous cell carcinoma in situ | ||
| Thyroid | 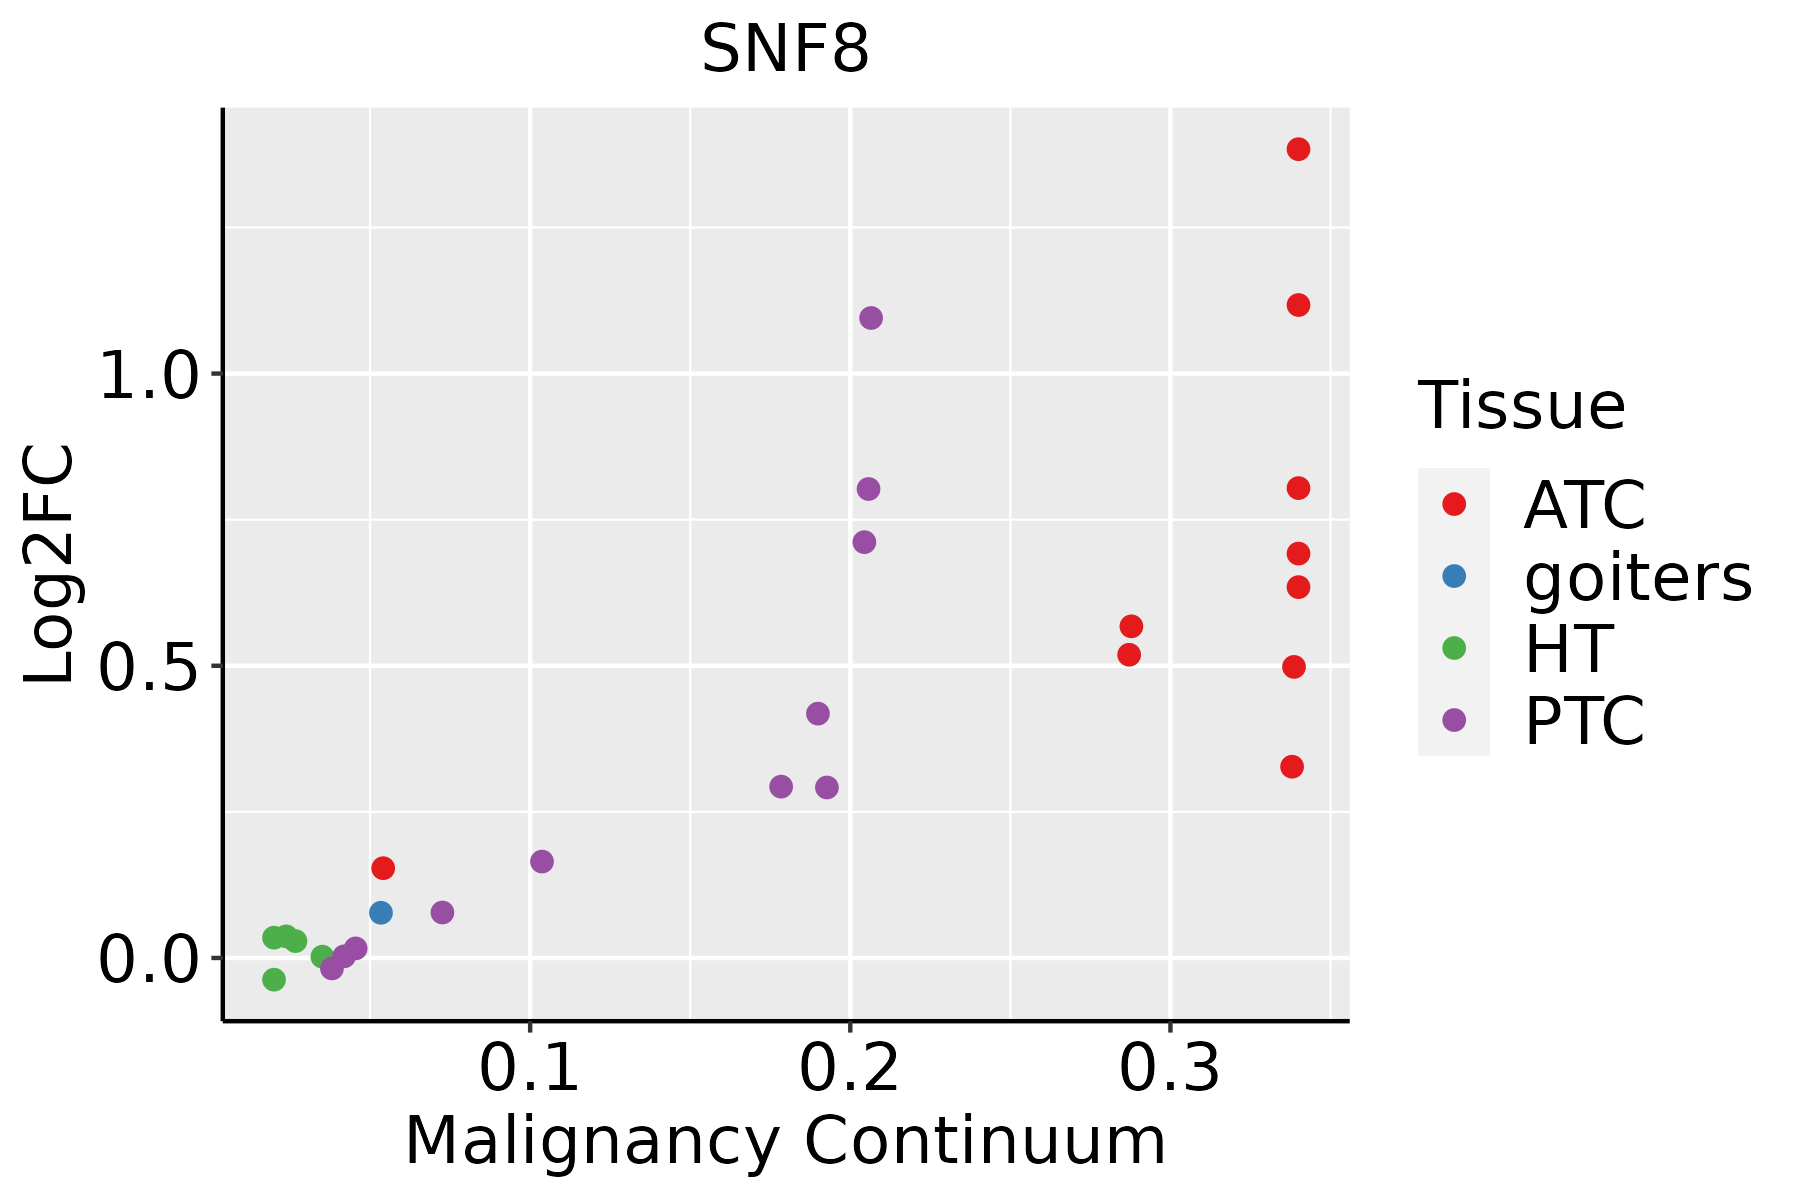 | ATC: Anaplastic thyroid cancer |
| HT: Hashimoto's thyroiditis | ||
| PTC: Papillary thyroid cancer |
| ∗log2FC in expression of this searched gene in stem-like cells from each diseased tissue sample relative to stem-like cells in normal samples in each tissue plotted against the malignancy continuum. Samples are colored based on if they are from different disease stage. |
Top |
Malignant transformation related pathway analysis |
| Find out the enriched GO biological processes and KEGG pathways involved in transition from healthy to precancer to cancer |
| Tissue | Disease Stage | Enriched GO biological Processes |
| Colorectum | AD |  |
| Colorectum | SER |  |
| Colorectum | MSS |  |
| Colorectum | MSI-H |  |
| Colorectum | FAP |  |
| ∗Top 15 enriched GO BP terms are showed in the bar plot of each disease state in each tissue. Each row represents a significant GO biological process which is colored according to the -log10(p.adjust). |
| Page: 1 2 3 4 5 6 7 8 9 |
| GO ID | Tissue | Disease Stage | Description | Gene Ratio | Bg Ratio | pvalue | p.adjust | Count |
| GO:00989271 | Colorectum | SER | vesicle-mediated transport between endosomal compartments | 16/2897 | 43/18723 | 4.18e-04 | 6.17e-03 | 16 |
| GO:00459211 | Colorectum | SER | positive regulation of exocytosis | 25/2897 | 86/18723 | 9.88e-04 | 1.17e-02 | 25 |
| GO:00070321 | Colorectum | SER | endosome organization | 24/2897 | 82/18723 | 1.11e-03 | 1.28e-02 | 24 |
| GO:00190681 | Colorectum | SER | virion assembly | 13/2897 | 35/18723 | 1.46e-03 | 1.58e-02 | 13 |
| GO:00450221 | Colorectum | SER | early endosome to late endosome transport | 14/2897 | 40/18723 | 1.88e-03 | 1.90e-02 | 14 |
| GO:00068871 | Colorectum | SER | exocytosis | 75/2897 | 352/18723 | 2.05e-03 | 2.03e-02 | 75 |
| GO:0045324 | Colorectum | SER | late endosome to vacuole transport | 10/2897 | 25/18723 | 2.70e-03 | 2.44e-02 | 10 |
| GO:00726651 | Colorectum | SER | protein localization to vacuole | 19/2897 | 67/18723 | 5.14e-03 | 3.93e-02 | 19 |
| GO:00510471 | Colorectum | SER | positive regulation of secretion | 65/2897 | 310/18723 | 5.71e-03 | 4.19e-02 | 65 |
| GO:00171571 | Colorectum | SER | regulation of exocytosis | 45/2897 | 202/18723 | 6.46e-03 | 4.63e-02 | 45 |
| GO:00160322 | Colorectum | MSS | viral process | 157/3467 | 415/18723 | 7.94e-21 | 6.19e-18 | 157 |
| GO:00421762 | Colorectum | MSS | regulation of protein catabolic process | 145/3467 | 391/18723 | 2.03e-18 | 1.17e-15 | 145 |
| GO:00098962 | Colorectum | MSS | positive regulation of catabolic process | 163/3467 | 492/18723 | 3.10e-15 | 9.22e-13 | 163 |
| GO:00725942 | Colorectum | MSS | establishment of protein localization to organelle | 139/3467 | 422/18723 | 5.75e-13 | 1.12e-10 | 139 |
| GO:00190582 | Colorectum | MSS | viral life cycle | 111/3467 | 317/18723 | 1.65e-12 | 2.95e-10 | 111 |
| GO:00457322 | Colorectum | MSS | positive regulation of protein catabolic process | 85/3467 | 231/18723 | 3.66e-11 | 4.57e-09 | 85 |
| GO:00988762 | Colorectum | MSS | vesicle-mediated transport to the plasma membrane | 54/3467 | 136/18723 | 6.20e-09 | 3.95e-07 | 54 |
| GO:00161972 | Colorectum | MSS | endosomal transport | 79/3467 | 230/18723 | 7.04e-09 | 4.39e-07 | 79 |
| GO:00162362 | Colorectum | MSS | macroautophagy | 93/3467 | 291/18723 | 2.08e-08 | 1.17e-06 | 93 |
| GO:00160502 | Colorectum | MSS | vesicle organization | 93/3467 | 300/18723 | 1.04e-07 | 4.97e-06 | 93 |
| Page: 1 2 3 4 5 6 7 8 9 10 11 12 13 14 15 16 17 18 19 20 21 22 |
| Pathway ID | Tissue | Disease Stage | Description | Gene Ratio | Bg Ratio | pvalue | p.adjust | qvalue | Count |
| hsa04144 | Colorectum | AD | Endocytosis | 111/2092 | 251/8465 | 5.95e-12 | 1.42e-10 | 9.08e-11 | 111 |
| hsa041441 | Colorectum | AD | Endocytosis | 111/2092 | 251/8465 | 5.95e-12 | 1.42e-10 | 9.08e-11 | 111 |
| hsa041442 | Colorectum | SER | Endocytosis | 81/1580 | 251/8465 | 1.14e-07 | 2.36e-06 | 1.71e-06 | 81 |
| hsa041443 | Colorectum | SER | Endocytosis | 81/1580 | 251/8465 | 1.14e-07 | 2.36e-06 | 1.71e-06 | 81 |
| hsa041444 | Colorectum | MSS | Endocytosis | 102/1875 | 251/8465 | 1.85e-11 | 4.43e-10 | 2.71e-10 | 102 |
| hsa041445 | Colorectum | MSS | Endocytosis | 102/1875 | 251/8465 | 1.85e-11 | 4.43e-10 | 2.71e-10 | 102 |
| hsa04144210 | Esophagus | ESCC | Endocytosis | 186/4205 | 251/8465 | 9.74e-16 | 4.66e-14 | 2.39e-14 | 186 |
| hsa0414437 | Esophagus | ESCC | Endocytosis | 186/4205 | 251/8465 | 9.74e-16 | 4.66e-14 | 2.39e-14 | 186 |
| hsa0414412 | Liver | Cirrhotic | Endocytosis | 119/2530 | 251/8465 | 2.33e-09 | 4.56e-08 | 2.81e-08 | 119 |
| hsa0414413 | Liver | Cirrhotic | Endocytosis | 119/2530 | 251/8465 | 2.33e-09 | 4.56e-08 | 2.81e-08 | 119 |
| hsa0414422 | Liver | HCC | Endocytosis | 178/4020 | 251/8465 | 2.03e-14 | 5.22e-13 | 2.91e-13 | 178 |
| hsa0414432 | Liver | HCC | Endocytosis | 178/4020 | 251/8465 | 2.03e-14 | 5.22e-13 | 2.91e-13 | 178 |
| hsa0414427 | Oral cavity | OSCC | Endocytosis | 174/3704 | 251/8465 | 9.42e-17 | 4.51e-15 | 2.29e-15 | 174 |
| hsa04144112 | Oral cavity | OSCC | Endocytosis | 174/3704 | 251/8465 | 9.42e-17 | 4.51e-15 | 2.29e-15 | 174 |
| hsa0414428 | Oral cavity | LP | Endocytosis | 121/2418 | 251/8465 | 1.89e-11 | 3.70e-10 | 2.38e-10 | 121 |
| hsa0414436 | Oral cavity | LP | Endocytosis | 121/2418 | 251/8465 | 1.89e-11 | 3.70e-10 | 2.38e-10 | 121 |
| hsa0414425 | Prostate | BPH | Endocytosis | 89/1718 | 251/8465 | 1.06e-08 | 1.29e-07 | 7.99e-08 | 89 |
| hsa04144111 | Prostate | BPH | Endocytosis | 89/1718 | 251/8465 | 1.06e-08 | 1.29e-07 | 7.99e-08 | 89 |
| hsa0414426 | Prostate | Tumor | Endocytosis | 92/1791 | 251/8465 | 7.83e-09 | 1.04e-07 | 6.43e-08 | 92 |
| hsa0414435 | Prostate | Tumor | Endocytosis | 92/1791 | 251/8465 | 7.83e-09 | 1.04e-07 | 6.43e-08 | 92 |
| Page: 1 |
Top |
Cell-cell communication analysis |
| Identification of potential cell-cell interactions between two cell types and their ligand-receptor pairs for different disease states |
| Ligand | Receptor | LRpair | Pathway | Tissue | Disease Stage |
| Page: 1 |
Top |
Single-cell gene regulatory network inference analysis |
| Find out the significant the regulons (TFs) and the target genes of each regulon across cell types for different disease states |
| TF | Cell Type | Tissue | Disease Stage | Target Gene | RSS | Regulon Activity |
| ∗The dot plots of a searched regulon are shown for all cell subpopulations in each disease state of each tissue based on the regulon specific score inferred using pySCENIC and by calculating the average expression. |
| Page: 1 |
Top |
Somatic mutation of malignant transformation related genes |
| Annotation of somatic variants for genes involved in malignant transformation |
| Hugo Symbol | Variant Class | Variant Classification | dbSNP RS | HGVSc | HGVSp | HGVSp Short | SWISSPROT | BIOTYPE | SIFT | PolyPhen | Tumor Sample Barcode | Tissue | Histology | Sex | Age | Stage | Therapy Types | Drugs | Outcome |
| SNF8 | SNV | Missense_Mutation | c.52N>C | p.Glu18Gln | p.E18Q | Q96H20 | protein_coding | tolerated(1) | benign(0.084) | TCGA-A8-A06Q-01 | Breast | breast invasive carcinoma | Female | <65 | III/IV | Unknown | Unknown | SD | |
| SNF8 | SNV | Missense_Mutation | c.171N>C | p.Glu57Asp | p.E57D | Q96H20 | protein_coding | tolerated(0.87) | benign(0.005) | TCGA-AC-A23H-01 | Breast | breast invasive carcinoma | Female | >=65 | I/II | Unknown | Unknown | PD | |
| SNF8 | SNV | Missense_Mutation | c.39N>T | p.Lys13Asn | p.K13N | Q96H20 | protein_coding | tolerated(0.3) | probably_damaging(0.994) | TCGA-AN-A046-01 | Breast | breast invasive carcinoma | Female | >=65 | I/II | Unknown | Unknown | SD | |
| SNF8 | SNV | Missense_Mutation | c.594N>G | p.Ile198Met | p.I198M | Q96H20 | protein_coding | deleterious(0) | possibly_damaging(0.572) | TCGA-C8-A278-01 | Breast | breast invasive carcinoma | Female | <65 | III/IV | Hormone Therapy | tamoxiphen | SD | |
| SNF8 | deletion | Frame_Shift_Del | novel | c.691delN | p.Glu231ArgfsTer95 | p.E231Rfs*95 | Q96H20 | protein_coding | TCGA-D8-A27V-01 | Breast | breast invasive carcinoma | Female | <65 | I/II | Hormone Therapy | tamoxiphen | SD | ||
| SNF8 | deletion | Frame_Shift_Del | novel | c.578delT | p.Val193GlyfsTer25 | p.V193Gfs*25 | Q96H20 | protein_coding | TCGA-EW-A2FV-01 | Breast | breast invasive carcinoma | Female | <65 | III/IV | Chemotherapy | docetaxel | SD | ||
| SNF8 | SNV | Missense_Mutation | novel | c.494N>A | p.Gly165Asp | p.G165D | Q96H20 | protein_coding | tolerated(0.08) | possibly_damaging(0.658) | TCGA-C5-A1BK-01 | Cervix | cervical & endocervical cancer | Female | <65 | I/II | Unknown | Unknown | SD |
| SNF8 | SNV | Missense_Mutation | c.295N>A | p.Glu99Lys | p.E99K | Q96H20 | protein_coding | deleterious(0) | probably_damaging(0.986) | TCGA-FU-A3HZ-01 | Cervix | cervical & endocervical cancer | Female | <65 | I/II | Chemotherapy | cisplatin | CR | |
| SNF8 | SNV | Missense_Mutation | c.350G>C | p.Gly117Ala | p.G117A | Q96H20 | protein_coding | deleterious(0) | benign(0.158) | TCGA-DM-A1D4-01 | Colorectum | colon adenocarcinoma | Male | >=65 | I/II | Unknown | Unknown | PD | |
| SNF8 | SNV | Missense_Mutation | c.170N>T | p.Glu57Val | p.E57V | Q96H20 | protein_coding | deleterious(0) | possibly_damaging(0.514) | TCGA-F5-6702-01 | Colorectum | rectum adenocarcinoma | Male | >=65 | I/II | Chemotherapy | oxaliplatin | PD |
| Page: 1 2 3 |
Top |
Related drugs of malignant transformation related genes |
| Identification of chemicals and drugs interact with genes involved in malignant transfromation |
| (DGIdb 4.0) |
| Entrez ID | Symbol | Category | Interaction Types | Drug Claim Name | Drug Name | PMIDs |
| Page: 1 |

Copyright 2023-Present -The University of Texas Health Science Center at Houston |