
|
|||||
|
 | |
| |
| |
| |
| |
| |
|
Gene: SLC25A23 |
Gene summary for SLC25A23 |
| Gene information | Species | Human | Gene symbol | SLC25A23 | Gene ID | 79085 |
| Gene name | solute carrier family 25 member 23 | |
| Gene Alias | APC2 | |
| Cytomap | 19p13.3 | |
| Gene Type | protein-coding | GO ID | GO:0002082 | UniProtAcc | Q9BV35 |
Top |
Malignant transformation analysis |
| Identification of the aberrant gene expression in precancerous and cancerous lesions by comparing the gene expression of stem-like cells in diseased tissues with normal stem cells |
| Entrez ID | Symbol | Replicates | Species | Organ | Tissue | Adj P-value | Log2FC | Malignancy |
| 79085 | SLC25A23 | HTA11_3410_2000001011 | Human | Colorectum | AD | 1.10e-03 | 1.28e-01 | 0.0155 |
| 79085 | SLC25A23 | HTA11_2487_2000001011 | Human | Colorectum | SER | 8.78e-20 | 6.79e-01 | -0.1808 |
| 79085 | SLC25A23 | HTA11_1938_2000001011 | Human | Colorectum | AD | 1.81e-06 | 3.08e-01 | -0.0811 |
| 79085 | SLC25A23 | HTA11_78_2000001011 | Human | Colorectum | AD | 5.22e-05 | 3.69e-01 | -0.1088 |
| 79085 | SLC25A23 | HTA11_347_2000001011 | Human | Colorectum | AD | 5.04e-31 | 6.84e-01 | -0.1954 |
| 79085 | SLC25A23 | HTA11_411_2000001011 | Human | Colorectum | SER | 4.73e-10 | 1.42e+00 | -0.2602 |
| 79085 | SLC25A23 | HTA11_2112_2000001011 | Human | Colorectum | SER | 1.38e-13 | 8.77e-01 | -0.2196 |
| 79085 | SLC25A23 | HTA11_3361_2000001011 | Human | Colorectum | AD | 2.33e-11 | 5.35e-01 | -0.1207 |
| 79085 | SLC25A23 | HTA11_83_2000001011 | Human | Colorectum | SER | 2.35e-11 | 5.42e-01 | -0.1526 |
| 79085 | SLC25A23 | HTA11_696_2000001011 | Human | Colorectum | AD | 9.03e-24 | 7.18e-01 | -0.1464 |
| 79085 | SLC25A23 | HTA11_866_2000001011 | Human | Colorectum | AD | 4.05e-07 | 3.85e-01 | -0.1001 |
| 79085 | SLC25A23 | HTA11_1391_2000001011 | Human | Colorectum | AD | 2.27e-08 | 4.20e-01 | -0.059 |
| 79085 | SLC25A23 | HTA11_2992_2000001011 | Human | Colorectum | SER | 6.78e-11 | 7.44e-01 | -0.1706 |
| 79085 | SLC25A23 | HTA11_5212_2000001011 | Human | Colorectum | AD | 1.15e-08 | 6.43e-01 | -0.2061 |
| 79085 | SLC25A23 | HTA11_5216_2000001011 | Human | Colorectum | SER | 2.74e-06 | 6.12e-01 | -0.1462 |
| 79085 | SLC25A23 | HTA11_546_2000001011 | Human | Colorectum | AD | 5.48e-05 | 4.75e-01 | -0.0842 |
| 79085 | SLC25A23 | HTA11_6801_2000001011 | Human | Colorectum | SER | 9.29e-04 | 3.39e-01 | 0.0171 |
| 79085 | SLC25A23 | HTA11_7696_3000711011 | Human | Colorectum | AD | 2.86e-06 | 3.10e-01 | 0.0674 |
| 79085 | SLC25A23 | HTA11_99999965104_69814 | Human | Colorectum | MSS | 7.82e-07 | 3.14e-01 | 0.281 |
| 79085 | SLC25A23 | HTA11_99999971662_82457 | Human | Colorectum | MSS | 3.89e-09 | 4.23e-01 | 0.3859 |
| Page: 1 2 3 |
| Tissue | Expression Dynamics | Abbreviation |
| Colorectum (GSE201348) |  | FAP: Familial adenomatous polyposis |
| CRC: Colorectal cancer | ||
| Colorectum (HTA11) |  | AD: Adenomas |
| SER: Sessile serrated lesions | ||
| MSI-H: Microsatellite-high colorectal cancer | ||
| MSS: Microsatellite stable colorectal cancer | ||
| Liver |  | HCC: Hepatocellular carcinoma |
| NAFLD: Non-alcoholic fatty liver disease | ||
| Oral Cavity | 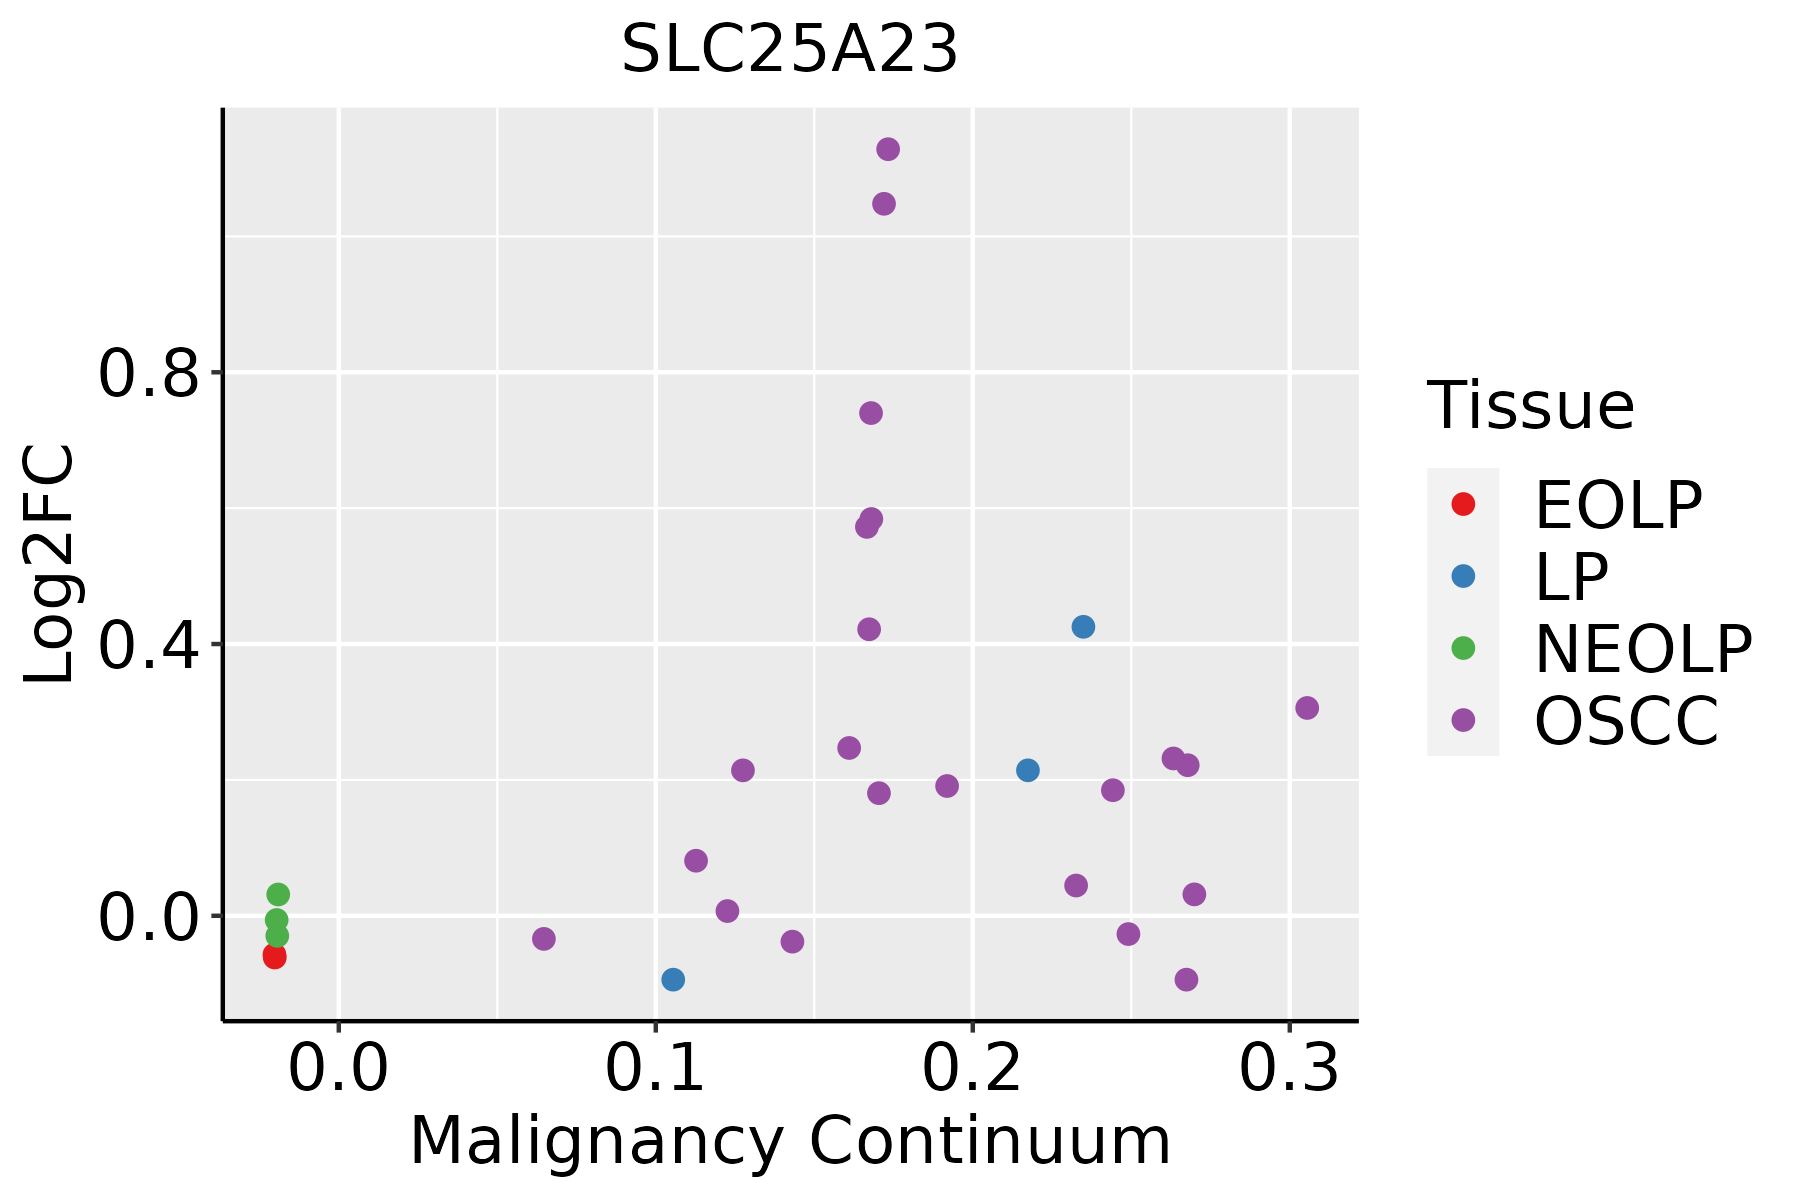 | EOLP: Erosive Oral lichen planus |
| LP: leukoplakia | ||
| NEOLP: Non-erosive oral lichen planus | ||
| OSCC: Oral squamous cell carcinoma | ||
| Thyroid | 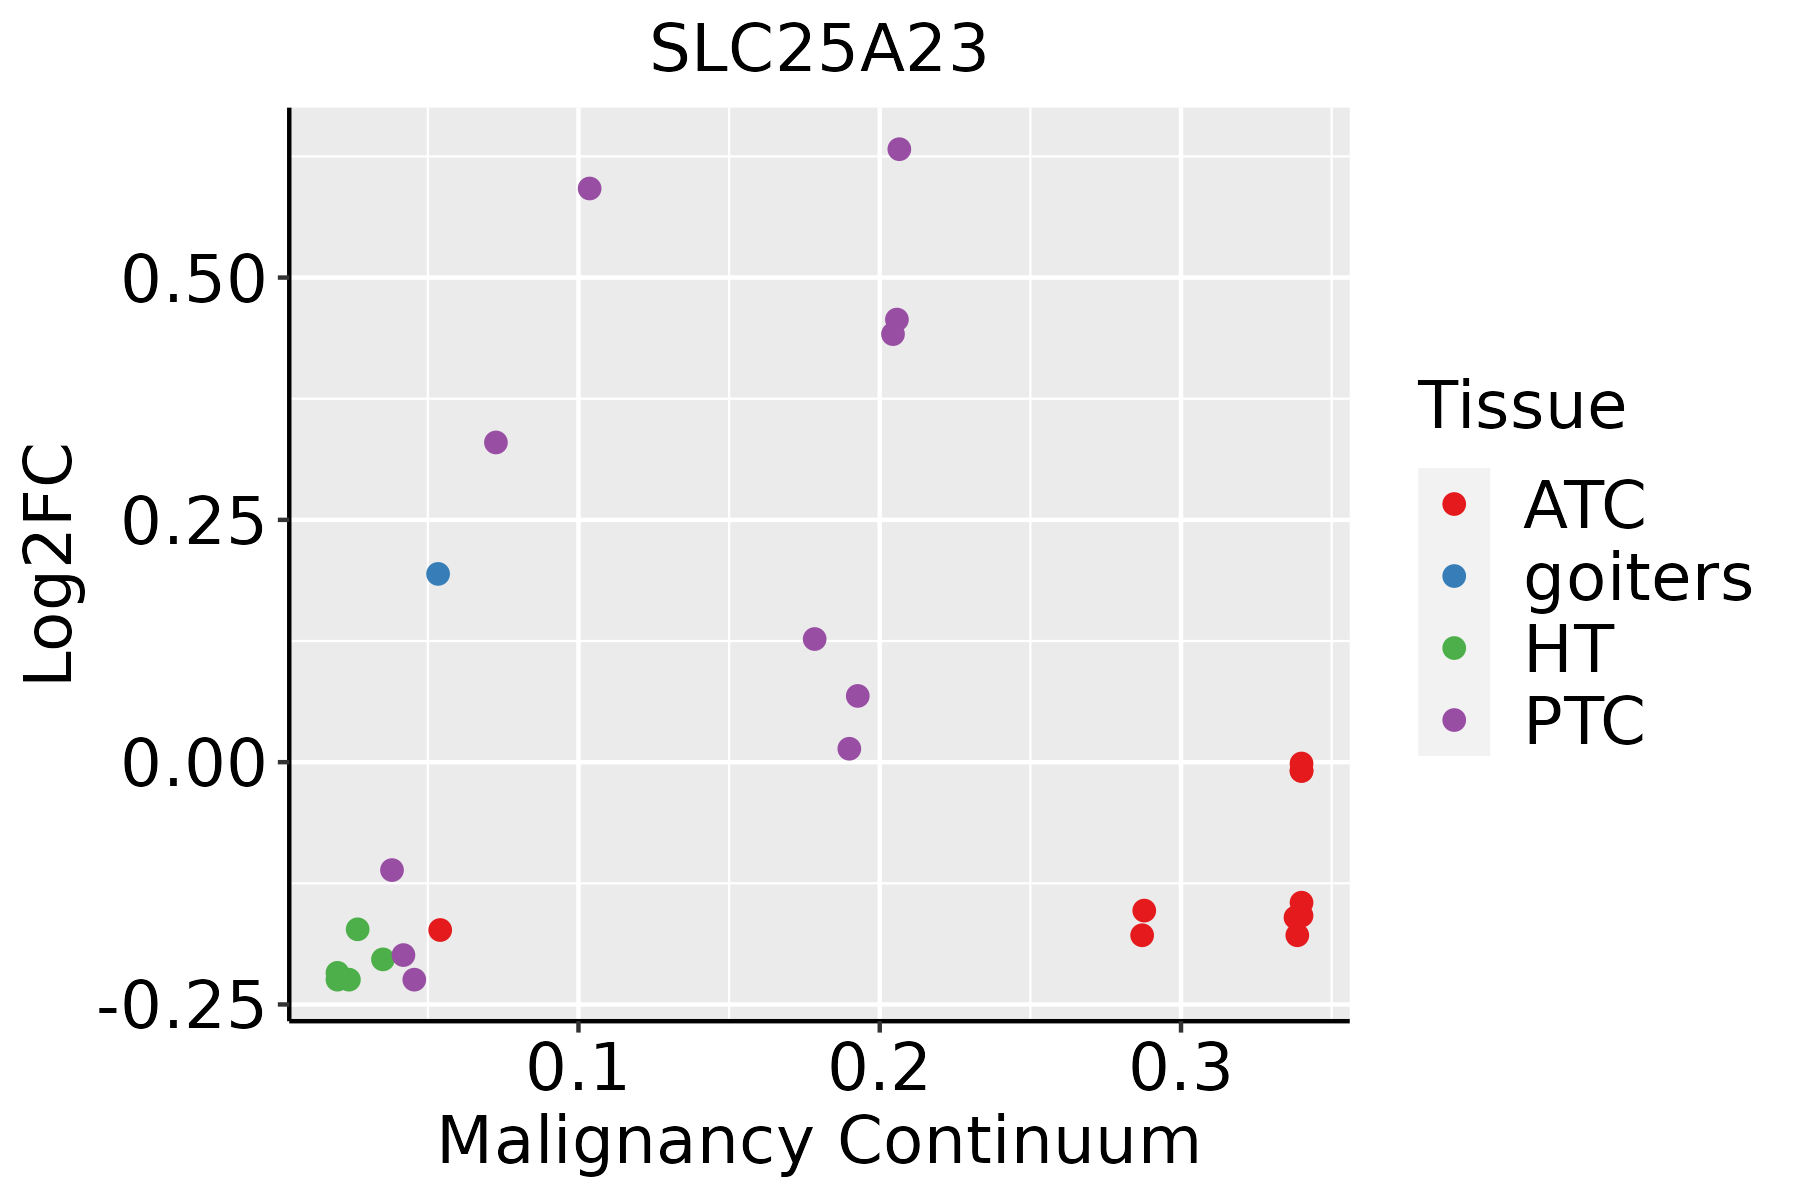 | ATC: Anaplastic thyroid cancer |
| HT: Hashimoto's thyroiditis | ||
| PTC: Papillary thyroid cancer |
| ∗log2FC in expression of this searched gene in stem-like cells from each diseased tissue sample relative to stem-like cells in normal samples in each tissue plotted against the malignancy continuum. Samples are colored based on if they are from different disease stage. |
Top |
Malignant transformation related pathway analysis |
| Find out the enriched GO biological processes and KEGG pathways involved in transition from healthy to precancer to cancer |
| Tissue | Disease Stage | Enriched GO biological Processes |
| Colorectum | AD |  |
| Colorectum | SER |  |
| Colorectum | MSS |  |
| Colorectum | MSI-H |  |
| Colorectum | FAP |  |
| ∗Top 15 enriched GO BP terms are showed in the bar plot of each disease state in each tissue. Each row represents a significant GO biological process which is colored according to the -log10(p.adjust). |
| Page: 1 2 3 4 5 6 7 8 9 |
| GO ID | Tissue | Disease Stage | Description | Gene Ratio | Bg Ratio | pvalue | p.adjust | Count |
| GO:00434572 | Colorectum | MSS | regulation of cellular respiration | 19/3467 | 49/18723 | 7.20e-04 | 7.70e-03 | 19 |
| GO:00515602 | Colorectum | MSS | mitochondrial calcium ion homeostasis | 12/3467 | 26/18723 | 1.16e-03 | 1.12e-02 | 12 |
| GO:00068512 | Colorectum | MSS | mitochondrial calcium ion transmembrane transport | 10/3467 | 20/18723 | 1.40e-03 | 1.32e-02 | 10 |
| GO:00364442 | Colorectum | MSS | calcium import into the mitochondrion | 8/3467 | 14/18723 | 1.42e-03 | 1.32e-02 | 8 |
| GO:00516512 | Colorectum | MSS | maintenance of location in cell | 57/3467 | 214/18723 | 2.07e-03 | 1.76e-02 | 57 |
| GO:00100382 | Colorectum | MSS | response to metal ion | 90/3467 | 373/18723 | 3.76e-03 | 2.76e-02 | 90 |
| GO:0002082 | Colorectum | MSS | regulation of oxidative phosphorylation | 10/3467 | 23/18723 | 5.06e-03 | 3.47e-02 | 10 |
| GO:00712412 | Colorectum | MSS | cellular response to inorganic substance | 57/3467 | 226/18723 | 7.27e-03 | 4.64e-02 | 57 |
| GO:00515611 | Colorectum | MSS | positive regulation of mitochondrial calcium ion concentration | 6/3467 | 11/18723 | 7.89e-03 | 4.84e-02 | 6 |
| GO:00460344 | Colorectum | FAP | ATP metabolic process | 87/2622 | 277/18723 | 6.50e-14 | 6.63e-11 | 87 |
| GO:00060914 | Colorectum | FAP | generation of precursor metabolites and energy | 128/2622 | 490/18723 | 5.58e-13 | 4.28e-10 | 128 |
| GO:00159804 | Colorectum | FAP | energy derivation by oxidation of organic compounds | 85/2622 | 318/18723 | 1.36e-09 | 2.77e-07 | 85 |
| GO:00090604 | Colorectum | FAP | aerobic respiration | 57/2622 | 189/18723 | 7.02e-09 | 1.02e-06 | 57 |
| GO:00453334 | Colorectum | FAP | cellular respiration | 65/2622 | 230/18723 | 1.13e-08 | 1.33e-06 | 65 |
| GO:00621974 | Colorectum | FAP | cellular response to chemical stress | 83/2622 | 337/18723 | 1.15e-07 | 7.43e-06 | 83 |
| GO:00061194 | Colorectum | FAP | oxidative phosphorylation | 43/2622 | 141/18723 | 3.39e-07 | 1.86e-05 | 43 |
| GO:19035784 | Colorectum | FAP | regulation of ATP metabolic process | 26/2622 | 87/18723 | 9.84e-05 | 1.66e-03 | 26 |
| GO:19905423 | Colorectum | FAP | mitochondrial transmembrane transport | 29/2622 | 102/18723 | 1.09e-04 | 1.80e-03 | 29 |
| GO:00069701 | Colorectum | FAP | response to osmotic stress | 25/2622 | 84/18723 | 1.43e-04 | 2.24e-03 | 25 |
| GO:00434674 | Colorectum | FAP | regulation of generation of precursor metabolites and energy | 34/2622 | 130/18723 | 1.78e-04 | 2.64e-03 | 34 |
| Page: 1 2 3 4 5 6 7 8 9 10 11 12 13 14 |
| Pathway ID | Tissue | Disease Stage | Description | Gene Ratio | Bg Ratio | pvalue | p.adjust | qvalue | Count |
| Page: 1 |
Top |
Cell-cell communication analysis |
| Identification of potential cell-cell interactions between two cell types and their ligand-receptor pairs for different disease states |
| Ligand | Receptor | LRpair | Pathway | Tissue | Disease Stage |
| Page: 1 |
Top |
Single-cell gene regulatory network inference analysis |
| Find out the significant the regulons (TFs) and the target genes of each regulon across cell types for different disease states |
| TF | Cell Type | Tissue | Disease Stage | Target Gene | RSS | Regulon Activity |
| ∗The dot plots of a searched regulon are shown for all cell subpopulations in each disease state of each tissue based on the regulon specific score inferred using pySCENIC and by calculating the average expression. |
| Page: 1 |
Top |
Somatic mutation of malignant transformation related genes |
| Annotation of somatic variants for genes involved in malignant transformation |
| Hugo Symbol | Variant Class | Variant Classification | dbSNP RS | HGVSc | HGVSp | HGVSp Short | SWISSPROT | BIOTYPE | SIFT | PolyPhen | Tumor Sample Barcode | Tissue | Histology | Sex | Age | Stage | Therapy Types | Drugs | Outcome |
| SLC25A23 | SNV | Missense_Mutation | c.1178N>T | p.Ala393Val | p.A393V | Q9BV35 | protein_coding | tolerated(0.09) | possibly_damaging(0.531) | TCGA-A8-A09Z-01 | Breast | breast invasive carcinoma | Female | >=65 | I/II | Unknown | Unknown | SD | |
| SLC25A23 | SNV | Missense_Mutation | c.753N>C | p.Lys251Asn | p.K251N | Q9BV35 | protein_coding | deleterious(0) | probably_damaging(0.999) | TCGA-C5-A1MH-01 | Cervix | cervical & endocervical cancer | Female | >=65 | III/IV | Chemotherapy | cisplatin | PD | |
| SLC25A23 | SNV | Missense_Mutation | novel | c.912G>C | p.Lys304Asn | p.K304N | Q9BV35 | protein_coding | deleterious(0) | probably_damaging(0.999) | TCGA-ZJ-AAXT-01 | Cervix | cervical & endocervical cancer | Female | <65 | III/IV | Unknown | Unknown | SD |
| SLC25A23 | SNV | Missense_Mutation | novel | c.1030N>A | p.Gly344Ser | p.G344S | Q9BV35 | protein_coding | tolerated(0.09) | probably_damaging(0.913) | TCGA-AA-3872-01 | Colorectum | colon adenocarcinoma | Male | <65 | III/IV | Unknown | Unknown | SD |
| SLC25A23 | SNV | Missense_Mutation | c.1019N>A | p.Pro340His | p.P340H | Q9BV35 | protein_coding | deleterious(0) | probably_damaging(1) | TCGA-AD-6889-01 | Colorectum | colon adenocarcinoma | Male | >=65 | I/II | Chemotherapy | xeloda | PD | |
| SLC25A23 | SNV | Missense_Mutation | rs549386407 | c.272N>A | p.Arg91Gln | p.R91Q | Q9BV35 | protein_coding | deleterious(0.03) | benign(0.094) | TCGA-AZ-6598-01 | Colorectum | colon adenocarcinoma | Female | >=65 | I/II | Unknown | Unknown | SD |
| SLC25A23 | SNV | Missense_Mutation | c.721N>A | p.Leu241Met | p.L241M | Q9BV35 | protein_coding | tolerated(0.11) | possibly_damaging(0.883) | TCGA-CK-6746-01 | Colorectum | colon adenocarcinoma | Female | >=65 | I/II | Unknown | Unknown | SD | |
| SLC25A23 | SNV | Missense_Mutation | rs563978358 | c.1294N>T | p.Arg432Trp | p.R432W | Q9BV35 | protein_coding | tolerated(0.19) | benign(0) | TCGA-CM-5861-01 | Colorectum | colon adenocarcinoma | Female | <65 | I/II | Unknown | Unknown | PD |
| SLC25A23 | SNV | Missense_Mutation | rs753656506 | c.520G>A | p.Glu174Lys | p.E174K | Q9BV35 | protein_coding | deleterious(0) | probably_damaging(0.932) | TCGA-CM-6171-01 | Colorectum | colon adenocarcinoma | Female | >=65 | I/II | Unknown | Unknown | SD |
| SLC25A23 | SNV | Missense_Mutation | c.758N>T | p.Ala253Val | p.A253V | Q9BV35 | protein_coding | deleterious(0.04) | possibly_damaging(0.817) | TCGA-D5-6928-01 | Colorectum | colon adenocarcinoma | Male | >=65 | I/II | Unknown | Unknown | SD |
| Page: 1 2 3 4 5 |
Top |
Related drugs of malignant transformation related genes |
| Identification of chemicals and drugs interact with genes involved in malignant transfromation |
| (DGIdb 4.0) |
| Entrez ID | Symbol | Category | Interaction Types | Drug Claim Name | Drug Name | PMIDs |
| Page: 1 |

Copyright 2023-Present -The University of Texas Health Science Center at Houston |