
|
|||||
|
 | |
| |
| |
| |
| |
| |
|
Gene: SLC1A5 |
Gene summary for SLC1A5 |
| Gene information | Species | Human | Gene symbol | SLC1A5 | Gene ID | 6510 |
| Gene name | solute carrier family 1 member 5 | |
| Gene Alias | AAAT | |
| Cytomap | 19q13.32 | |
| Gene Type | protein-coding | GO ID | GO:0003008 | UniProtAcc | Q15758 |
Top |
Malignant transformation analysis |
| Identification of the aberrant gene expression in precancerous and cancerous lesions by comparing the gene expression of stem-like cells in diseased tissues with normal stem cells |
| Entrez ID | Symbol | Replicates | Species | Organ | Tissue | Adj P-value | Log2FC | Malignancy |
| 6510 | SLC1A5 | CA_HPV_3 | Human | Cervix | CC | 1.07e-06 | 2.60e-01 | 0.0414 |
| 6510 | SLC1A5 | Tumor | Human | Cervix | CC | 3.33e-19 | 5.47e-01 | 0.1241 |
| 6510 | SLC1A5 | sample3 | Human | Cervix | CC | 1.65e-31 | 6.44e-01 | 0.1387 |
| 6510 | SLC1A5 | T3 | Human | Cervix | CC | 1.61e-25 | 6.24e-01 | 0.1389 |
| 6510 | SLC1A5 | HTA11_3410_2000001011 | Human | Colorectum | AD | 3.42e-06 | 2.66e-01 | 0.0155 |
| 6510 | SLC1A5 | HTA11_2487_2000001011 | Human | Colorectum | SER | 1.44e-20 | 7.01e-01 | -0.1808 |
| 6510 | SLC1A5 | HTA11_1938_2000001011 | Human | Colorectum | AD | 1.44e-13 | 6.65e-01 | -0.0811 |
| 6510 | SLC1A5 | HTA11_78_2000001011 | Human | Colorectum | AD | 1.62e-05 | 3.20e-01 | -0.1088 |
| 6510 | SLC1A5 | HTA11_347_2000001011 | Human | Colorectum | AD | 6.85e-24 | 6.00e-01 | -0.1954 |
| 6510 | SLC1A5 | HTA11_411_2000001011 | Human | Colorectum | SER | 4.76e-10 | 9.88e-01 | -0.2602 |
| 6510 | SLC1A5 | HTA11_2112_2000001011 | Human | Colorectum | SER | 4.90e-08 | 8.44e-01 | -0.2196 |
| 6510 | SLC1A5 | HTA11_3361_2000001011 | Human | Colorectum | AD | 3.34e-09 | 4.44e-01 | -0.1207 |
| 6510 | SLC1A5 | HTA11_83_2000001011 | Human | Colorectum | SER | 6.76e-09 | 5.37e-01 | -0.1526 |
| 6510 | SLC1A5 | HTA11_696_2000001011 | Human | Colorectum | AD | 1.16e-36 | 8.48e-01 | -0.1464 |
| 6510 | SLC1A5 | HTA11_866_2000001011 | Human | Colorectum | AD | 2.05e-15 | 5.13e-01 | -0.1001 |
| 6510 | SLC1A5 | HTA11_1391_2000001011 | Human | Colorectum | AD | 1.45e-21 | 7.50e-01 | -0.059 |
| 6510 | SLC1A5 | HTA11_2992_2000001011 | Human | Colorectum | SER | 1.47e-05 | 5.27e-01 | -0.1706 |
| 6510 | SLC1A5 | HTA11_5212_2000001011 | Human | Colorectum | AD | 3.59e-10 | 5.27e-01 | -0.2061 |
| 6510 | SLC1A5 | HTA11_5216_2000001011 | Human | Colorectum | SER | 1.01e-05 | 5.27e-01 | -0.1462 |
| 6510 | SLC1A5 | HTA11_546_2000001011 | Human | Colorectum | AD | 1.58e-14 | 6.35e-01 | -0.0842 |
| Page: 1 2 3 4 5 6 7 8 |
| Tissue | Expression Dynamics | Abbreviation |
| Cervix | 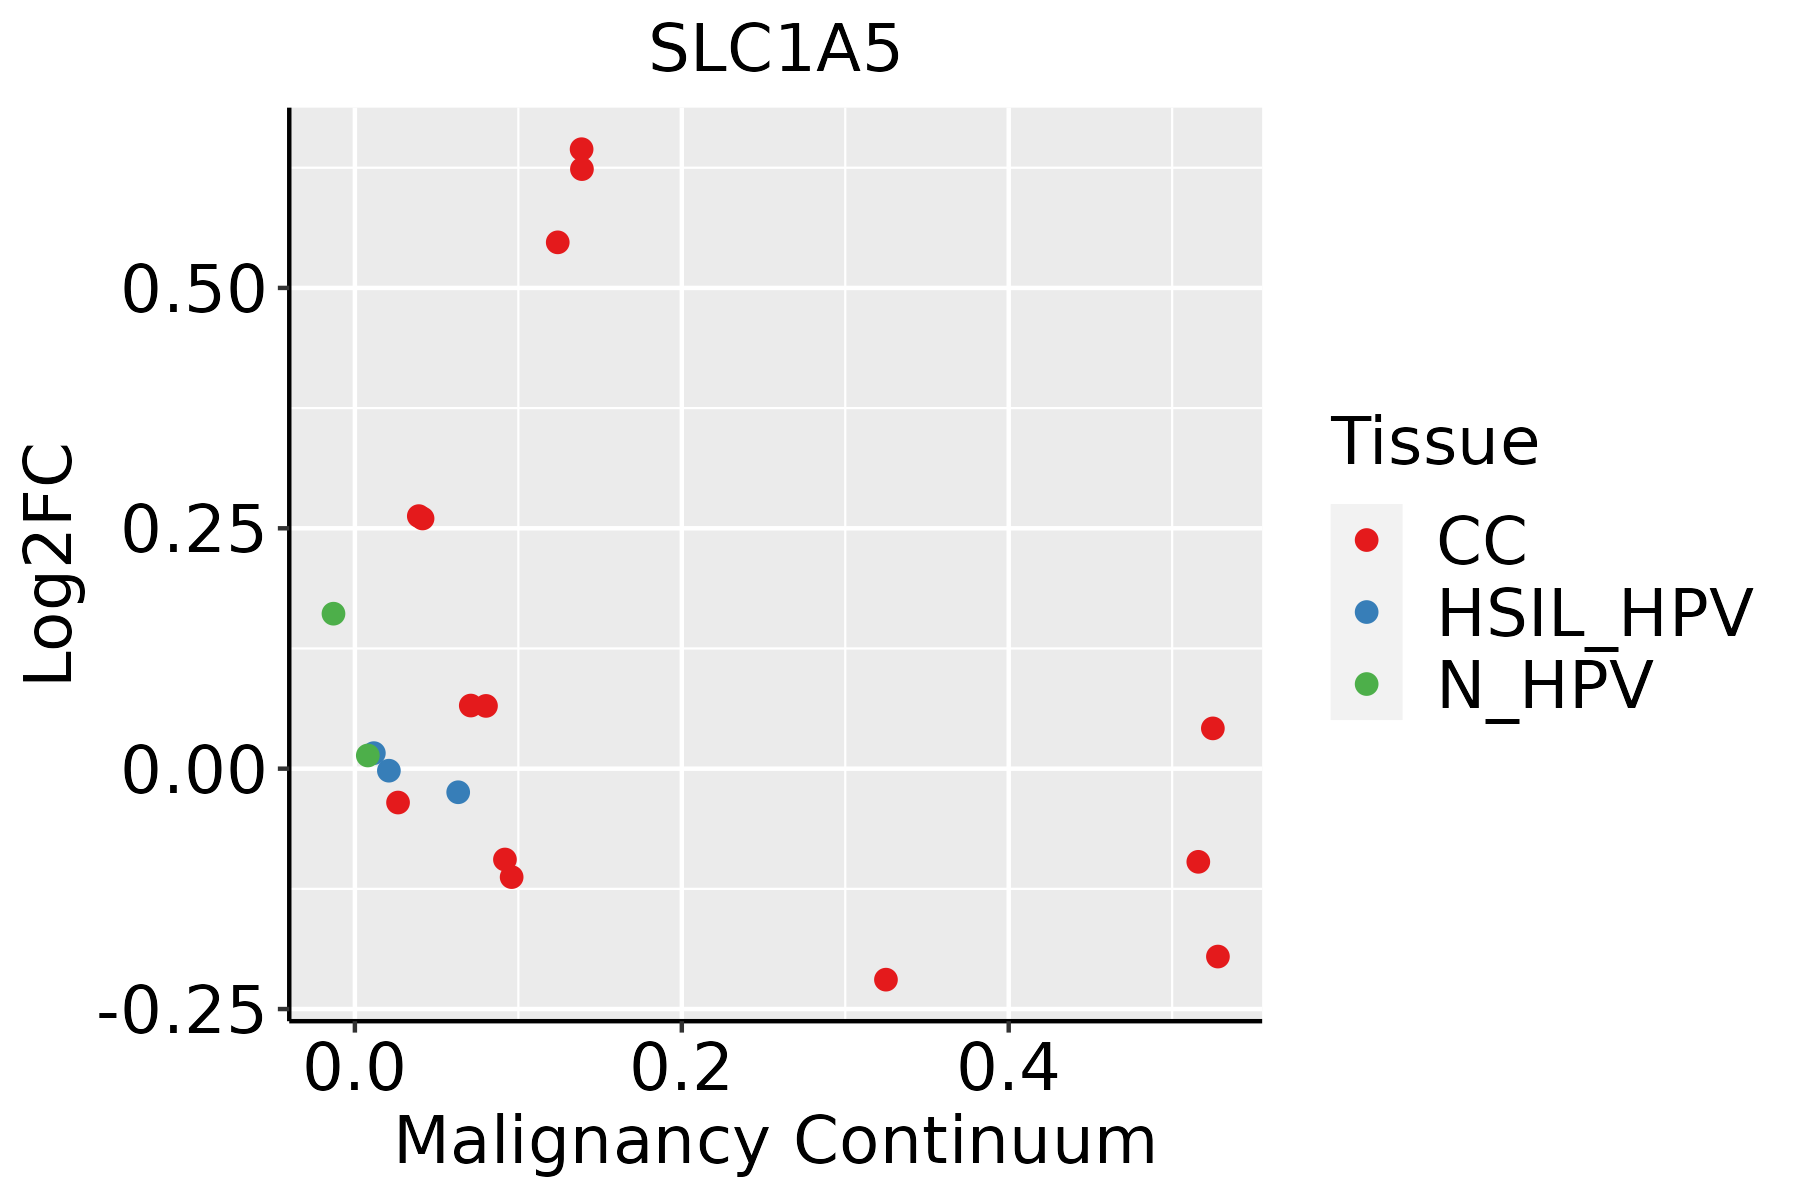 | CC: Cervix cancer |
| HSIL_HPV: HPV-infected high-grade squamous intraepithelial lesions | ||
| N_HPV: HPV-infected normal cervix | ||
| Colorectum (GSE201348) |  | FAP: Familial adenomatous polyposis |
| CRC: Colorectal cancer | ||
| Colorectum (HTA11) |  | AD: Adenomas |
| SER: Sessile serrated lesions | ||
| MSI-H: Microsatellite-high colorectal cancer | ||
| MSS: Microsatellite stable colorectal cancer | ||
| Esophagus |  | ESCC: Esophageal squamous cell carcinoma |
| HGIN: High-grade intraepithelial neoplasias | ||
| LGIN: Low-grade intraepithelial neoplasias | ||
| Liver | 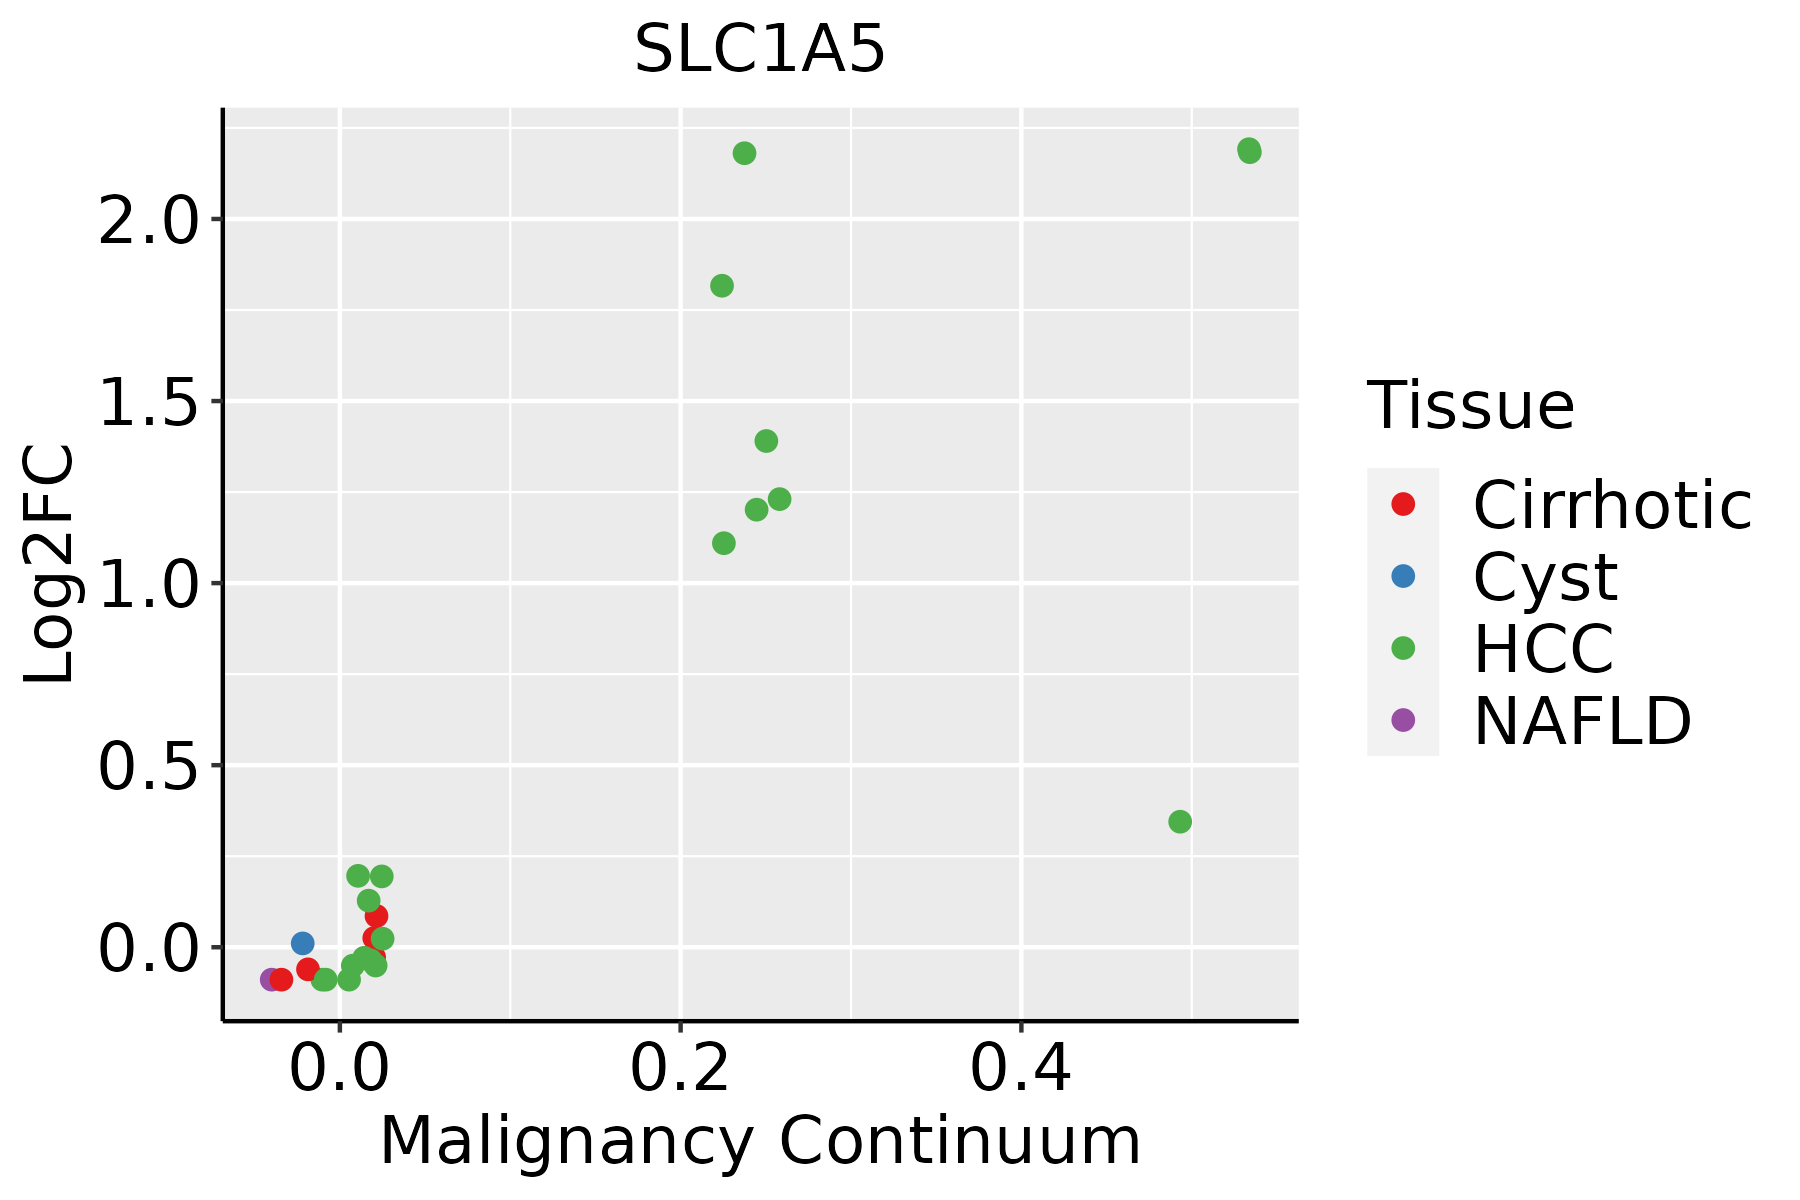 | HCC: Hepatocellular carcinoma |
| NAFLD: Non-alcoholic fatty liver disease | ||
| Oral Cavity | 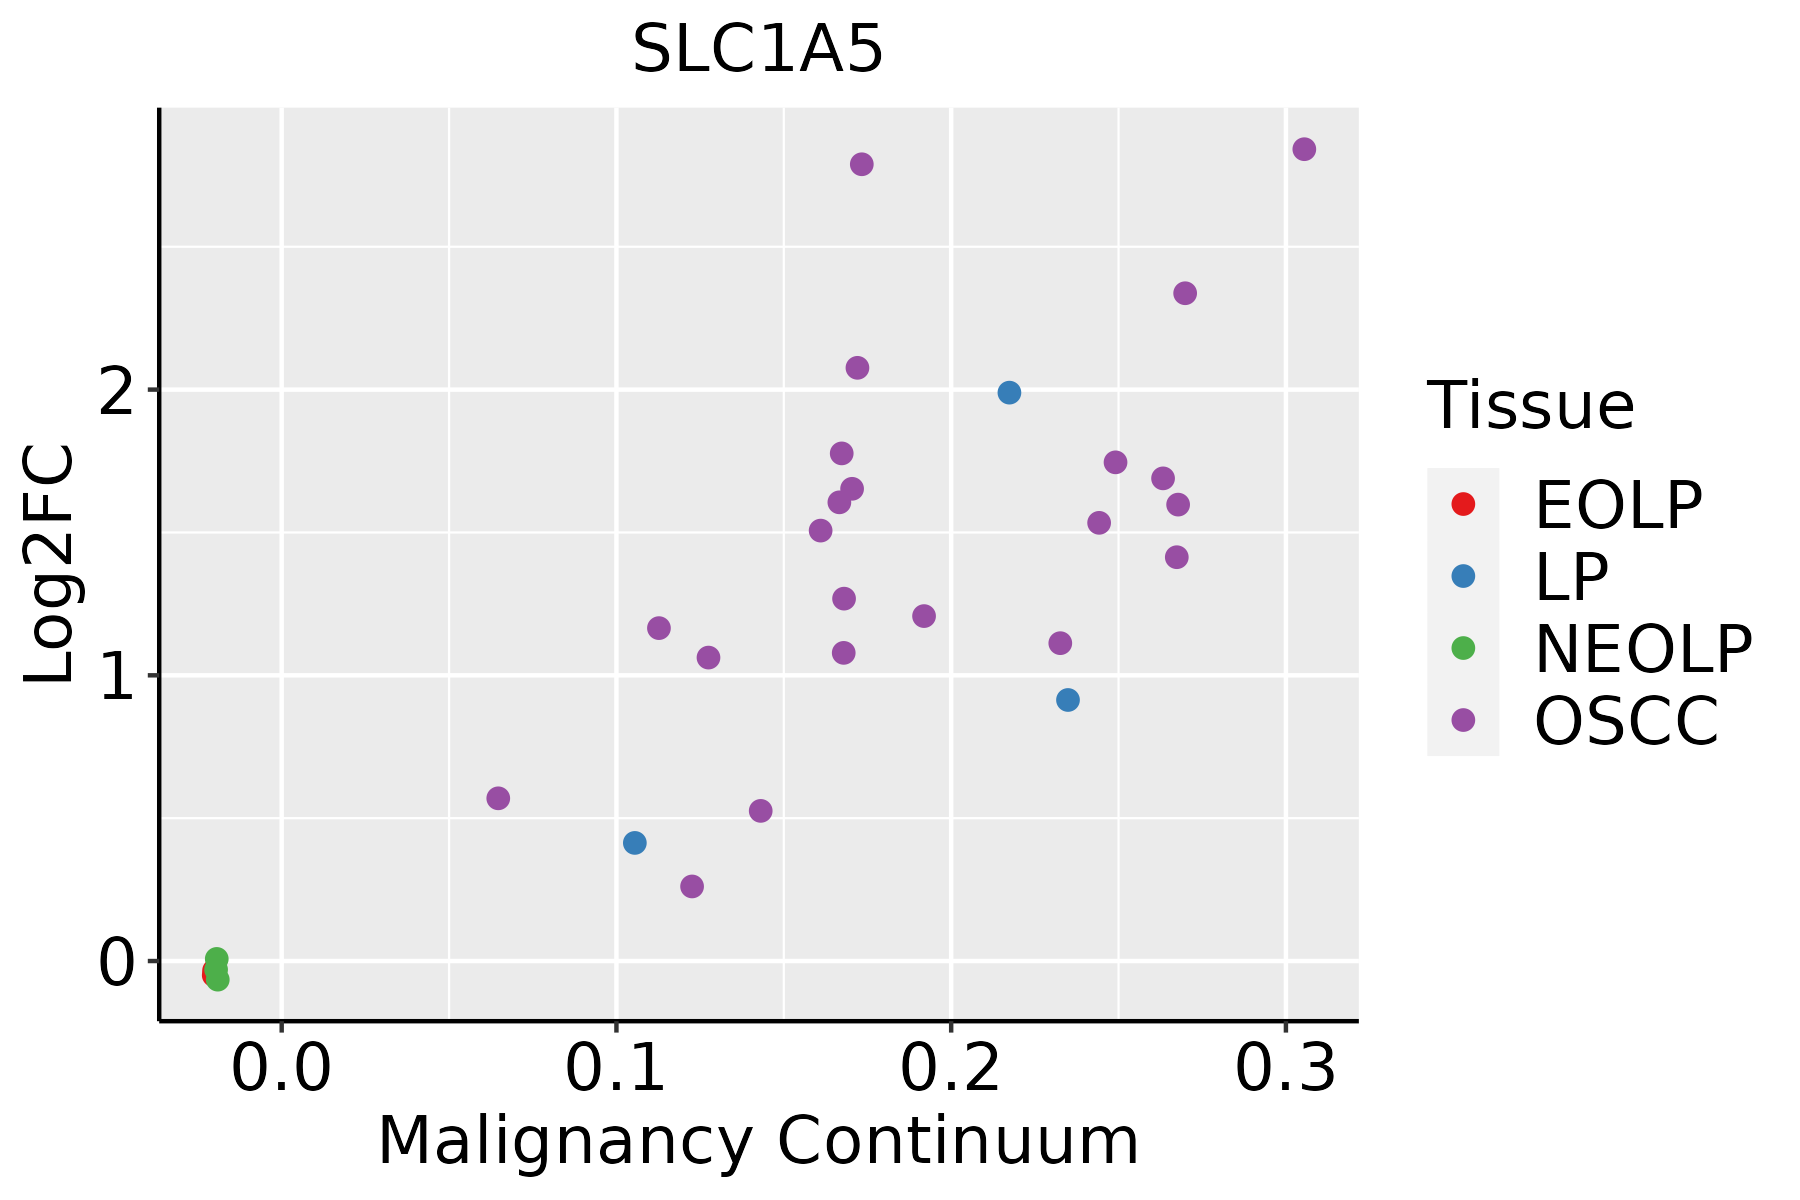 | EOLP: Erosive Oral lichen planus |
| LP: leukoplakia | ||
| NEOLP: Non-erosive oral lichen planus | ||
| OSCC: Oral squamous cell carcinoma | ||
| Prostate | 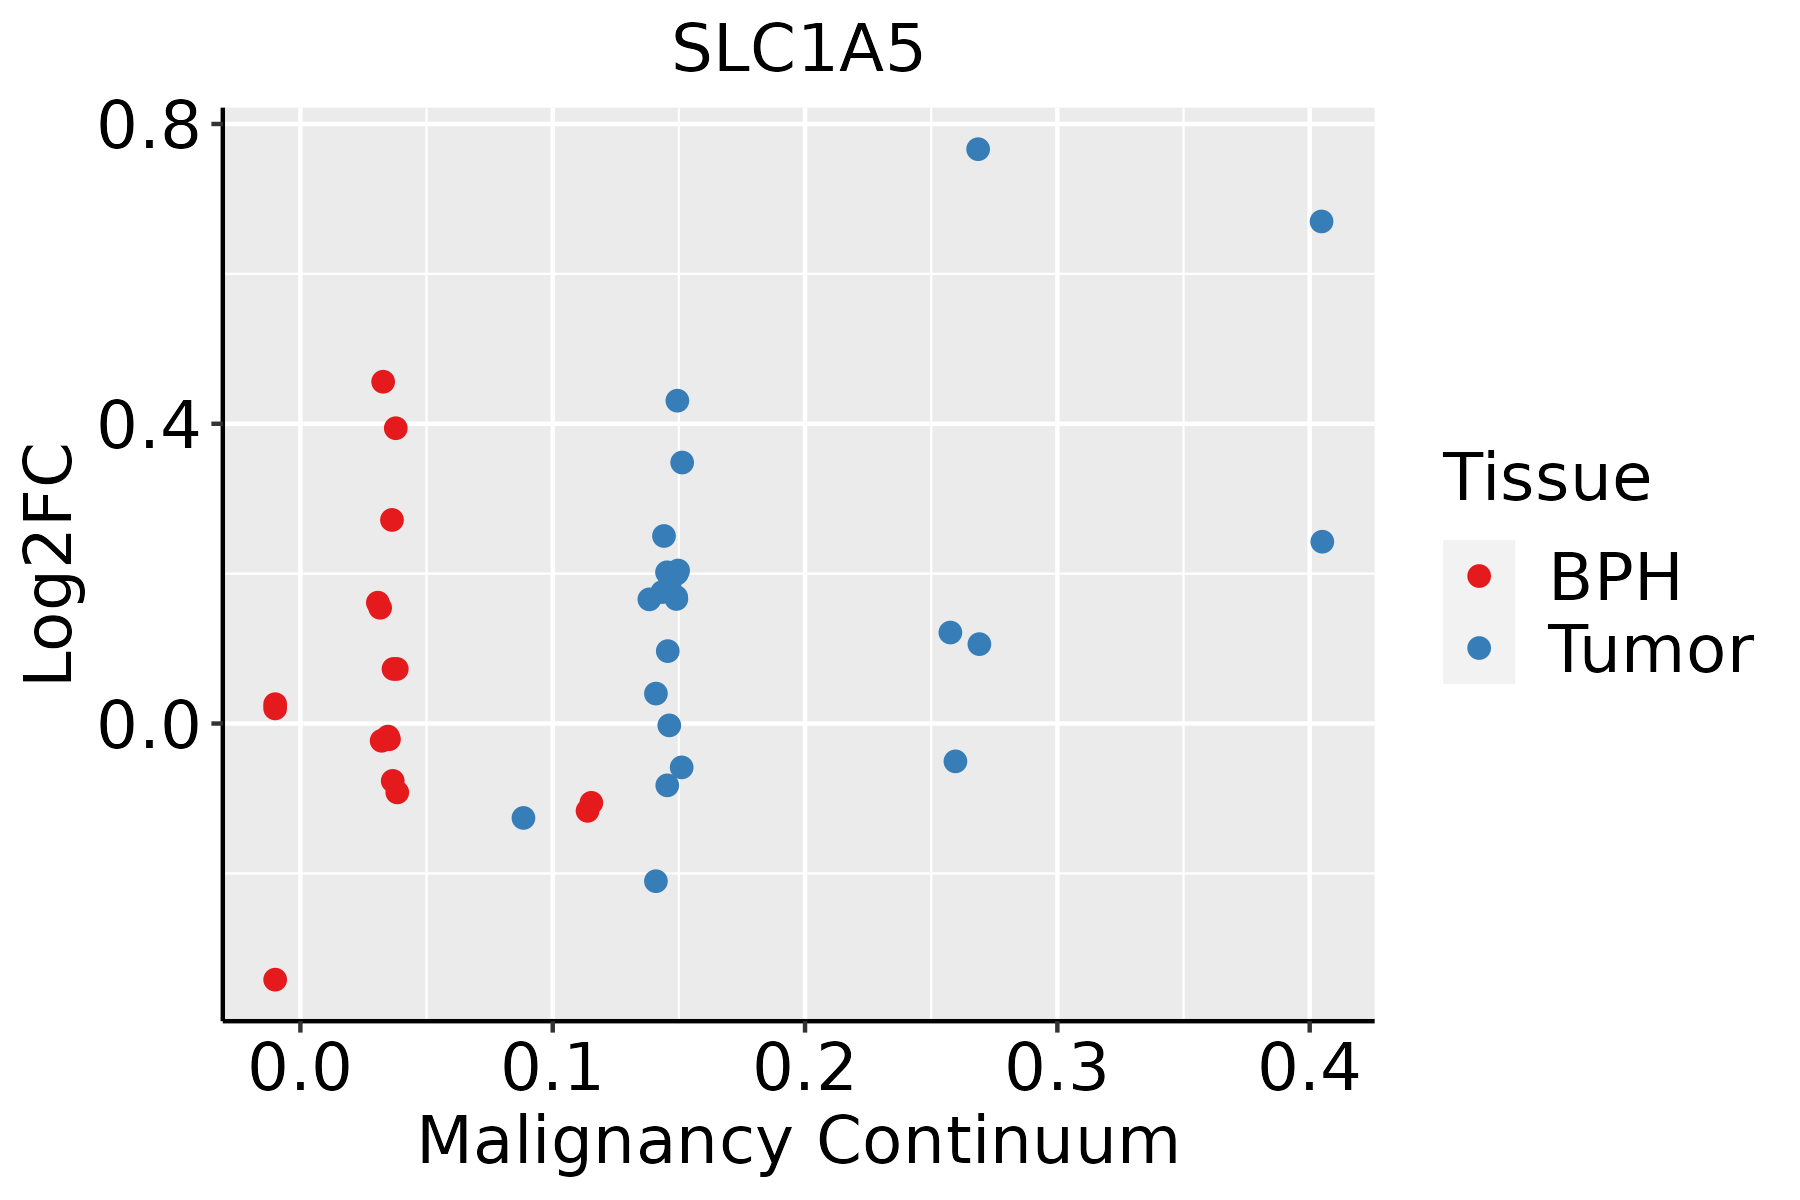 | BPH: Benign Prostatic Hyperplasia |
| Skin | 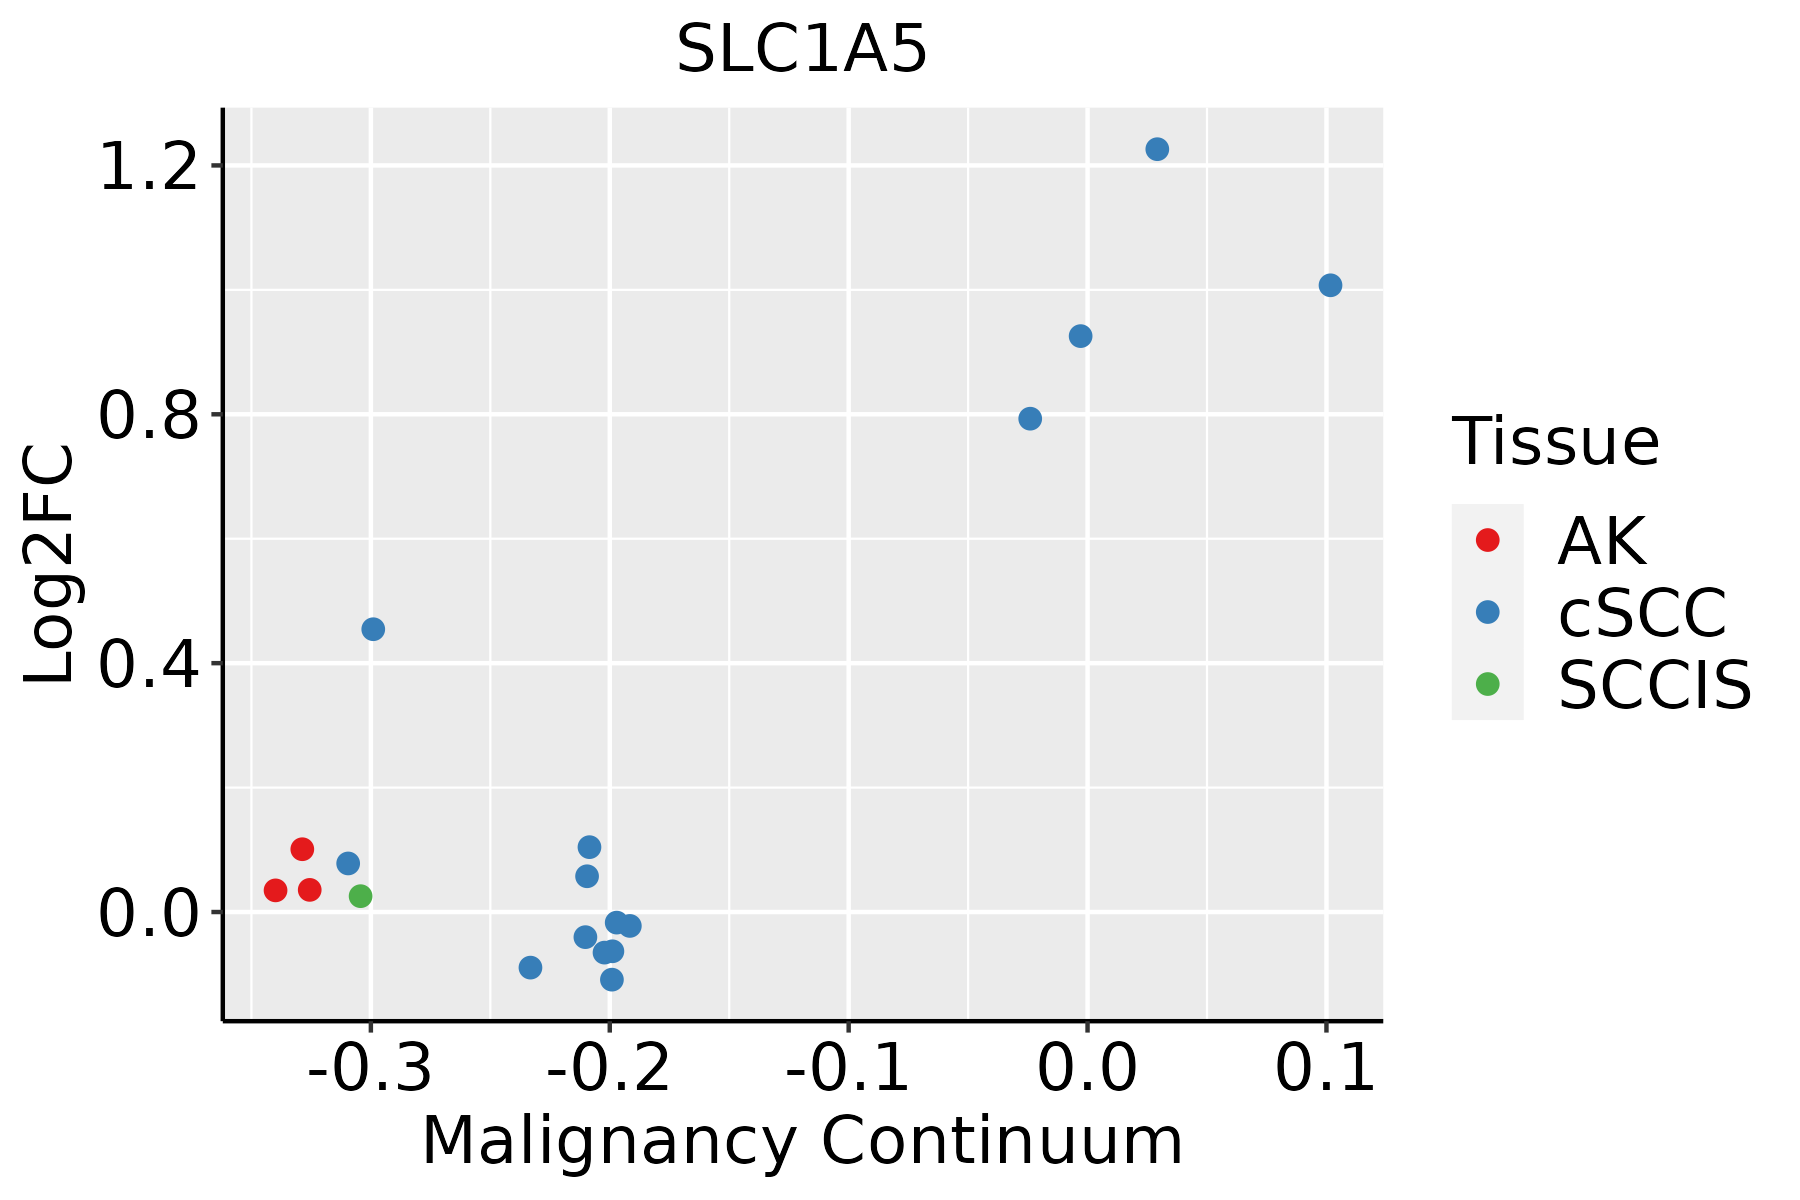 | AK: Actinic keratosis |
| cSCC: Cutaneous squamous cell carcinoma | ||
| SCCIS:squamous cell carcinoma in situ | ||
| Thyroid |  | ATC: Anaplastic thyroid cancer |
| HT: Hashimoto's thyroiditis | ||
| PTC: Papillary thyroid cancer |
| ∗log2FC in expression of this searched gene in stem-like cells from each diseased tissue sample relative to stem-like cells in normal samples in each tissue plotted against the malignancy continuum. Samples are colored based on if they are from different disease stage. |
Top |
Malignant transformation related pathway analysis |
| Find out the enriched GO biological processes and KEGG pathways involved in transition from healthy to precancer to cancer |
| Tissue | Disease Stage | Enriched GO biological Processes |
| Colorectum | AD |  |
| Colorectum | SER |  |
| Colorectum | MSS |  |
| Colorectum | MSI-H |  |
| Colorectum | FAP |  |
| ∗Top 15 enriched GO BP terms are showed in the bar plot of each disease state in each tissue. Each row represents a significant GO biological process which is colored according to the -log10(p.adjust). |
| Page: 1 2 3 4 5 6 7 8 9 |
| GO ID | Tissue | Disease Stage | Description | Gene Ratio | Bg Ratio | pvalue | p.adjust | Count |
| GO:001603220 | Oral cavity | OSCC | viral process | 274/7305 | 415/18723 | 2.42e-29 | 1.70e-26 | 274 |
| GO:001905820 | Oral cavity | OSCC | viral life cycle | 208/7305 | 317/18723 | 4.59e-22 | 1.00e-19 | 208 |
| GO:004440320 | Oral cavity | OSCC | biological process involved in symbiotic interaction | 173/7305 | 290/18723 | 6.80e-13 | 3.19e-11 | 173 |
| GO:005170120 | Oral cavity | OSCC | biological process involved in interaction with host | 125/7305 | 203/18723 | 5.60e-11 | 1.74e-09 | 125 |
| GO:005212620 | Oral cavity | OSCC | movement in host environment | 106/7305 | 175/18723 | 5.84e-09 | 1.26e-07 | 106 |
| GO:004440920 | Oral cavity | OSCC | entry into host | 86/7305 | 151/18723 | 5.74e-06 | 6.37e-05 | 86 |
| GO:004671820 | Oral cavity | OSCC | viral entry into host cell | 81/7305 | 144/18723 | 1.98e-05 | 1.89e-04 | 81 |
| GO:0051259 | Oral cavity | OSCC | protein complex oligomerization | 121/7305 | 238/18723 | 1.29e-04 | 9.21e-04 | 121 |
| GO:0032329 | Oral cavity | OSCC | serine transport | 9/7305 | 11/18723 | 4.85e-03 | 1.92e-02 | 9 |
| GO:0016032110 | Oral cavity | LP | viral process | 211/4623 | 415/18723 | 4.06e-31 | 3.18e-28 | 211 |
| GO:0019058110 | Oral cavity | LP | viral life cycle | 161/4623 | 317/18723 | 5.99e-24 | 2.21e-21 | 161 |
| GO:0051701110 | Oral cavity | LP | biological process involved in interaction with host | 100/4623 | 203/18723 | 2.72e-14 | 3.10e-12 | 100 |
| GO:0044403110 | Oral cavity | LP | biological process involved in symbiotic interaction | 130/4623 | 290/18723 | 4.23e-14 | 4.64e-12 | 130 |
| GO:0052126110 | Oral cavity | LP | movement in host environment | 87/4623 | 175/18723 | 6.65e-13 | 5.79e-11 | 87 |
| GO:0044409110 | Oral cavity | LP | entry into host | 68/4623 | 151/18723 | 3.72e-08 | 1.33e-06 | 68 |
| GO:0046718110 | Oral cavity | LP | viral entry into host cell | 63/4623 | 144/18723 | 4.16e-07 | 1.19e-05 | 63 |
| GO:00512591 | Oral cavity | LP | protein complex oligomerization | 85/4623 | 238/18723 | 8.81e-05 | 1.11e-03 | 85 |
| GO:00323291 | Oral cavity | LP | serine transport | 7/4623 | 11/18723 | 7.01e-03 | 3.96e-02 | 7 |
| GO:001603218 | Prostate | BPH | viral process | 147/3107 | 415/18723 | 4.46e-21 | 5.52e-18 | 147 |
| GO:001905818 | Prostate | BPH | viral life cycle | 112/3107 | 317/18723 | 2.87e-16 | 5.54e-14 | 112 |
| Page: 1 2 3 4 5 6 |
| Pathway ID | Tissue | Disease Stage | Description | Gene Ratio | Bg Ratio | pvalue | p.adjust | qvalue | Count |
| hsa0523010 | Cervix | CC | Central carbon metabolism in cancer | 18/1267 | 70/8465 | 1.29e-02 | 3.87e-02 | 2.29e-02 | 18 |
| hsa0523013 | Cervix | CC | Central carbon metabolism in cancer | 18/1267 | 70/8465 | 1.29e-02 | 3.87e-02 | 2.29e-02 | 18 |
| hsa05230 | Colorectum | AD | Central carbon metabolism in cancer | 33/2092 | 70/8465 | 3.61e-05 | 3.19e-04 | 2.03e-04 | 33 |
| hsa052301 | Colorectum | AD | Central carbon metabolism in cancer | 33/2092 | 70/8465 | 3.61e-05 | 3.19e-04 | 2.03e-04 | 33 |
| hsa052302 | Colorectum | SER | Central carbon metabolism in cancer | 25/1580 | 70/8465 | 5.43e-04 | 4.51e-03 | 3.27e-03 | 25 |
| hsa052303 | Colorectum | SER | Central carbon metabolism in cancer | 25/1580 | 70/8465 | 5.43e-04 | 4.51e-03 | 3.27e-03 | 25 |
| hsa052304 | Colorectum | MSS | Central carbon metabolism in cancer | 25/1875 | 70/8465 | 6.50e-03 | 2.64e-02 | 1.62e-02 | 25 |
| hsa052305 | Colorectum | MSS | Central carbon metabolism in cancer | 25/1875 | 70/8465 | 6.50e-03 | 2.64e-02 | 1.62e-02 | 25 |
| hsa0523018 | Esophagus | ESCC | Central carbon metabolism in cancer | 50/4205 | 70/8465 | 1.70e-04 | 6.62e-04 | 3.39e-04 | 50 |
| hsa0523019 | Esophagus | ESCC | Central carbon metabolism in cancer | 50/4205 | 70/8465 | 1.70e-04 | 6.62e-04 | 3.39e-04 | 50 |
| hsa0523021 | Liver | HCC | Central carbon metabolism in cancer | 43/4020 | 70/8465 | 1.30e-02 | 3.19e-02 | 1.78e-02 | 43 |
| hsa0523031 | Liver | HCC | Central carbon metabolism in cancer | 43/4020 | 70/8465 | 1.30e-02 | 3.19e-02 | 1.78e-02 | 43 |
| hsa0523016 | Oral cavity | OSCC | Central carbon metabolism in cancer | 49/3704 | 70/8465 | 7.57e-06 | 3.59e-05 | 1.83e-05 | 49 |
| hsa0523017 | Oral cavity | OSCC | Central carbon metabolism in cancer | 49/3704 | 70/8465 | 7.57e-06 | 3.59e-05 | 1.83e-05 | 49 |
| hsa0523023 | Oral cavity | LP | Central carbon metabolism in cancer | 31/2418 | 70/8465 | 3.50e-03 | 1.46e-02 | 9.40e-03 | 31 |
| hsa0523033 | Oral cavity | LP | Central carbon metabolism in cancer | 31/2418 | 70/8465 | 3.50e-03 | 1.46e-02 | 9.40e-03 | 31 |
| hsa0523014 | Prostate | BPH | Central carbon metabolism in cancer | 23/1718 | 70/8465 | 9.13e-03 | 2.84e-02 | 1.76e-02 | 23 |
| hsa0523015 | Prostate | BPH | Central carbon metabolism in cancer | 23/1718 | 70/8465 | 9.13e-03 | 2.84e-02 | 1.76e-02 | 23 |
| hsa0523022 | Prostate | Tumor | Central carbon metabolism in cancer | 23/1791 | 70/8465 | 1.50e-02 | 4.47e-02 | 2.77e-02 | 23 |
| hsa0523032 | Prostate | Tumor | Central carbon metabolism in cancer | 23/1791 | 70/8465 | 1.50e-02 | 4.47e-02 | 2.77e-02 | 23 |
| Page: 1 |
Top |
Cell-cell communication analysis |
| Identification of potential cell-cell interactions between two cell types and their ligand-receptor pairs for different disease states |
| Ligand | Receptor | LRpair | Pathway | Tissue | Disease Stage |
| Page: 1 |
Top |
Single-cell gene regulatory network inference analysis |
| Find out the significant the regulons (TFs) and the target genes of each regulon across cell types for different disease states |
| TF | Cell Type | Tissue | Disease Stage | Target Gene | RSS | Regulon Activity |
| ∗The dot plots of a searched regulon are shown for all cell subpopulations in each disease state of each tissue based on the regulon specific score inferred using pySCENIC and by calculating the average expression. |
| Page: 1 |
Top |
Somatic mutation of malignant transformation related genes |
| Annotation of somatic variants for genes involved in malignant transformation |
| Hugo Symbol | Variant Class | Variant Classification | dbSNP RS | HGVSc | HGVSp | HGVSp Short | SWISSPROT | BIOTYPE | SIFT | PolyPhen | Tumor Sample Barcode | Tissue | Histology | Sex | Age | Stage | Therapy Types | Drugs | Outcome |
| SLC1A5 | SNV | Missense_Mutation | novel | c.476C>T | p.Ser159Phe | p.S159F | Q15758 | protein_coding | tolerated(0.33) | benign(0.001) | TCGA-A7-A4SA-01 | Breast | breast invasive carcinoma | Female | <65 | I/II | Chemotherapy | doxorubicin | CR |
| SLC1A5 | insertion | Frame_Shift_Ins | novel | c.1334_1335insCGGGTATGGT | p.Val446GlyfsTer33 | p.V446Gfs*33 | Q15758 | protein_coding | TCGA-BH-A0E2-01 | Breast | breast invasive carcinoma | Female | <65 | III/IV | Chemotherapy | doxorubicin | SD | ||
| SLC1A5 | insertion | In_Frame_Ins | novel | c.1332_1333insAATACAAAAAAATTA | p.Glu444_Ala445insAsnThrLysLysLeu | p.E444_A445insNTKKL | Q15758 | protein_coding | TCGA-BH-A0E2-01 | Breast | breast invasive carcinoma | Female | <65 | III/IV | Chemotherapy | doxorubicin | SD | ||
| SLC1A5 | SNV | Missense_Mutation | c.604N>T | p.Arg202Cys | p.R202C | Q15758 | protein_coding | deleterious(0) | probably_damaging(0.932) | TCGA-DS-A0VM-01 | Cervix | cervical & endocervical cancer | Female | <65 | I/II | Chemotherapy | cisplatin | PD | |
| SLC1A5 | SNV | Missense_Mutation | novel | c.647N>T | p.Thr216Ile | p.T216I | Q15758 | protein_coding | tolerated(0.05) | benign(0.142) | TCGA-VS-A9U6-01 | Cervix | cervical & endocervical cancer | Female | <65 | I/II | Chemotherapy | cisplatin | PD |
| SLC1A5 | SNV | Missense_Mutation | rs767653184 | c.1268N>T | p.Ala423Val | p.A423V | Q15758 | protein_coding | deleterious(0.04) | probably_damaging(0.926) | TCGA-A6-2686-01 | Colorectum | colon adenocarcinoma | Female | >=65 | I/II | Unknown | Unknown | SD |
| SLC1A5 | SNV | Missense_Mutation | rs144030682 | c.1286N>T | p.Ala429Val | p.A429V | Q15758 | protein_coding | deleterious(0) | probably_damaging(0.997) | TCGA-A6-5661-01 | Colorectum | colon adenocarcinoma | Female | >=65 | I/II | Unknown | Unknown | SD |
| SLC1A5 | SNV | Missense_Mutation | c.1066N>G | p.Thr356Ala | p.T356A | Q15758 | protein_coding | deleterious(0) | possibly_damaging(0.872) | TCGA-AA-3715-01 | Colorectum | colon adenocarcinoma | Male | >=65 | I/II | Unknown | Unknown | PD | |
| SLC1A5 | SNV | Missense_Mutation | rs749537352 | c.989G>A | p.Arg330His | p.R330H | Q15758 | protein_coding | deleterious(0.03) | probably_damaging(0.989) | TCGA-AZ-4615-01 | Colorectum | colon adenocarcinoma | Male | >=65 | III/IV | Chemotherapy | xeloda | PD |
| SLC1A5 | SNV | Missense_Mutation | rs767653184 | c.1268N>T | p.Ala423Val | p.A423V | Q15758 | protein_coding | deleterious(0.04) | probably_damaging(0.926) | TCGA-WS-AB45-01 | Colorectum | colon adenocarcinoma | Female | <65 | I/II | Unknown | Unknown | SD |
| Page: 1 2 3 4 5 |
Top |
Related drugs of malignant transformation related genes |
| Identification of chemicals and drugs interact with genes involved in malignant transfromation |
| (DGIdb 4.0) |
| Entrez ID | Symbol | Category | Interaction Types | Drug Claim Name | Drug Name | PMIDs |
| 6510 | SLC1A5 | TRANSPORTER | inhibitor | 178101229 | BENZYLCYSTEINE | |
| 6510 | SLC1A5 | TRANSPORTER | GLUTAMINE | GLUTAMINE | 11997238 | |
| 6510 | SLC1A5 | TRANSPORTER | inhibitor | 178101228 |
| Page: 1 |

Copyright 2023-Present -The University of Texas Health Science Center at Houston |