
|
|||||
|
 | |
| |
| |
| |
| |
| |
|
Gene: SIRT2 |
Gene summary for SIRT2 |
| Gene information | Species | Human | Gene symbol | SIRT2 | Gene ID | 22933 |
| Gene name | sirtuin 2 | |
| Gene Alias | SIR2 | |
| Cytomap | 19q13.2 | |
| Gene Type | protein-coding | GO ID | GO:0000003 | UniProtAcc | A0A0A0MRF5 |
Top |
Malignant transformation analysis |
| Identification of the aberrant gene expression in precancerous and cancerous lesions by comparing the gene expression of stem-like cells in diseased tissues with normal stem cells |
| Entrez ID | Symbol | Replicates | Species | Organ | Tissue | Adj P-value | Log2FC | Malignancy |
| 22933 | SIRT2 | LZE2T | Human | Esophagus | ESCC | 4.48e-02 | 1.98e-01 | 0.082 |
| 22933 | SIRT2 | LZE4T | Human | Esophagus | ESCC | 4.05e-14 | 3.10e-01 | 0.0811 |
| 22933 | SIRT2 | LZE7T | Human | Esophagus | ESCC | 1.29e-04 | 2.03e-01 | 0.0667 |
| 22933 | SIRT2 | LZE8T | Human | Esophagus | ESCC | 3.31e-09 | 1.32e-01 | 0.067 |
| 22933 | SIRT2 | LZE20T | Human | Esophagus | ESCC | 2.91e-03 | -2.22e-02 | 0.0662 |
| 22933 | SIRT2 | LZE22D1 | Human | Esophagus | HGIN | 9.77e-07 | 1.27e-01 | 0.0595 |
| 22933 | SIRT2 | LZE24T | Human | Esophagus | ESCC | 4.70e-09 | 2.45e-01 | 0.0596 |
| 22933 | SIRT2 | LZE6T | Human | Esophagus | ESCC | 2.36e-03 | 2.38e-02 | 0.0845 |
| 22933 | SIRT2 | P1T-E | Human | Esophagus | ESCC | 2.30e-15 | 9.91e-01 | 0.0875 |
| 22933 | SIRT2 | P2T-E | Human | Esophagus | ESCC | 8.87e-17 | 3.32e-01 | 0.1177 |
| 22933 | SIRT2 | P4T-E | Human | Esophagus | ESCC | 3.42e-16 | 3.44e-01 | 0.1323 |
| 22933 | SIRT2 | P5T-E | Human | Esophagus | ESCC | 3.56e-09 | 8.50e-02 | 0.1327 |
| 22933 | SIRT2 | P8T-E | Human | Esophagus | ESCC | 6.70e-35 | 6.80e-01 | 0.0889 |
| 22933 | SIRT2 | P9T-E | Human | Esophagus | ESCC | 2.73e-08 | 1.32e-01 | 0.1131 |
| 22933 | SIRT2 | P10T-E | Human | Esophagus | ESCC | 5.18e-30 | 6.59e-01 | 0.116 |
| 22933 | SIRT2 | P11T-E | Human | Esophagus | ESCC | 2.53e-16 | 7.47e-01 | 0.1426 |
| 22933 | SIRT2 | P12T-E | Human | Esophagus | ESCC | 1.97e-18 | 3.79e-01 | 0.1122 |
| 22933 | SIRT2 | P15T-E | Human | Esophagus | ESCC | 1.29e-16 | 3.30e-01 | 0.1149 |
| 22933 | SIRT2 | P16T-E | Human | Esophagus | ESCC | 5.53e-16 | 1.76e-01 | 0.1153 |
| 22933 | SIRT2 | P17T-E | Human | Esophagus | ESCC | 4.16e-06 | 4.33e-01 | 0.1278 |
| Page: 1 2 3 4 5 6 |
| Tissue | Expression Dynamics | Abbreviation |
| Esophagus | 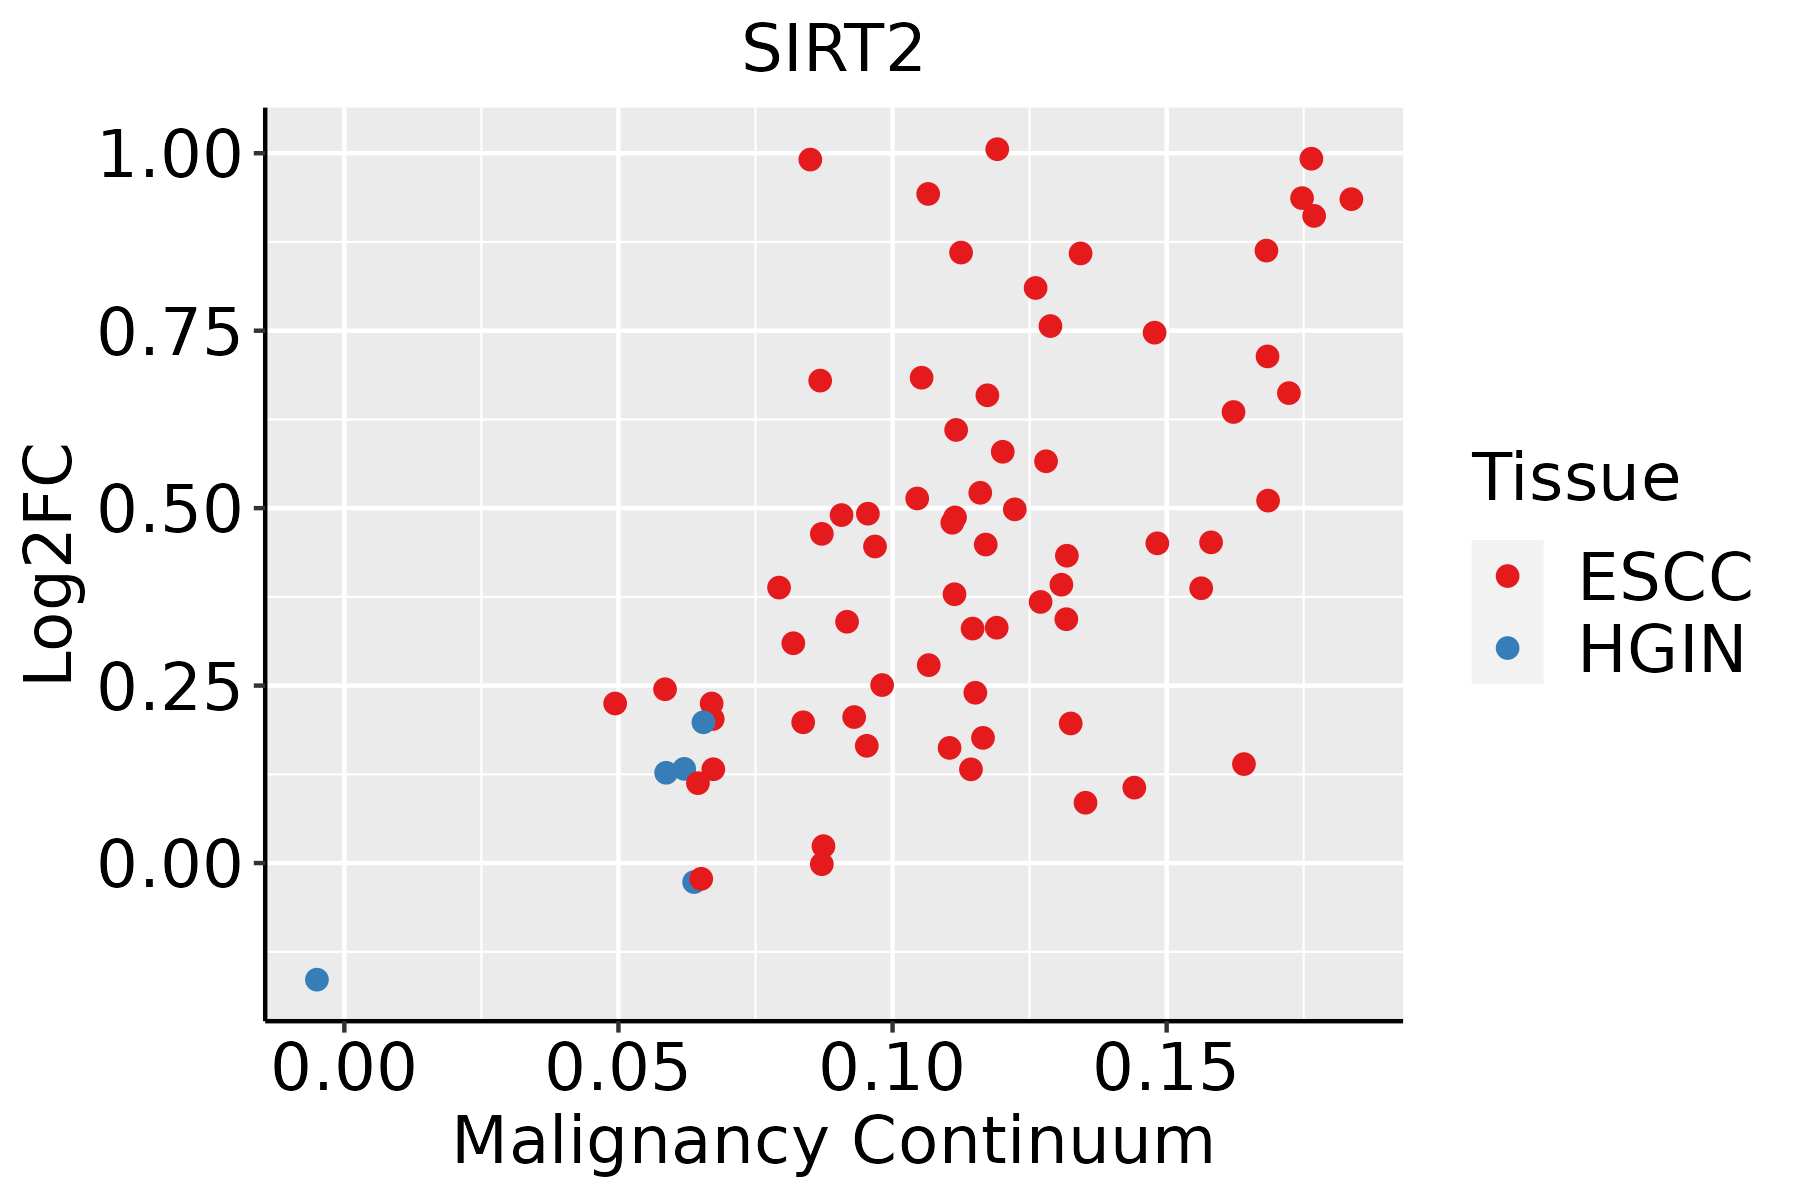 | ESCC: Esophageal squamous cell carcinoma |
| HGIN: High-grade intraepithelial neoplasias | ||
| LGIN: Low-grade intraepithelial neoplasias | ||
| Liver |  | HCC: Hepatocellular carcinoma |
| NAFLD: Non-alcoholic fatty liver disease | ||
| Oral Cavity | 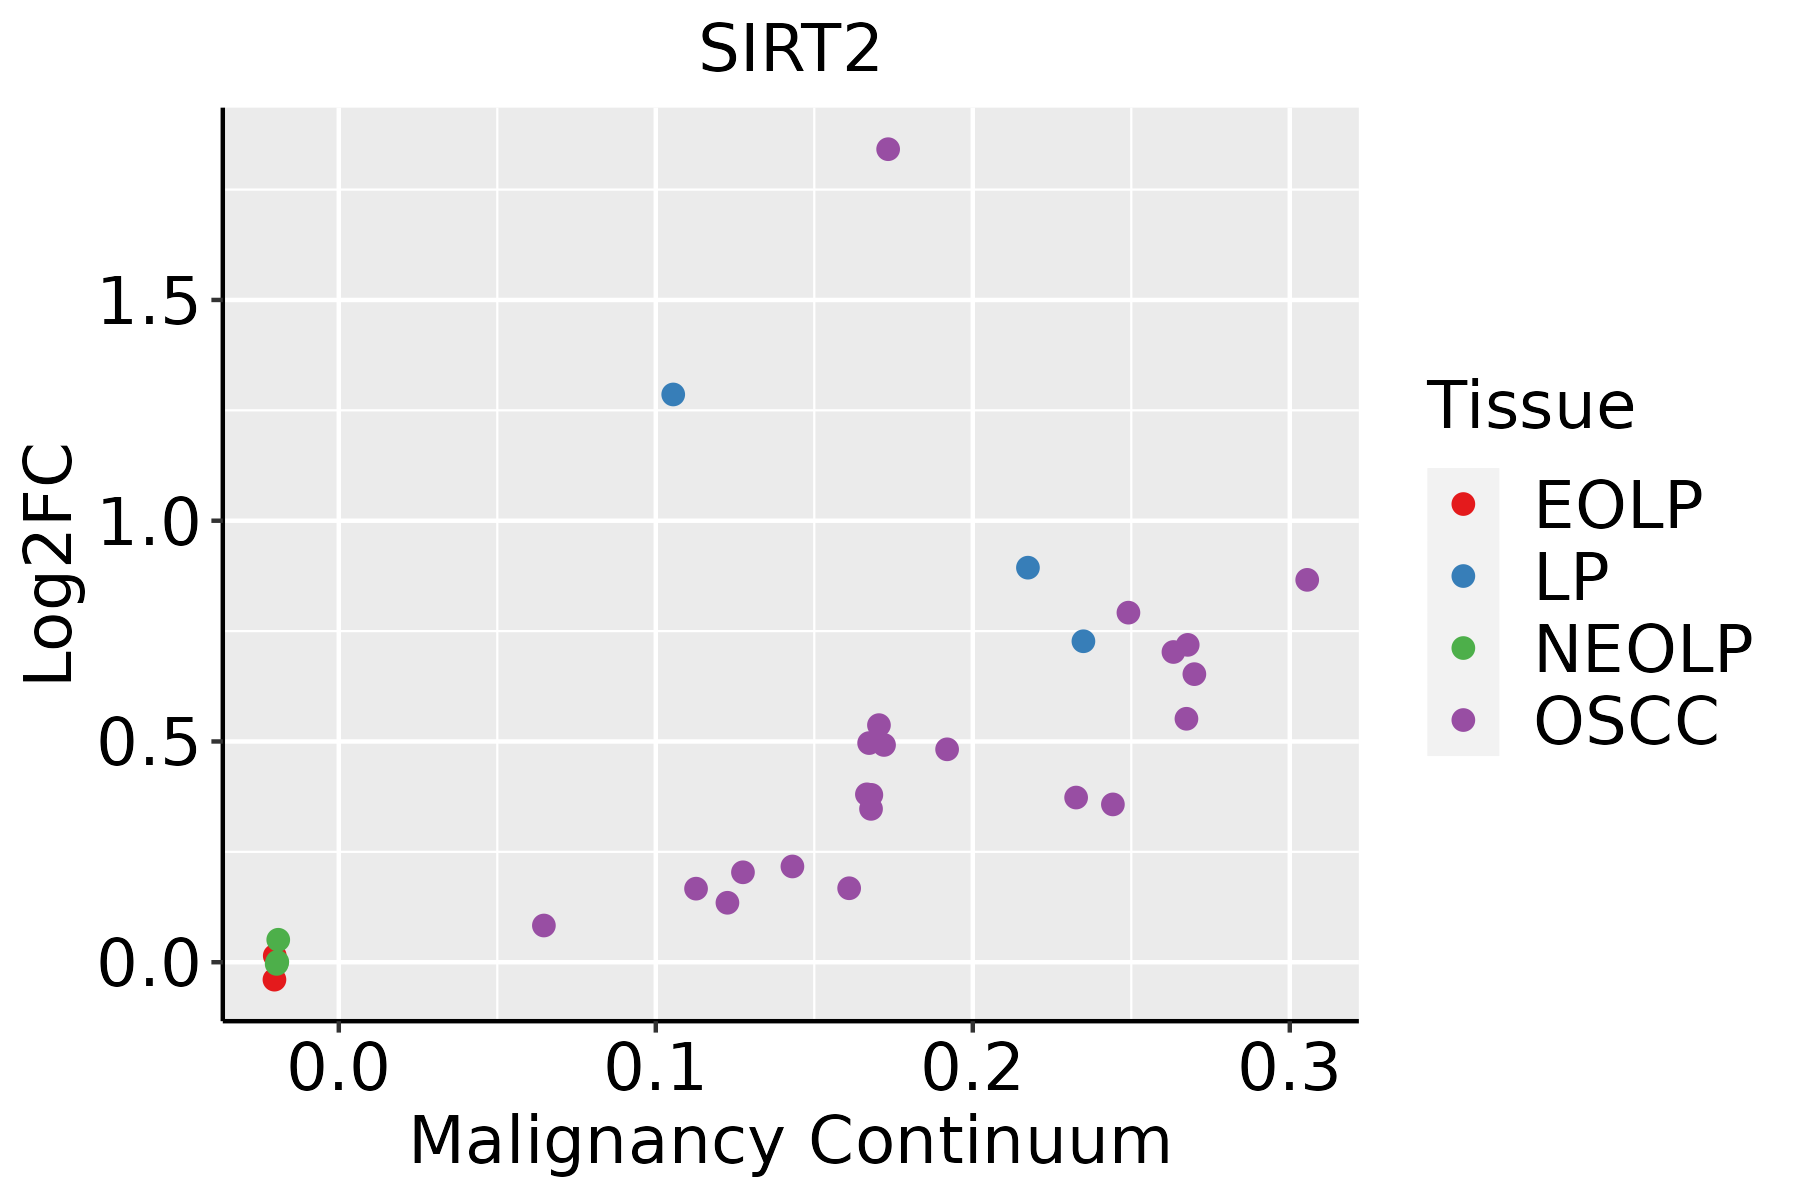 | EOLP: Erosive Oral lichen planus |
| LP: leukoplakia | ||
| NEOLP: Non-erosive oral lichen planus | ||
| OSCC: Oral squamous cell carcinoma | ||
| Skin | 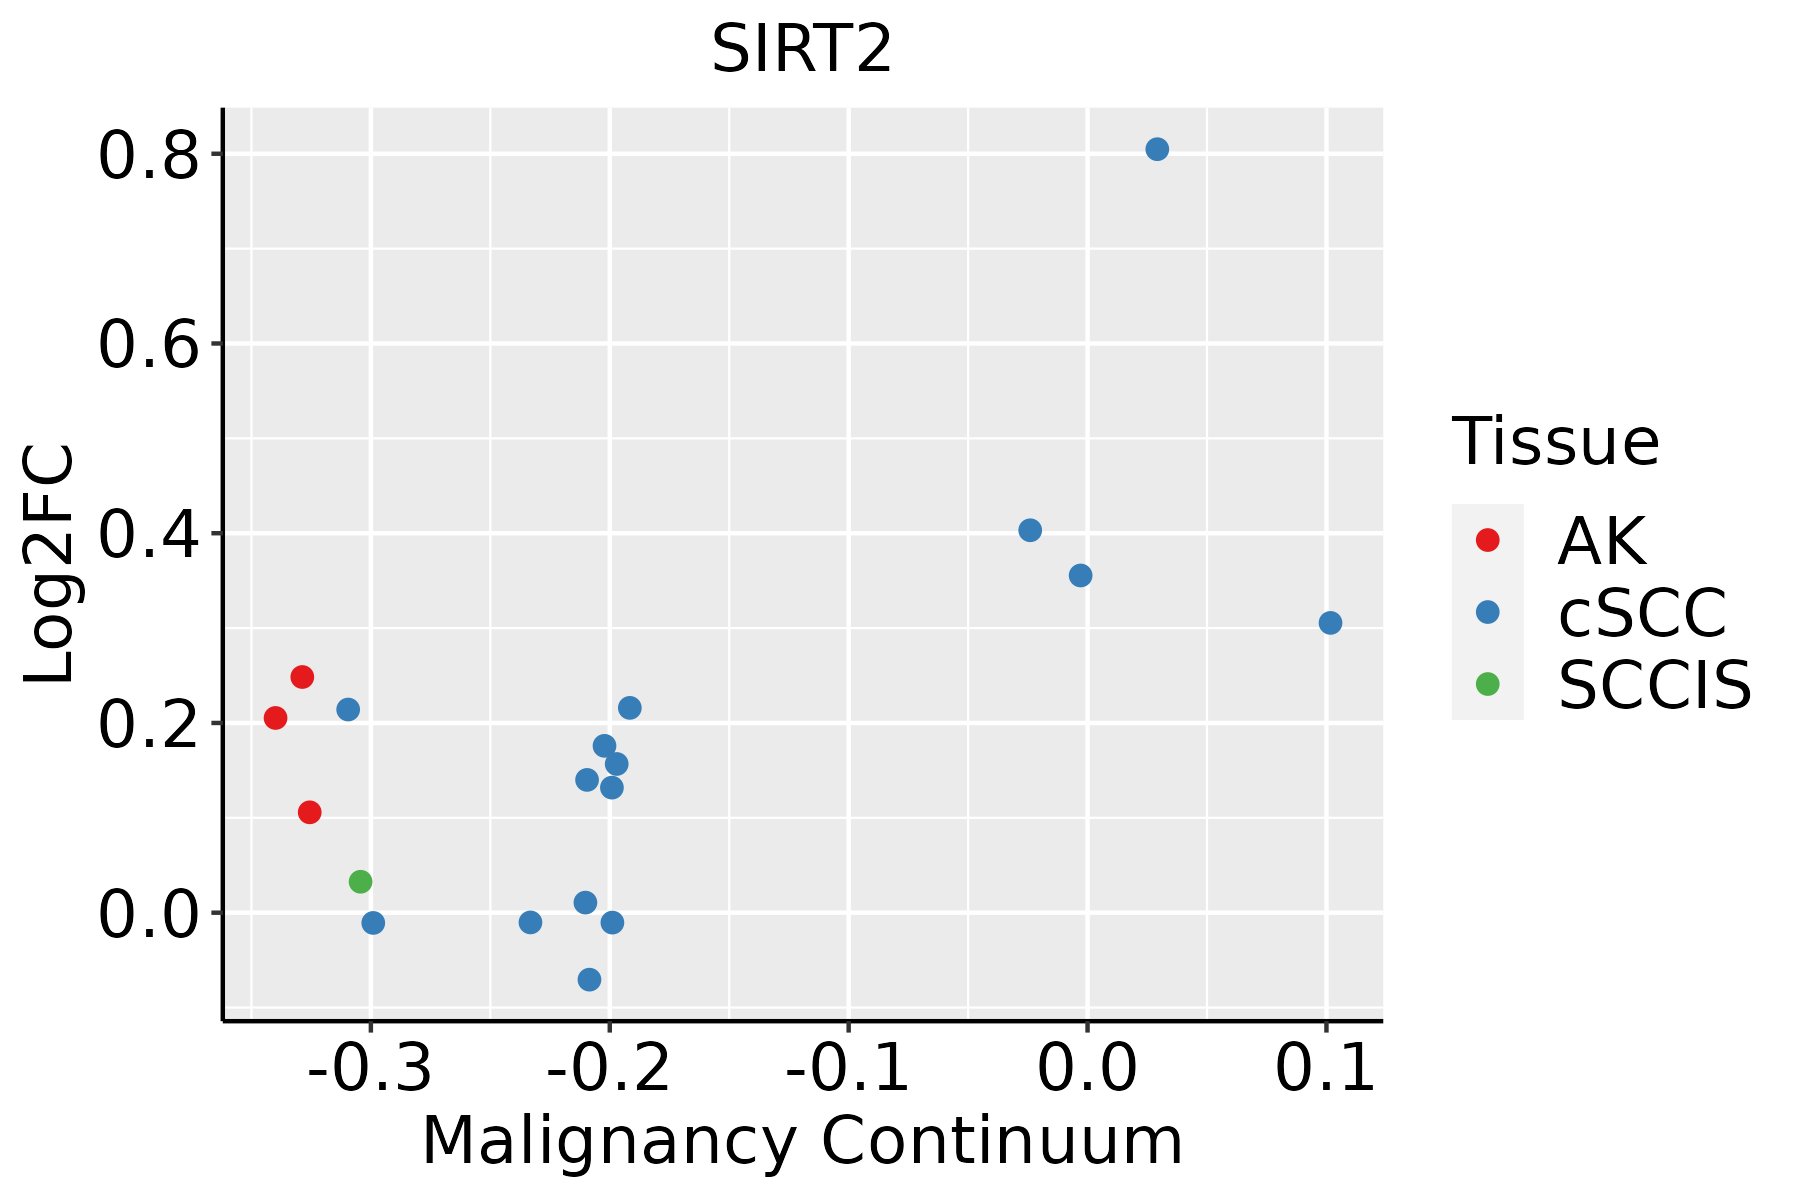 | AK: Actinic keratosis |
| cSCC: Cutaneous squamous cell carcinoma | ||
| SCCIS:squamous cell carcinoma in situ | ||
| Thyroid |  | ATC: Anaplastic thyroid cancer |
| HT: Hashimoto's thyroiditis | ||
| PTC: Papillary thyroid cancer |
| ∗log2FC in expression of this searched gene in stem-like cells from each diseased tissue sample relative to stem-like cells in normal samples in each tissue plotted against the malignancy continuum. Samples are colored based on if they are from different disease stage. |
Top |
Malignant transformation related pathway analysis |
| Find out the enriched GO biological processes and KEGG pathways involved in transition from healthy to precancer to cancer |
| Tissue | Disease Stage | Enriched GO biological Processes |
| Colorectum | AD |  |
| Colorectum | SER |  |
| Colorectum | MSS |  |
| Colorectum | MSI-H |  |
| Colorectum | FAP |  |
| ∗Top 15 enriched GO BP terms are showed in the bar plot of each disease state in each tissue. Each row represents a significant GO biological process which is colored according to the -log10(p.adjust). |
| Page: 1 2 3 4 5 6 7 8 9 |
| GO ID | Tissue | Disease Stage | Description | Gene Ratio | Bg Ratio | pvalue | p.adjust | Count |
| GO:00028325 | Esophagus | HGIN | negative regulation of response to biotic stimulus | 25/2587 | 108/18723 | 5.87e-03 | 4.77e-02 | 25 |
| GO:0010498111 | Esophagus | ESCC | proteasomal protein catabolic process | 369/8552 | 490/18723 | 1.13e-41 | 1.80e-38 | 369 |
| GO:0043161111 | Esophagus | ESCC | proteasome-mediated ubiquitin-dependent protein catabolic process | 312/8552 | 412/18723 | 3.53e-36 | 4.48e-33 | 312 |
| GO:001657015 | Esophagus | ESCC | histone modification | 323/8552 | 463/18723 | 2.61e-26 | 7.88e-24 | 323 |
| GO:014001414 | Esophagus | ESCC | mitotic nuclear division | 218/8552 | 287/18723 | 6.17e-26 | 1.78e-23 | 218 |
| GO:0042176111 | Esophagus | ESCC | regulation of protein catabolic process | 280/8552 | 391/18723 | 8.65e-26 | 2.39e-23 | 280 |
| GO:0009896111 | Esophagus | ESCC | positive regulation of catabolic process | 332/8552 | 492/18723 | 4.36e-23 | 9.22e-21 | 332 |
| GO:0006979111 | Esophagus | ESCC | response to oxidative stress | 303/8552 | 446/18723 | 7.15e-22 | 1.30e-19 | 303 |
| GO:0031331111 | Esophagus | ESCC | positive regulation of cellular catabolic process | 292/8552 | 427/18723 | 8.67e-22 | 1.53e-19 | 292 |
| GO:001820514 | Esophagus | ESCC | peptidyl-lysine modification | 259/8552 | 376/18723 | 3.90e-20 | 5.26e-18 | 259 |
| GO:1903362111 | Esophagus | ESCC | regulation of cellular protein catabolic process | 188/8552 | 255/18723 | 5.12e-20 | 6.62e-18 | 188 |
| GO:0051098111 | Esophagus | ESCC | regulation of binding | 251/8552 | 363/18723 | 6.73e-20 | 8.46e-18 | 251 |
| GO:0045862111 | Esophagus | ESCC | positive regulation of proteolysis | 256/8552 | 372/18723 | 7.88e-20 | 9.43e-18 | 256 |
| GO:0062197111 | Esophagus | ESCC | cellular response to chemical stress | 234/8552 | 337/18723 | 5.37e-19 | 5.97e-17 | 234 |
| GO:000705911 | Esophagus | ESCC | chromosome segregation | 238/8552 | 346/18723 | 1.72e-18 | 1.82e-16 | 238 |
| GO:004477216 | Esophagus | ESCC | mitotic cell cycle phase transition | 281/8552 | 424/18723 | 4.63e-18 | 4.45e-16 | 281 |
| GO:001050617 | Esophagus | ESCC | regulation of autophagy | 220/8552 | 317/18723 | 6.72e-18 | 6.36e-16 | 220 |
| GO:1903050111 | Esophagus | ESCC | regulation of proteolysis involved in cellular protein catabolic process | 163/8552 | 221/18723 | 1.44e-17 | 1.27e-15 | 163 |
| GO:0061136111 | Esophagus | ESCC | regulation of proteasomal protein catabolic process | 142/8552 | 187/18723 | 2.40e-17 | 2.00e-15 | 142 |
| GO:0045732111 | Esophagus | ESCC | positive regulation of protein catabolic process | 167/8552 | 231/18723 | 1.47e-16 | 1.14e-14 | 167 |
| Page: 1 2 3 4 5 6 7 8 9 10 11 12 13 14 15 16 17 18 19 20 21 22 23 24 25 26 27 28 29 30 31 32 33 34 35 36 37 38 |
| Pathway ID | Tissue | Disease Stage | Description | Gene Ratio | Bg Ratio | pvalue | p.adjust | qvalue | Count |
| Page: 1 |
Top |
Cell-cell communication analysis |
| Identification of potential cell-cell interactions between two cell types and their ligand-receptor pairs for different disease states |
| Ligand | Receptor | LRpair | Pathway | Tissue | Disease Stage |
| Page: 1 |
Top |
Single-cell gene regulatory network inference analysis |
| Find out the significant the regulons (TFs) and the target genes of each regulon across cell types for different disease states |
| TF | Cell Type | Tissue | Disease Stage | Target Gene | RSS | Regulon Activity |
| ∗The dot plots of a searched regulon are shown for all cell subpopulations in each disease state of each tissue based on the regulon specific score inferred using pySCENIC and by calculating the average expression. |
| Page: 1 |
Top |
Somatic mutation of malignant transformation related genes |
| Annotation of somatic variants for genes involved in malignant transformation |
| Hugo Symbol | Variant Class | Variant Classification | dbSNP RS | HGVSc | HGVSp | HGVSp Short | SWISSPROT | BIOTYPE | SIFT | PolyPhen | Tumor Sample Barcode | Tissue | Histology | Sex | Age | Stage | Therapy Types | Drugs | Outcome |
| SIRT2 | SNV | Missense_Mutation | c.562N>A | p.Gly188Ser | p.G188S | Q8IXJ6 | protein_coding | deleterious(0) | probably_damaging(1) | TCGA-A2-A0YK-01 | Breast | breast invasive carcinoma | Female | <65 | I/II | Chemotherapy | cytoxan | SD | |
| SIRT2 | SNV | Missense_Mutation | rs199855116 | c.1036C>T | p.Arg346Trp | p.R346W | Q8IXJ6 | protein_coding | deleterious(0) | possibly_damaging(0.466) | TCGA-D8-A1Y3-01 | Breast | breast invasive carcinoma | Female | <65 | III/IV | Chemotherapy | doxorubicine+cyclophosphamide | SD |
| SIRT2 | SNV | Missense_Mutation | novel | c.1150N>A | p.Glu384Lys | p.E384K | Q8IXJ6 | protein_coding | tolerated_low_confidence(0.1) | benign(0.049) | TCGA-D8-A73U-01 | Breast | breast invasive carcinoma | Female | >=65 | I/II | Hormone Therapy | tamoxiphen | SD |
| SIRT2 | SNV | Missense_Mutation | novel | c.788C>A | p.Ser263Tyr | p.S263Y | Q8IXJ6 | protein_coding | deleterious(0) | probably_damaging(1) | TCGA-4J-AA1J-01 | Cervix | cervical & endocervical cancer | Female | <65 | I/II | Unknown | Unknown | SD |
| SIRT2 | SNV | Missense_Mutation | rs200811137 | c.1048G>A | p.Ala350Thr | p.A350T | Q8IXJ6 | protein_coding | tolerated(0.35) | benign(0.006) | TCGA-EA-A410-01 | Cervix | cervical & endocervical cancer | Female | <65 | I/II | Unknown | Unknown | SD |
| SIRT2 | SNV | Missense_Mutation | c.911N>A | p.Gly304Glu | p.G304E | Q8IXJ6 | protein_coding | tolerated(0.18) | benign(0.015) | TCGA-EA-A439-01 | Cervix | cervical & endocervical cancer | Female | <65 | I/II | Unknown | Unknown | PD | |
| SIRT2 | SNV | Missense_Mutation | c.94N>A | p.Ala32Thr | p.A32T | Q8IXJ6 | protein_coding | tolerated(0.46) | benign(0) | TCGA-AZ-4313-01 | Colorectum | colon adenocarcinoma | Female | <65 | I/II | Unknown | Unknown | SD | |
| SIRT2 | SNV | Missense_Mutation | rs200616294 | c.586N>A | p.Val196Ile | p.V196I | Q8IXJ6 | protein_coding | tolerated(0.52) | benign(0.001) | TCGA-CM-6162-01 | Colorectum | colon adenocarcinoma | Female | <65 | III/IV | Chemotherapy | oxaliplatin | SD |
| SIRT2 | SNV | Missense_Mutation | rs199856206 | c.383N>T | p.Pro128Leu | p.P128L | Q8IXJ6 | protein_coding | deleterious(0) | probably_damaging(1) | TCGA-D5-6530-01 | Colorectum | colon adenocarcinoma | Male | <65 | I/II | Unknown | Unknown | SD |
| SIRT2 | SNV | Missense_Mutation | c.389N>A | p.Pro130His | p.P130H | Q8IXJ6 | protein_coding | deleterious(0) | probably_damaging(0.999) | TCGA-AG-A00Y-01 | Colorectum | rectum adenocarcinoma | Male | >=65 | I/II | Unknown | Unknown | PD |
| Page: 1 2 3 4 5 |
Top |
Related drugs of malignant transformation related genes |
| Identification of chemicals and drugs interact with genes involved in malignant transfromation |
| (DGIdb 4.0) |
| Entrez ID | Symbol | Category | Interaction Types | Drug Claim Name | Drug Name | PMIDs |
| 22933 | SIRT2 | TRANSCRIPTION FACTOR BINDING, TUMOR SUPPRESSOR, DRUGGABLE GENOME, ENZYME, KINASE, TRANSCRIPTION FACTOR | ZINC915379 | |||
| 22933 | SIRT2 | TRANSCRIPTION FACTOR BINDING, TUMOR SUPPRESSOR, DRUGGABLE GENOME, ENZYME, KINASE, TRANSCRIPTION FACTOR | BDBM50363782 | |||
| 22933 | SIRT2 | TRANSCRIPTION FACTOR BINDING, TUMOR SUPPRESSOR, DRUGGABLE GENOME, ENZYME, KINASE, TRANSCRIPTION FACTOR | GW5074 | CHEMBL1794051 | 20030343 | |
| 22933 | SIRT2 | TRANSCRIPTION FACTOR BINDING, TUMOR SUPPRESSOR, DRUGGABLE GENOME, ENZYME, KINASE, TRANSCRIPTION FACTOR | US9359293, TM | |||
| 22933 | SIRT2 | TRANSCRIPTION FACTOR BINDING, TUMOR SUPPRESSOR, DRUGGABLE GENOME, ENZYME, KINASE, TRANSCRIPTION FACTOR | BDBM50363773 | |||
| 22933 | SIRT2 | TRANSCRIPTION FACTOR BINDING, TUMOR SUPPRESSOR, DRUGGABLE GENOME, ENZYME, KINASE, TRANSCRIPTION FACTOR | inhibitor | 249565779 | ||
| 22933 | SIRT2 | TRANSCRIPTION FACTOR BINDING, TUMOR SUPPRESSOR, DRUGGABLE GENOME, ENZYME, KINASE, TRANSCRIPTION FACTOR | AC1LOJYQ | |||
| 22933 | SIRT2 | TRANSCRIPTION FACTOR BINDING, TUMOR SUPPRESSOR, DRUGGABLE GENOME, ENZYME, KINASE, TRANSCRIPTION FACTOR | US9359293, TB | |||
| 22933 | SIRT2 | TRANSCRIPTION FACTOR BINDING, TUMOR SUPPRESSOR, DRUGGABLE GENOME, ENZYME, KINASE, TRANSCRIPTION FACTOR | AC1LFGWU | |||
| 22933 | SIRT2 | TRANSCRIPTION FACTOR BINDING, TUMOR SUPPRESSOR, DRUGGABLE GENOME, ENZYME, KINASE, TRANSCRIPTION FACTOR | TRICHOSTATIN | TRICHOSTATIN | 20030343,17149860 |
| Page: 1 2 |

Copyright 2023-Present -The University of Texas Health Science Center at Houston |