Schematic overview of the cellular and molecular mechanisms involved in the cancer progression, including the proposed cellular and molecular mechanisms in cancer cells trajectory. AT1: alveolar type 1 cells; AT2: alveolar type 2 cells; AAH: atypical adenomatous hyperplasia; AIS: adenocarcinoma in situ; MIA: minimally invasive adenocarcinoma; IA: invasive adenocarcinoma; EMT: epithelial-mesenchymal transition

Home

Download

Statistics

Help

Contact

Center for Computational Systems Medicine
leaf

Gene summary

leaf

Malignant transformation analysis

leaf

Malignant transformation related pathway analysis

leaf

Cell-cell communication analysis

leaf

Single-cell gene regulatory network inference analysis

leaf

Somatic mutation of malignant transformation related genes

leaf

Related drugs of malignant transformation related genes

Gene: SH3BP1

Gene summary for SH3BP1

check button Gene summary.

Gene informationSpeciesHuman
Gene symbol

SH3BP1

Gene ID

23616

Gene nameSH3 domain binding protein 1
Gene AliasARHGAP43
Cytomap22q13.1
Gene Typeprotein-coding
GO ID

GO:0001667

UniProtAcc

Q9Y3L3


Top

Malignant transformation analysis

check button Identification of the aberrant gene expression in precancerous and cancerous lesions by comparing the gene expression of stem-like cells in diseased tissues with normal stem cells
check button Malignant transformation involving gene list.
Entrez IDSymbolReplicatesSpeciesOrganTissueAdj P-valueLog2FCMalignancy
23616SH3BP1HTA11_3410_2000001011HumanColorectumAD2.84e-041.21e-010.0155
23616SH3BP1HTA11_2487_2000001011HumanColorectumSER3.70e-092.48e-01-0.1808
23616SH3BP1HTA11_1938_2000001011HumanColorectumAD8.58e-133.80e-01-0.0811
23616SH3BP1HTA11_78_2000001011HumanColorectumAD1.84e-031.43e-01-0.1088
23616SH3BP1HTA11_347_2000001011HumanColorectumAD8.14e-122.38e-01-0.1954
23616SH3BP1HTA11_3361_2000001011HumanColorectumAD1.41e-082.76e-01-0.1207
23616SH3BP1HTA11_83_2000001011HumanColorectumSER1.79e-041.89e-01-0.1526
23616SH3BP1HTA11_696_2000001011HumanColorectumAD5.26e-163.63e-01-0.1464
23616SH3BP1HTA11_866_2000001011HumanColorectumAD1.85e-082.15e-01-0.1001
23616SH3BP1HTA11_1391_2000001011HumanColorectumAD6.55e-215.27e-01-0.059
23616SH3BP1HTA11_2992_2000001011HumanColorectumSER2.44e-093.99e-01-0.1706
23616SH3BP1HTA11_5212_2000001011HumanColorectumAD8.16e-073.20e-01-0.2061
23616SH3BP1HTA11_546_2000001011HumanColorectumAD2.42e-103.45e-01-0.0842
23616SH3BP1HTA11_866_3004761011HumanColorectumAD9.76e-051.64e-010.096
23616SH3BP1HTA11_8622_2000001021HumanColorectumSER3.19e-021.60e-010.0528
23616SH3BP1HTA11_10623_2000001011HumanColorectumAD9.21e-083.16e-01-0.0177
23616SH3BP1HTA11_6801_2000001011HumanColorectumSER1.64e-053.27e-010.0171
23616SH3BP1HTA11_10711_2000001011HumanColorectumAD1.28e-041.62e-010.0338
23616SH3BP1HTA11_7696_3000711011HumanColorectumAD2.85e-072.46e-010.0674
23616SH3BP1HTA11_7469_2000001011HumanColorectumAD2.39e-033.72e-01-0.0124
Page: 1 2 3 4 5 6 

check button Transcriptomic changes along malignancy continuum.
TissueExpression DynamicsAbbreviation
Colorectum (GSE201348)The image shows the transcriptomic changes along malignancy continuum.log2FC in expression of this searched gene in stem-like cells from each diseased tissue sample relative to stem-like cells in normal samples in each tissue plotted against the malignancy continuum. Samples are colored based on if they are from different disease stage.FAP: Familial adenomatous polyposis
CRC: Colorectal cancer
Colorectum (HTA11)The image shows the transcriptomic changes along malignancy continuum.log2FC in expression of this searched gene in stem-like cells from each diseased tissue sample relative to stem-like cells in normal samples in each tissue plotted against the malignancy continuum. Samples are colored based on if they are from different disease stage.AD: Adenomas
SER: Sessile serrated lesions
MSI-H: Microsatellite-high colorectal cancer
MSS: Microsatellite stable colorectal cancer
EsophagusThe image shows the transcriptomic changes along malignancy continuum.log2FC in expression of this searched gene in stem-like cells from each diseased tissue sample relative to stem-like cells in normal samples in each tissue plotted against the malignancy continuum. Samples are colored based on if they are from different disease stage.
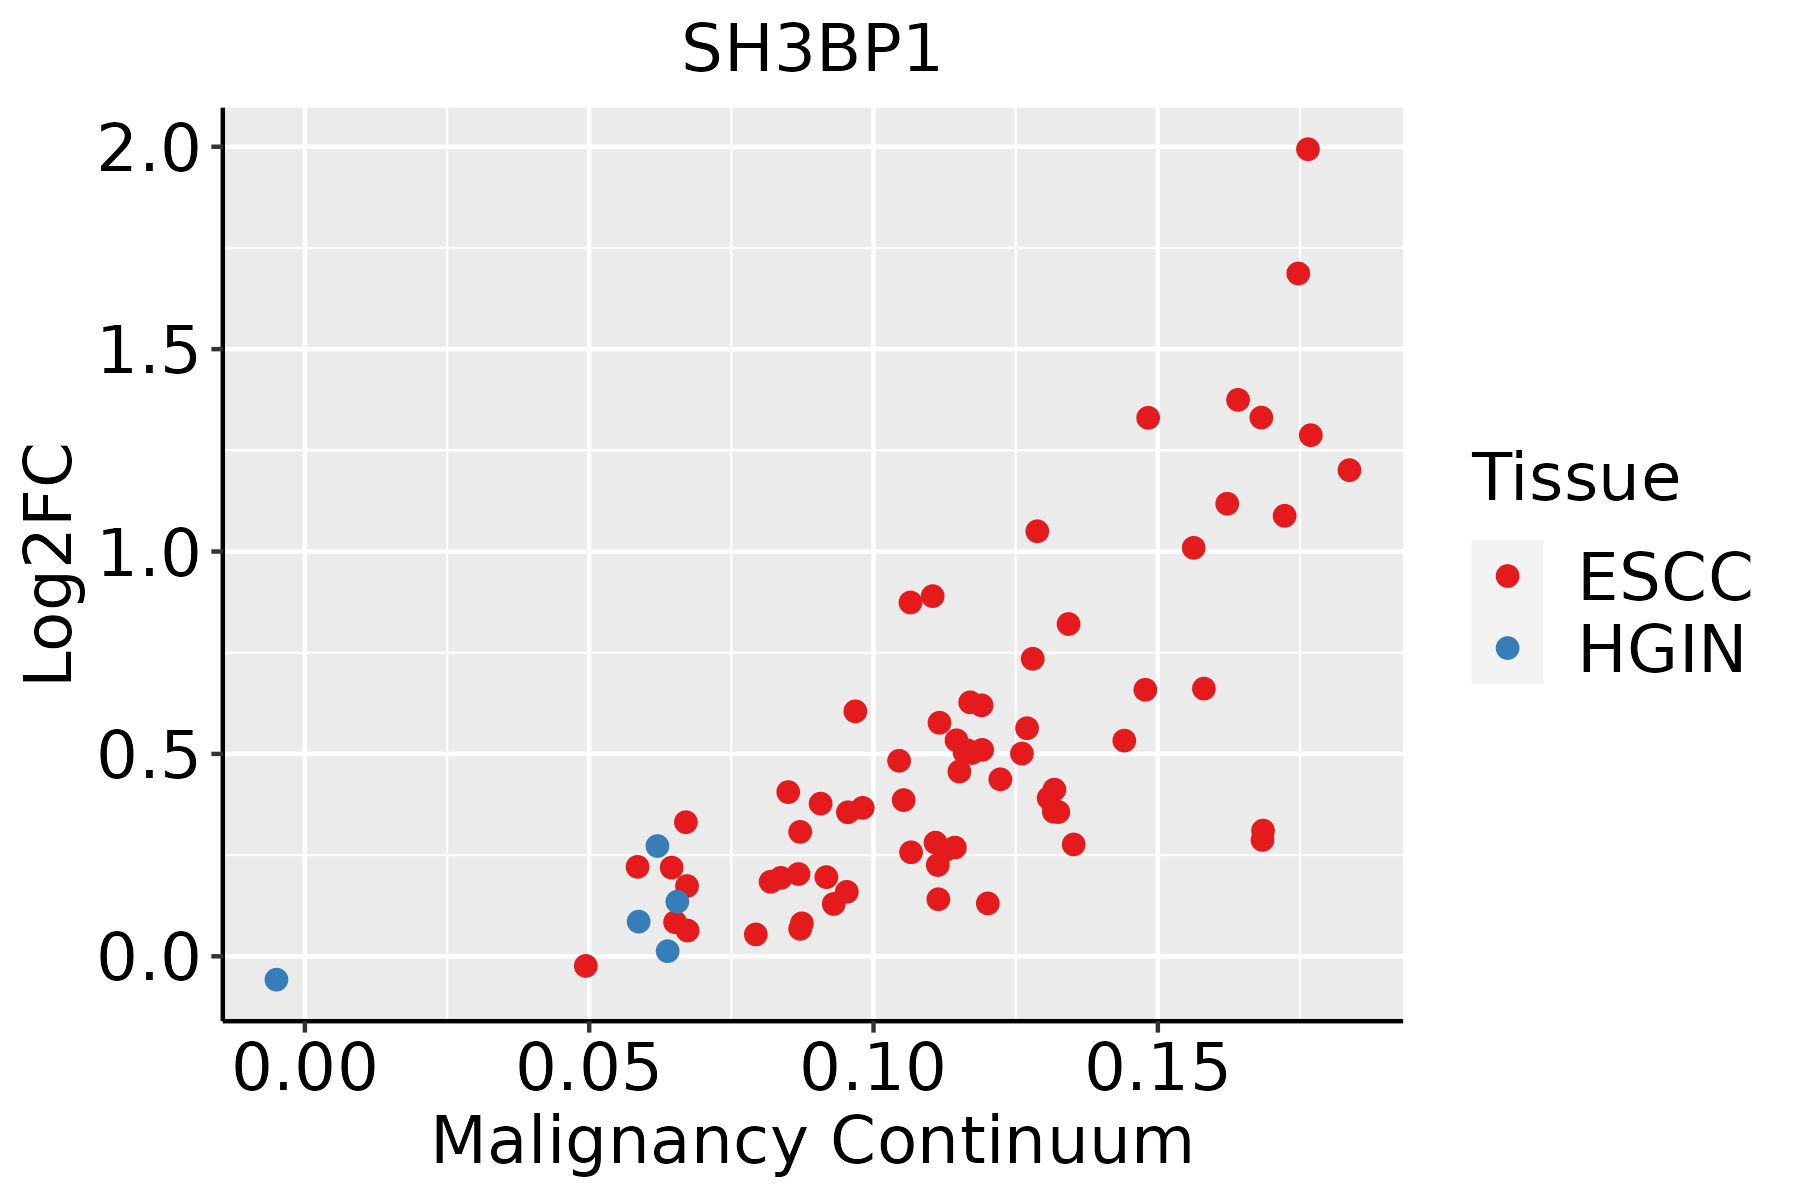
ESCC: Esophageal squamous cell carcinoma
HGIN: High-grade intraepithelial neoplasias
LGIN: Low-grade intraepithelial neoplasias
Oral CavityThe image shows the transcriptomic changes along malignancy continuum.log2FC in expression of this searched gene in stem-like cells from each diseased tissue sample relative to stem-like cells in normal samples in each tissue plotted against the malignancy continuum. Samples are colored based on if they are from different disease stage.
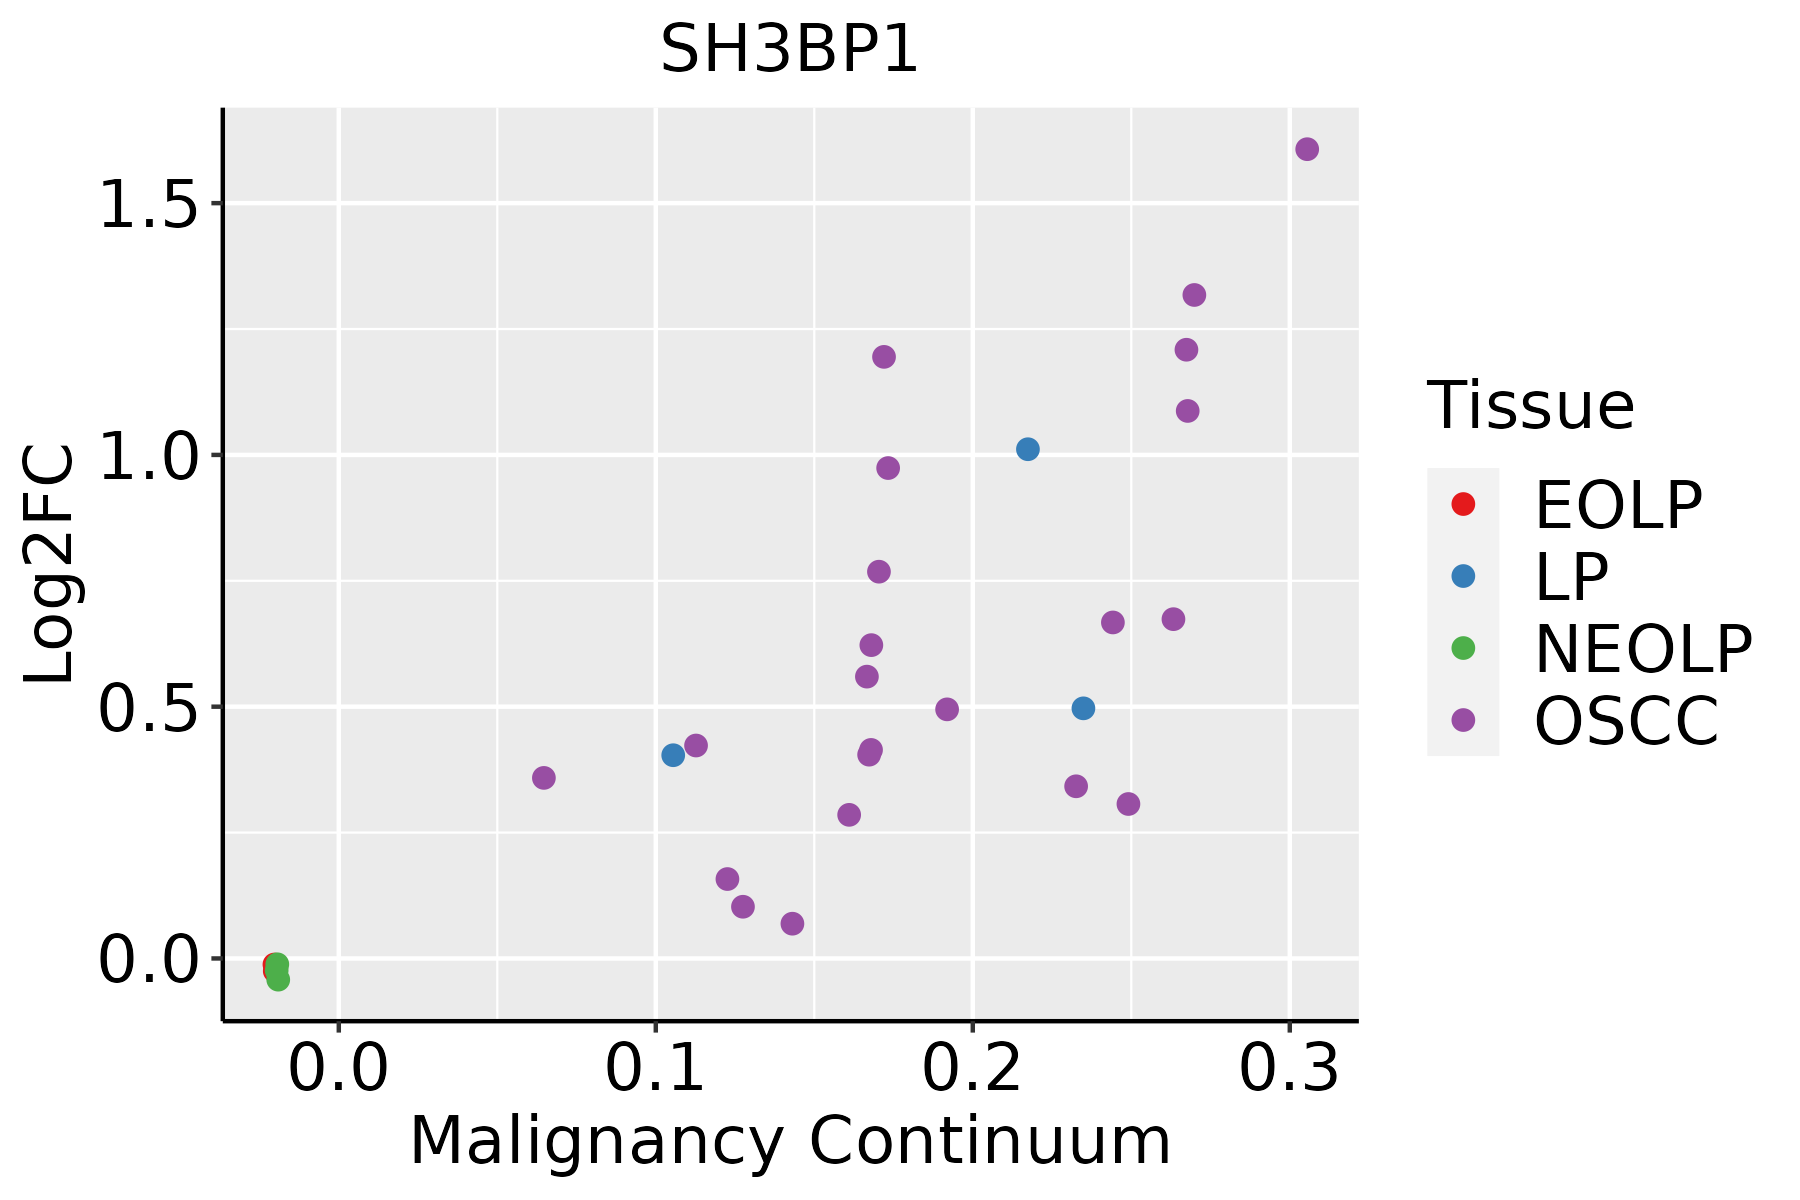
EOLP: Erosive Oral lichen planus
LP: leukoplakia
NEOLP: Non-erosive oral lichen planus
OSCC: Oral squamous cell carcinoma
SkinThe image shows the transcriptomic changes along malignancy continuum.log2FC in expression of this searched gene in stem-like cells from each diseased tissue sample relative to stem-like cells in normal samples in each tissue plotted against the malignancy continuum. Samples are colored based on if they are from different disease stage.
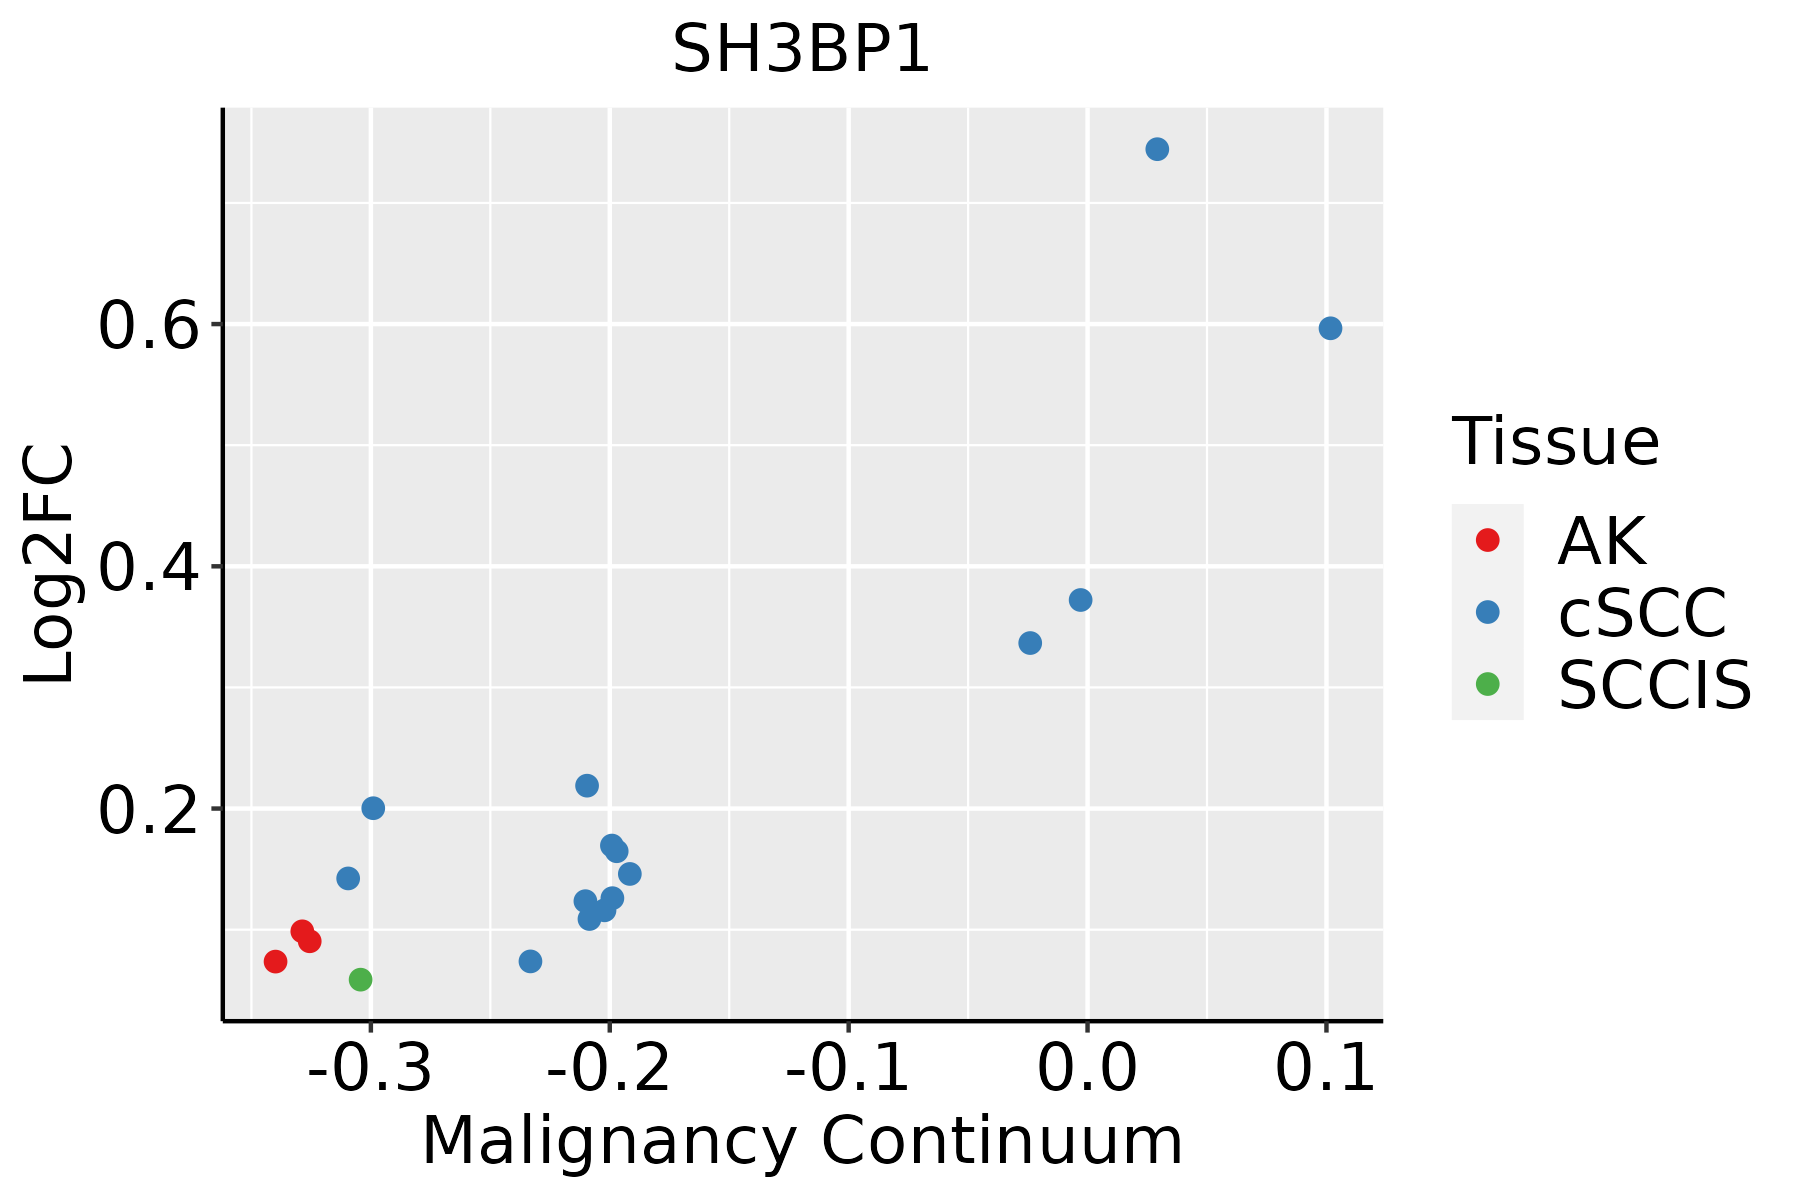
AK: Actinic keratosis
cSCC: Cutaneous squamous cell carcinoma
SCCIS:squamous cell carcinoma in situ
∗log2FC in expression of this searched gene in stem-like cells from each diseased tissue sample relative to stem-like cells in normal samples in each tissue plotted against the malignancy continuum. Samples are colored based on if they are from different disease stage.

Top

Malignant transformation related pathway analysis

check buttonFind out the enriched GO biological processes and KEGG pathways involved in transition from healthy to precancer to cancer
check button Figure of enriched GO biological processes.
TissueDisease StageEnriched GO biological Processes
ColorectumADGO analysis - Figure of enriched GO biological processes: Top 15 enriched GO BP terms are showed in the bar plot of each disease state in each tissue. Each row represents a significant GO biological process which is colored according to the -log10(p.adjust).
ColorectumSERGO analysis - Figure of enriched GO biological processes: Top 15 enriched GO BP terms are showed in the bar plot of each disease state in each tissue. Each row represents a significant GO biological process which is colored according to the -log10(p.adjust).
ColorectumMSSGO analysis - Figure of enriched GO biological processes: Top 15 enriched GO BP terms are showed in the bar plot of each disease state in each tissue. Each row represents a significant GO biological process which is colored according to the -log10(p.adjust).
ColorectumMSI-HGO analysis - Figure of enriched GO biological processes: Top 15 enriched GO BP terms are showed in the bar plot of each disease state in each tissue. Each row represents a significant GO biological process which is colored according to the -log10(p.adjust).
ColorectumFAPGO analysis - Figure of enriched GO biological processes: Top 15 enriched GO BP terms are showed in the bar plot of each disease state in each tissue. Each row represents a significant GO biological process which is colored according to the -log10(p.adjust).
∗Top 15 enriched GO BP terms are showed in the bar plot of each disease state in each tissue. Each row represents a significant GO biological process which is colored according to the -log10(p.adjust).
Page: 1 2 3 4 5 6 7 8 9 

check button Enriched GO biological processes.
GO IDTissueDisease StageDescriptionGene RatioBg Ratiopvaluep.adjustCount
GO:00451971ColorectumSERestablishment or maintenance of epithelial cell apical/basal polarity16/289744/187235.64e-047.83e-0316
GO:00430871ColorectumSERregulation of GTPase activity77/2897348/187235.90e-048.07e-0377
GO:00350881ColorectumSERestablishment or maintenance of apical/basal cell polarity17/289749/187237.17e-049.44e-0317
GO:00612451ColorectumSERestablishment or maintenance of bipolar cell polarity17/289749/187237.17e-049.44e-0317
GO:00300101ColorectumSERestablishment of cell polarity37/2897143/187238.72e-041.06e-0237
GO:00512611ColorectumSERprotein depolymerization31/2897114/187239.18e-041.11e-0231
GO:19018791ColorectumSERregulation of protein depolymerization24/289787/187232.69e-032.44e-0224
GO:00435421ColorectumSERendothelial cell migration61/2897279/187232.76e-032.47e-0261
GO:00432441ColorectumSERregulation of protein-containing complex disassembly30/2897121/187235.03e-033.88e-0230
GO:00070152ColorectumMSSactin filament organization146/3467442/187231.16e-132.67e-11146
GO:00325352ColorectumMSSregulation of cellular component size127/3467383/187233.44e-125.79e-10127
GO:00329702ColorectumMSSregulation of actin filament-based process128/3467397/187232.47e-113.49e-09128
GO:19029032ColorectumMSSregulation of supramolecular fiber organization121/3467383/187233.63e-103.28e-08121
GO:00081542ColorectumMSSactin polymerization or depolymerization79/3467218/187234.14e-103.49e-0879
GO:00080642ColorectumMSSregulation of actin polymerization or depolymerization70/3467188/187231.06e-098.25e-0870
GO:00308322ColorectumMSSregulation of actin filament length70/3467189/187231.38e-091.03e-0770
GO:00329562ColorectumMSSregulation of actin cytoskeleton organization113/3467358/187231.46e-091.07e-07113
GO:01100532ColorectumMSSregulation of actin filament organization92/3467278/187233.61e-092.42e-0792
GO:00224112ColorectumMSScellular component disassembly130/3467443/187231.44e-088.46e-07130
GO:00071632ColorectumMSSestablishment or maintenance of cell polarity72/3467218/187231.90e-078.30e-0672
Page: 1 2 3 4 5 6 7 8 9 10 11 

check button Enriched KEGG pathways.
Pathway IDTissueDisease StageDescriptionGene RatioBg Ratiopvaluep.adjustqvalueCount
Page: 1 

Top

Cell-cell communication analysis

check buttonIdentification of potential cell-cell interactions between two cell types and their ligand-receptor pairs for different disease states
LigandReceptorLRpairPathwayTissueDisease Stage
Page: 1 

Top

Single-cell gene regulatory network inference analysis

check buttonFind out the significant the regulons (TFs) and the target genes of each regulon across cell types for different disease states
TFCell TypeTissueDisease StageTarget GeneRSSRegulon Activity
∗The dot plots of a searched regulon are shown for all cell subpopulations in each disease state of each tissue based on the regulon specific score inferred using pySCENIC and by calculating the average expression.
Page: 1 

Top

Somatic mutation of malignant transformation related genes

check buttonAnnotation of somatic variants for genes involved in malignant transformation
Hugo SymbolVariant ClassVariant ClassificationdbSNP RSHGVScHGVSpHGVSp ShortSWISSPROTBIOTYPESIFTPolyPhenTumor Sample BarcodeTissueHistologySexAgeStageTherapy TypesDrugsOutcome
SH3BP1SNVMissense_Mutationc.147C>Gp.Ile49Metp.I49MQ9Y3L3protein_codingdeleterious(0.02)possibly_damaging(0.541)TCGA-AN-A0XP-01Breastbreast invasive carcinomaFemale>=65III/IVUnknownUnknownSD
SH3BP1SNVMissense_Mutationc.532A>Gp.Ser178Glyp.S178GQ9Y3L3protein_codingtolerated(0.33)benign(0.015)TCGA-D8-A1XK-01Breastbreast invasive carcinomaFemale<65I/IIChemotherapydoxorubicine+cyclophosphamideSD
SH3BP1SNVMissense_Mutationnovelc.1623A>Cp.Arg541Serp.R541SQ9Y3L3protein_codingdeleterious(0.04)benign(0.01)TCGA-E2-A1L8-01Breastbreast invasive carcinomaFemale<65I/IIChemotherapycyclophosphamideSD
SH3BP1insertionIn_Frame_Insnovelc.1105_1106insGTTCTGCTCCGACCCGCACGCp.Met369delinsSerSerAlaProThrArgThrLeup.M369delinsSSAPTRTLQ9Y3L3protein_codingTCGA-A7-A0D9-01Breastbreast invasive carcinomaFemale<65I/IIChemotherapytaxotereSD
SH3BP1insertionIn_Frame_Insnovelc.705_706insTCGATGGGCAGGp.Ala235_Asp236insSerMetGlyArgp.A235_D236insSMGRQ9Y3L3protein_codingTCGA-A8-A093-01Breastbreast invasive carcinomaFemale<65I/IIHormone TherapytamoxiphenSD
SH3BP1insertionNonsense_Mutationnovelc.630_631insAAGAATGACTGAATGGTGAATAACAGGTCACTGTp.Ala211LysfsTer4p.A211Kfs*4Q9Y3L3protein_codingTCGA-A8-A09W-01Breastbreast invasive carcinomaFemale>=65III/IVUnknownUnknownSD
SH3BP1SNVMissense_Mutationnovelc.552N>Ap.Met184Ilep.M184IQ9Y3L3protein_codingtolerated(0.14)benign(0.001)TCGA-2W-A8YY-01Cervixcervical & endocervical cancerFemale<65I/IIChemotherapycisplatinCR
SH3BP1SNVMissense_Mutationrs754015130c.1372N>Ap.Val458Ilep.V458IQ9Y3L3protein_codingtolerated(0.82)benign(0.153)TCGA-EA-A3HS-01Cervixcervical & endocervical cancerFemale<65I/IIUnknownUnknownSD
SH3BP1SNVMissense_Mutationnovelc.307G>Ap.Ala103Thrp.A103TQ9Y3L3protein_codingtolerated(0.46)benign(0.253)TCGA-EA-A410-01Cervixcervical & endocervical cancerFemale<65I/IIUnknownUnknownSD
SH3BP1SNVMissense_Mutationc.1537N>Ap.Pro513Thrp.P513TQ9Y3L3protein_codingtolerated(0.18)benign(0.031)TCGA-IR-A3LA-01Cervixcervical & endocervical cancerFemale<65I/IIChemotherapycisplatinCR
Page: 1 2 3 4 5 

Top

Related drugs of malignant transformation related genes

check buttonIdentification of chemicals and drugs interact with genes involved in malignant transfromation
(DGIdb 4.0)
Entrez IDSymbolCategoryInteraction TypesDrug Claim NameDrug NamePMIDs
Page: 1