
|
|||||
|
 | |
| |
| |
| |
| |
| |
|
Gene: SF3A1 |
Gene summary for SF3A1 |
| Gene information | Species | Human | Gene symbol | SF3A1 | Gene ID | 10291 |
| Gene name | splicing factor 3a subunit 1 | |
| Gene Alias | PRP21 | |
| Cytomap | 22q12.2 | |
| Gene Type | protein-coding | GO ID | GO:0000245 | UniProtAcc | A0A024R1K8 |
Top |
Malignant transformation analysis |
| Identification of the aberrant gene expression in precancerous and cancerous lesions by comparing the gene expression of stem-like cells in diseased tissues with normal stem cells |
| Entrez ID | Symbol | Replicates | Species | Organ | Tissue | Adj P-value | Log2FC | Malignancy |
| 10291 | SF3A1 | HTA11_2487_2000001011 | Human | Colorectum | SER | 1.66e-05 | 3.08e-01 | -0.1808 |
| 10291 | SF3A1 | HTA11_1938_2000001011 | Human | Colorectum | AD | 1.32e-06 | 4.35e-01 | -0.0811 |
| 10291 | SF3A1 | HTA11_78_2000001011 | Human | Colorectum | AD | 5.55e-06 | 4.03e-01 | -0.1088 |
| 10291 | SF3A1 | HTA11_347_2000001011 | Human | Colorectum | AD | 1.96e-21 | 5.48e-01 | -0.1954 |
| 10291 | SF3A1 | HTA11_3361_2000001011 | Human | Colorectum | AD | 3.38e-02 | 3.06e-01 | -0.1207 |
| 10291 | SF3A1 | HTA11_83_2000001011 | Human | Colorectum | SER | 2.35e-03 | 3.20e-01 | -0.1526 |
| 10291 | SF3A1 | HTA11_696_2000001011 | Human | Colorectum | AD | 7.10e-10 | 3.41e-01 | -0.1464 |
| 10291 | SF3A1 | HTA11_866_2000001011 | Human | Colorectum | AD | 3.39e-06 | 2.77e-01 | -0.1001 |
| 10291 | SF3A1 | HTA11_1391_2000001011 | Human | Colorectum | AD | 1.92e-11 | 5.00e-01 | -0.059 |
| 10291 | SF3A1 | HTA11_2992_2000001011 | Human | Colorectum | SER | 3.81e-02 | 4.42e-01 | -0.1706 |
| 10291 | SF3A1 | HTA11_5216_2000001011 | Human | Colorectum | SER | 9.31e-03 | 3.77e-01 | -0.1462 |
| 10291 | SF3A1 | HTA11_546_2000001011 | Human | Colorectum | AD | 1.79e-02 | 3.24e-01 | -0.0842 |
| 10291 | SF3A1 | HTA11_866_3004761011 | Human | Colorectum | AD | 2.22e-15 | 4.50e-01 | 0.096 |
| 10291 | SF3A1 | HTA11_8622_2000001021 | Human | Colorectum | SER | 1.29e-05 | 4.46e-01 | 0.0528 |
| 10291 | SF3A1 | HTA11_7663_2000001011 | Human | Colorectum | SER | 3.17e-04 | 3.67e-01 | 0.0131 |
| 10291 | SF3A1 | HTA11_6801_2000001011 | Human | Colorectum | SER | 1.26e-03 | 5.82e-01 | 0.0171 |
| 10291 | SF3A1 | HTA11_7696_3000711011 | Human | Colorectum | AD | 3.31e-12 | 4.02e-01 | 0.0674 |
| 10291 | SF3A1 | HTA11_6818_2000001011 | Human | Colorectum | AD | 1.94e-03 | 3.30e-01 | 0.0112 |
| 10291 | SF3A1 | HTA11_7469_2000001011 | Human | Colorectum | AD | 5.87e-03 | 6.08e-01 | -0.0124 |
| 10291 | SF3A1 | HTA11_99999970781_79442 | Human | Colorectum | MSS | 4.97e-09 | 3.53e-01 | 0.294 |
| Page: 1 2 3 4 5 6 7 |
| Tissue | Expression Dynamics | Abbreviation |
| Colorectum (GSE201348) |  | FAP: Familial adenomatous polyposis |
| CRC: Colorectal cancer | ||
| Colorectum (HTA11) |  | AD: Adenomas |
| SER: Sessile serrated lesions | ||
| MSI-H: Microsatellite-high colorectal cancer | ||
| MSS: Microsatellite stable colorectal cancer | ||
| Esophagus | 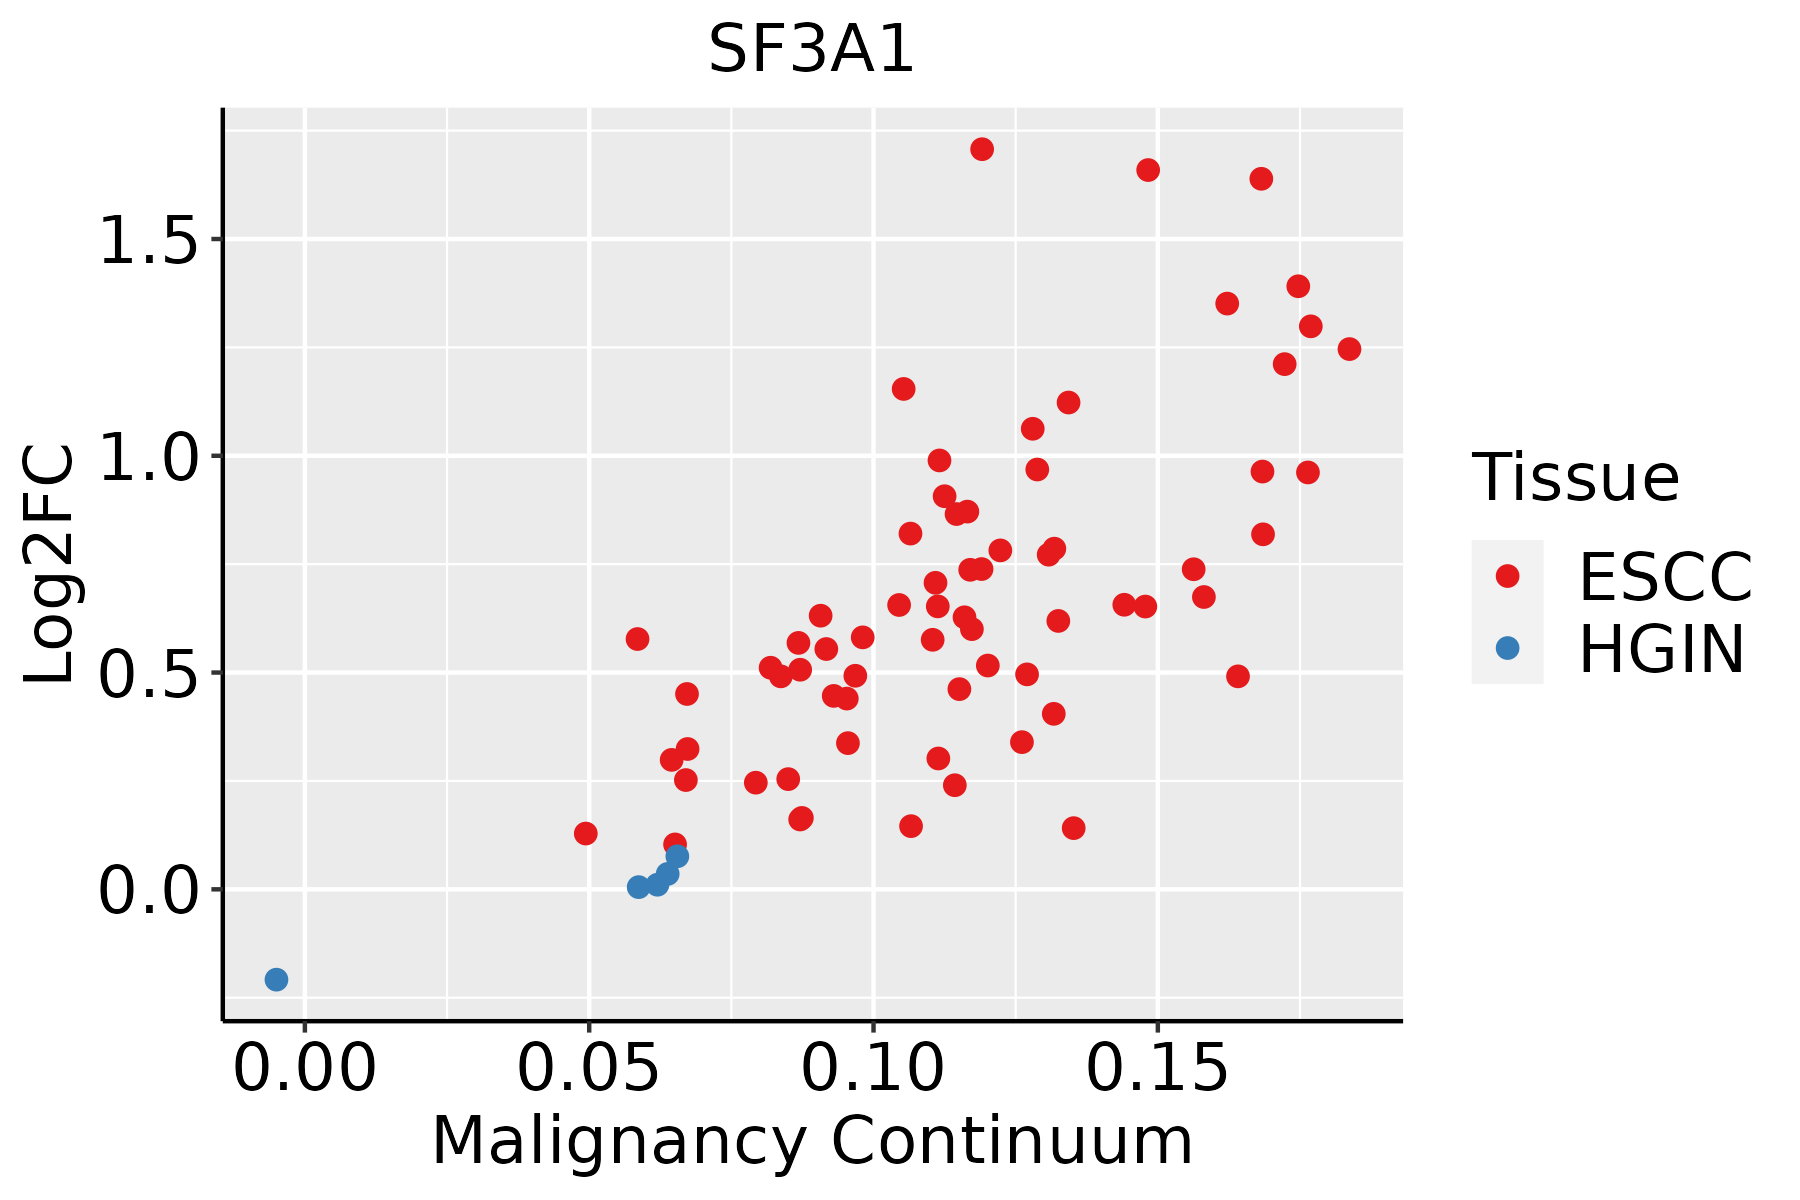 | ESCC: Esophageal squamous cell carcinoma |
| HGIN: High-grade intraepithelial neoplasias | ||
| LGIN: Low-grade intraepithelial neoplasias | ||
| Liver | 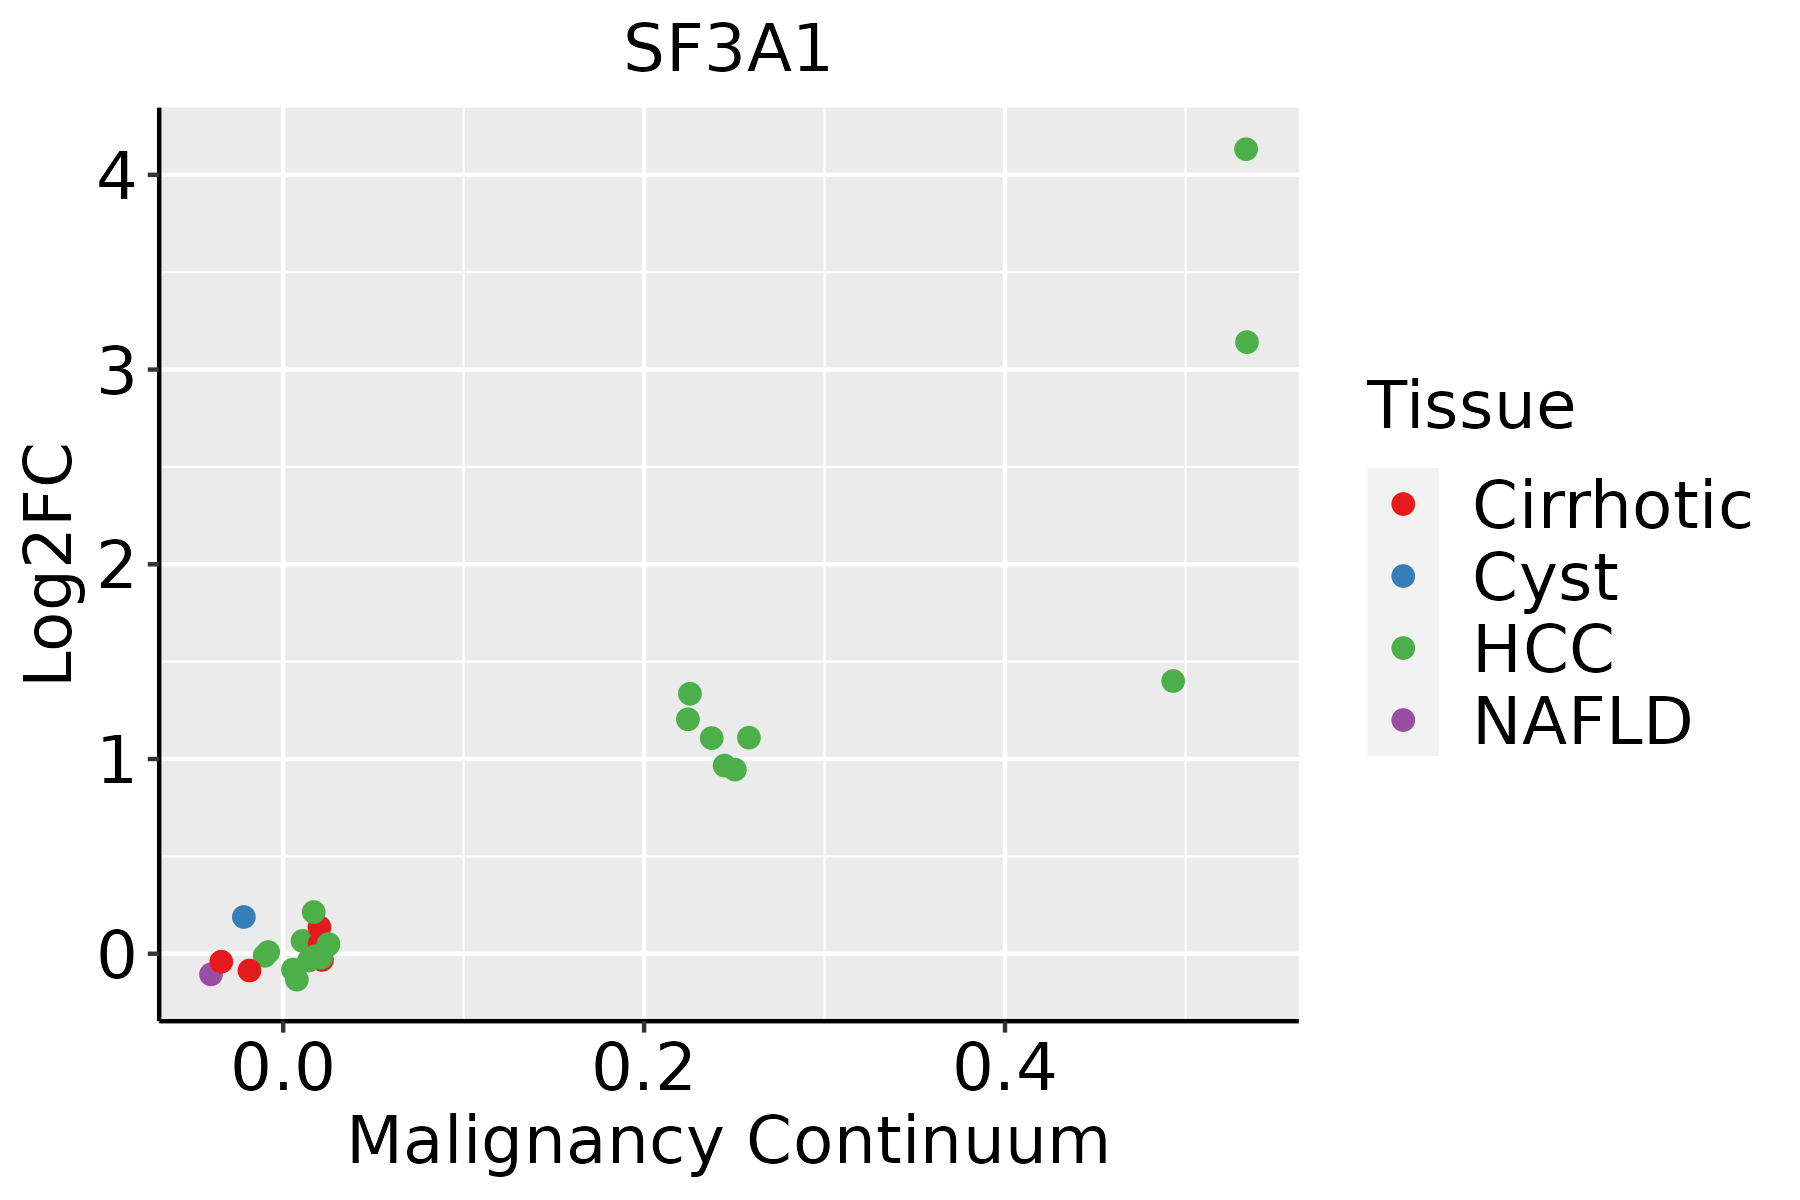 | HCC: Hepatocellular carcinoma |
| NAFLD: Non-alcoholic fatty liver disease | ||
| Oral Cavity |  | EOLP: Erosive Oral lichen planus |
| LP: leukoplakia | ||
| NEOLP: Non-erosive oral lichen planus | ||
| OSCC: Oral squamous cell carcinoma | ||
| Prostate | 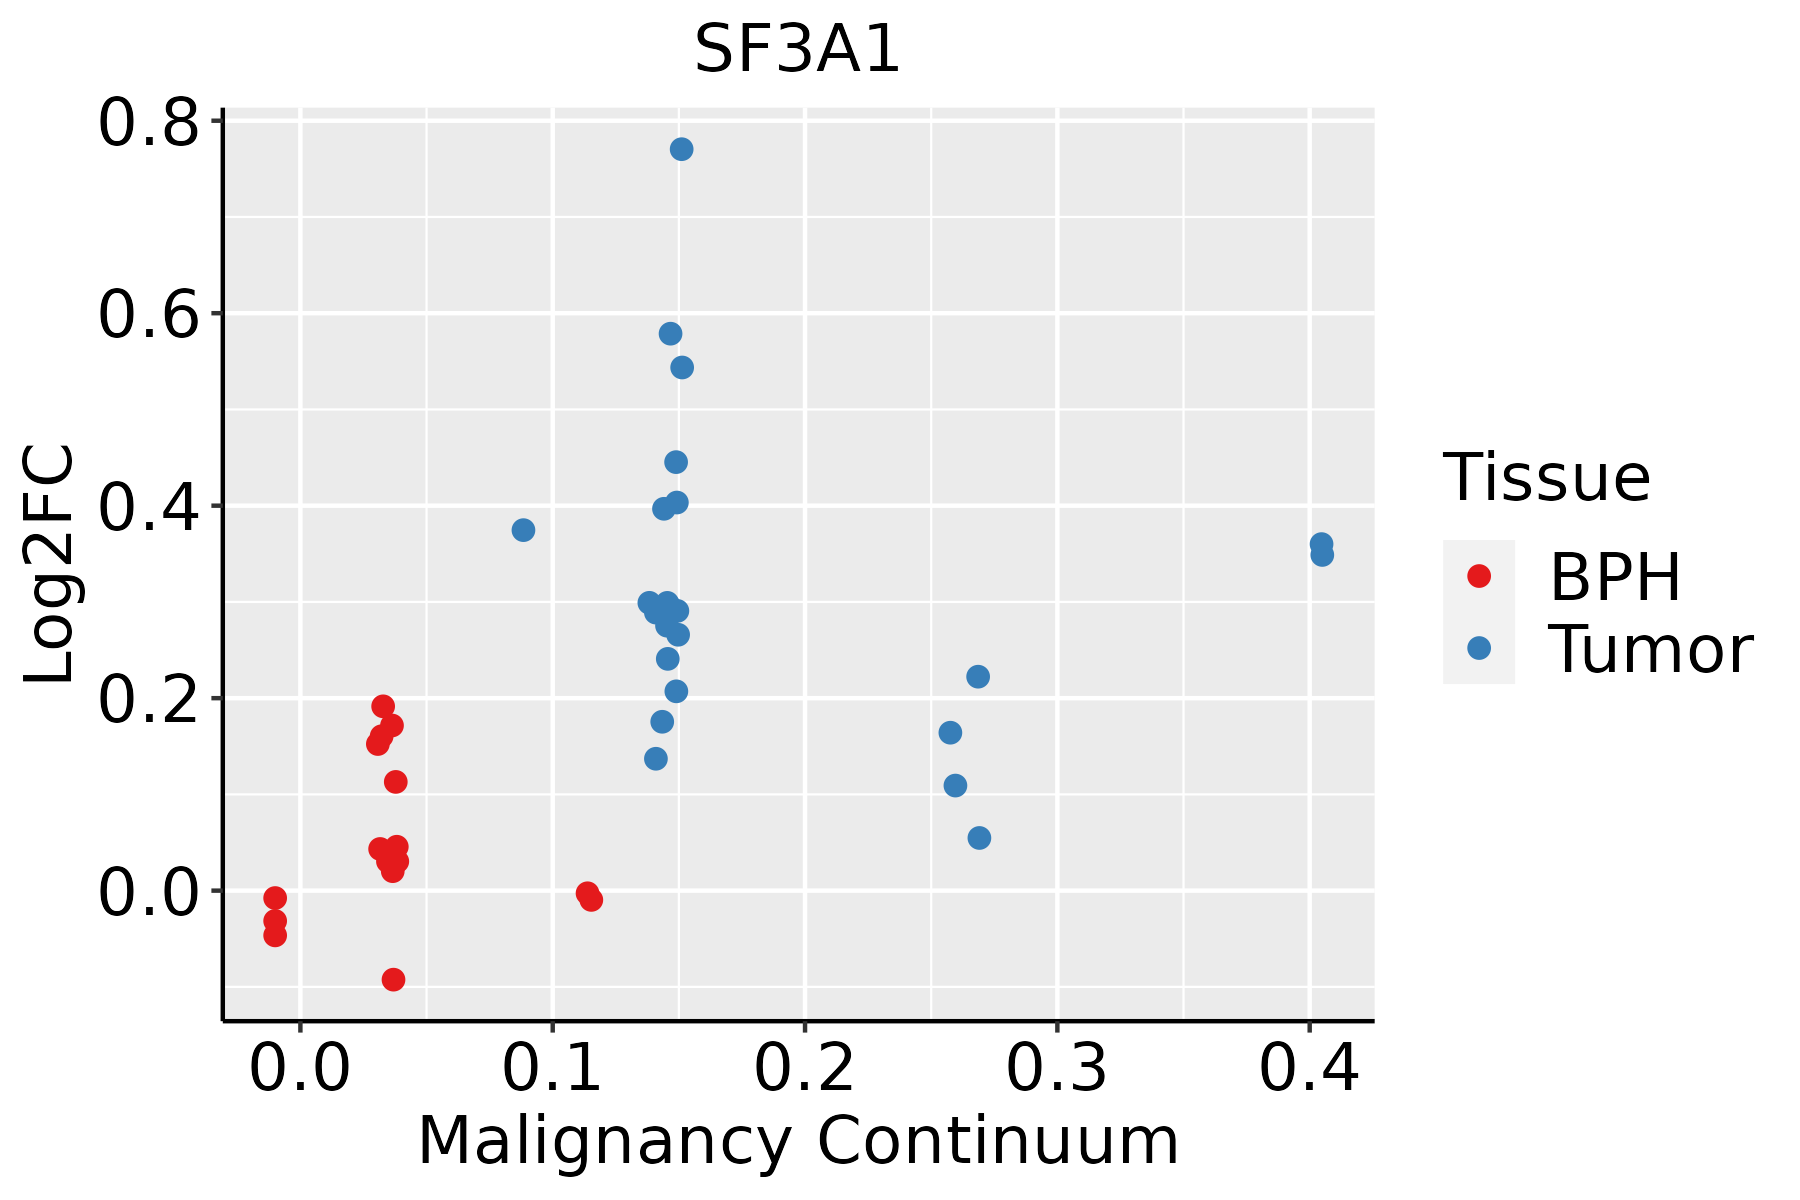 | BPH: Benign Prostatic Hyperplasia |
| Skin | 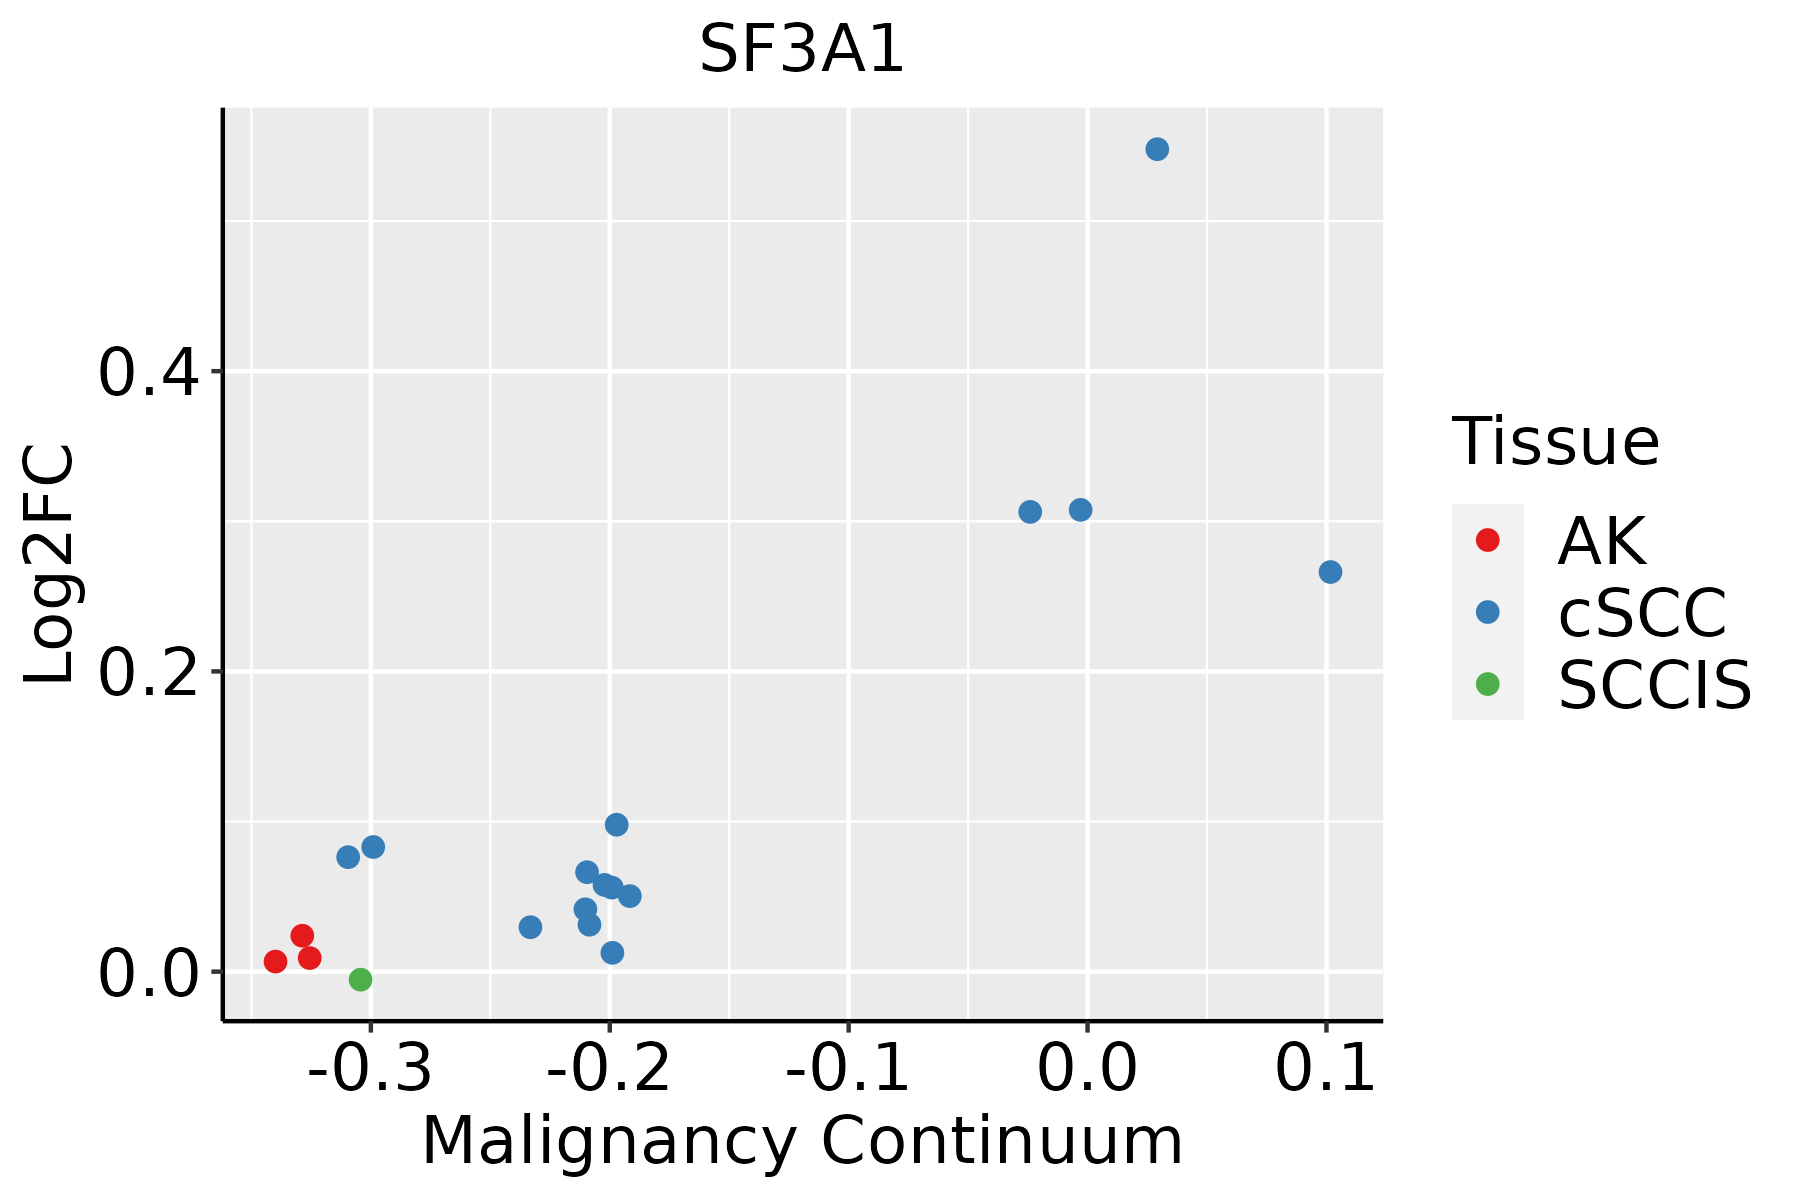 | AK: Actinic keratosis |
| cSCC: Cutaneous squamous cell carcinoma | ||
| SCCIS:squamous cell carcinoma in situ |
| ∗log2FC in expression of this searched gene in stem-like cells from each diseased tissue sample relative to stem-like cells in normal samples in each tissue plotted against the malignancy continuum. Samples are colored based on if they are from different disease stage. |
Top |
Malignant transformation related pathway analysis |
| Find out the enriched GO biological processes and KEGG pathways involved in transition from healthy to precancer to cancer |
| Tissue | Disease Stage | Enriched GO biological Processes |
| Colorectum | AD |  |
| Colorectum | SER |  |
| Colorectum | MSS |  |
| Colorectum | MSI-H |  |
| Colorectum | FAP |  |
| ∗Top 15 enriched GO BP terms are showed in the bar plot of each disease state in each tissue. Each row represents a significant GO biological process which is colored according to the -log10(p.adjust). |
| Page: 1 2 3 4 5 6 7 8 9 |
| GO ID | Tissue | Disease Stage | Description | Gene Ratio | Bg Ratio | pvalue | p.adjust | Count |
| GO:0000375110 | Oral cavity | LP | RNA splicing, via transesterification reactions | 181/4623 | 324/18723 | 1.36e-33 | 1.70e-30 | 181 |
| GO:0000377110 | Oral cavity | LP | RNA splicing, via transesterification reactions with bulged adenosine as nucleophile | 179/4623 | 320/18723 | 2.48e-33 | 2.22e-30 | 179 |
| GO:0000398110 | Oral cavity | LP | mRNA splicing, via spliceosome | 179/4623 | 320/18723 | 2.48e-33 | 2.22e-30 | 179 |
| GO:0071826110 | Oral cavity | LP | ribonucleoprotein complex subunit organization | 130/4623 | 227/18723 | 7.54e-26 | 3.63e-23 | 130 |
| GO:0022618110 | Oral cavity | LP | ribonucleoprotein complex assembly | 125/4623 | 220/18723 | 1.76e-24 | 6.91e-22 | 125 |
| GO:000024513 | Oral cavity | LP | spliceosomal complex assembly | 34/4623 | 79/18723 | 2.65e-04 | 2.75e-03 | 34 |
| GO:000838019 | Prostate | Tumor | RNA splicing | 153/3246 | 434/18723 | 9.15e-20 | 5.79e-17 | 153 |
| GO:002261319 | Prostate | Tumor | ribonucleoprotein complex biogenesis | 159/3246 | 463/18723 | 3.17e-19 | 1.52e-16 | 159 |
| GO:000037518 | Prostate | Tumor | RNA splicing, via transesterification reactions | 119/3246 | 324/18723 | 3.40e-17 | 1.06e-14 | 119 |
| GO:000037718 | Prostate | Tumor | RNA splicing, via transesterification reactions with bulged adenosine as nucleophile | 117/3246 | 320/18723 | 9.31e-17 | 2.22e-14 | 117 |
| GO:000039818 | Prostate | Tumor | mRNA splicing, via spliceosome | 117/3246 | 320/18723 | 9.31e-17 | 2.22e-14 | 117 |
| GO:007182619 | Prostate | Tumor | ribonucleoprotein complex subunit organization | 91/3246 | 227/18723 | 3.62e-16 | 7.50e-14 | 91 |
| GO:002261819 | Prostate | Tumor | ribonucleoprotein complex assembly | 89/3246 | 220/18723 | 3.94e-16 | 7.89e-14 | 89 |
| GO:000024512 | Prostate | Tumor | spliceosomal complex assembly | 26/3246 | 79/18723 | 5.68e-04 | 4.11e-03 | 26 |
| GO:002261329 | Skin | cSCC | ribonucleoprotein complex biogenesis | 302/4864 | 463/18723 | 5.13e-72 | 3.22e-68 | 302 |
| GO:0008380112 | Skin | cSCC | RNA splicing | 263/4864 | 434/18723 | 2.45e-53 | 5.13e-50 | 263 |
| GO:0000375112 | Skin | cSCC | RNA splicing, via transesterification reactions | 201/4864 | 324/18723 | 4.07e-43 | 5.10e-40 | 201 |
| GO:0000377112 | Skin | cSCC | RNA splicing, via transesterification reactions with bulged adenosine as nucleophile | 197/4864 | 320/18723 | 1.45e-41 | 1.14e-38 | 197 |
| GO:0000398112 | Skin | cSCC | mRNA splicing, via spliceosome | 197/4864 | 320/18723 | 1.45e-41 | 1.14e-38 | 197 |
| GO:007182629 | Skin | cSCC | ribonucleoprotein complex subunit organization | 140/4864 | 227/18723 | 5.54e-30 | 3.16e-27 | 140 |
| Page: 1 2 3 4 5 |
| Pathway ID | Tissue | Disease Stage | Description | Gene Ratio | Bg Ratio | pvalue | p.adjust | qvalue | Count |
| hsa03040 | Colorectum | AD | Spliceosome | 73/2092 | 217/8465 | 1.73e-03 | 9.68e-03 | 6.18e-03 | 73 |
| hsa030401 | Colorectum | AD | Spliceosome | 73/2092 | 217/8465 | 1.73e-03 | 9.68e-03 | 6.18e-03 | 73 |
| hsa030402 | Colorectum | MSS | Spliceosome | 66/1875 | 217/8465 | 2.58e-03 | 1.27e-02 | 7.81e-03 | 66 |
| hsa030403 | Colorectum | MSS | Spliceosome | 66/1875 | 217/8465 | 2.58e-03 | 1.27e-02 | 7.81e-03 | 66 |
| hsa0304027 | Esophagus | ESCC | Spliceosome | 128/4205 | 217/8465 | 3.31e-03 | 8.79e-03 | 4.50e-03 | 128 |
| hsa0304037 | Esophagus | ESCC | Spliceosome | 128/4205 | 217/8465 | 3.31e-03 | 8.79e-03 | 4.50e-03 | 128 |
| hsa030407 | Liver | Cirrhotic | Spliceosome | 102/2530 | 217/8465 | 5.69e-08 | 9.47e-07 | 5.84e-07 | 102 |
| hsa0304012 | Liver | Cirrhotic | Spliceosome | 102/2530 | 217/8465 | 5.69e-08 | 9.47e-07 | 5.84e-07 | 102 |
| hsa0304022 | Liver | HCC | Spliceosome | 122/4020 | 217/8465 | 5.55e-03 | 1.60e-02 | 8.91e-03 | 122 |
| hsa0304032 | Liver | HCC | Spliceosome | 122/4020 | 217/8465 | 5.55e-03 | 1.60e-02 | 8.91e-03 | 122 |
| hsa0304016 | Oral cavity | OSCC | Spliceosome | 123/3704 | 217/8465 | 7.21e-05 | 2.74e-04 | 1.40e-04 | 123 |
| hsa0304017 | Oral cavity | OSCC | Spliceosome | 123/3704 | 217/8465 | 7.21e-05 | 2.74e-04 | 1.40e-04 | 123 |
| hsa0304026 | Oral cavity | LP | Spliceosome | 106/2418 | 217/8465 | 1.30e-10 | 2.40e-09 | 1.55e-09 | 106 |
| hsa0304036 | Oral cavity | LP | Spliceosome | 106/2418 | 217/8465 | 1.30e-10 | 2.40e-09 | 1.55e-09 | 106 |
| hsa0304025 | Prostate | Tumor | Spliceosome | 66/1791 | 217/8465 | 7.53e-04 | 3.59e-03 | 2.23e-03 | 66 |
| hsa0304035 | Prostate | Tumor | Spliceosome | 66/1791 | 217/8465 | 7.53e-04 | 3.59e-03 | 2.23e-03 | 66 |
| Page: 1 |
Top |
Cell-cell communication analysis |
| Identification of potential cell-cell interactions between two cell types and their ligand-receptor pairs for different disease states |
| Ligand | Receptor | LRpair | Pathway | Tissue | Disease Stage |
| Page: 1 |
Top |
Single-cell gene regulatory network inference analysis |
| Find out the significant the regulons (TFs) and the target genes of each regulon across cell types for different disease states |
| TF | Cell Type | Tissue | Disease Stage | Target Gene | RSS | Regulon Activity |
| ∗The dot plots of a searched regulon are shown for all cell subpopulations in each disease state of each tissue based on the regulon specific score inferred using pySCENIC and by calculating the average expression. |
| Page: 1 |
Top |
Somatic mutation of malignant transformation related genes |
| Annotation of somatic variants for genes involved in malignant transformation |
| Hugo Symbol | Variant Class | Variant Classification | dbSNP RS | HGVSc | HGVSp | HGVSp Short | SWISSPROT | BIOTYPE | SIFT | PolyPhen | Tumor Sample Barcode | Tissue | Histology | Sex | Age | Stage | Therapy Types | Drugs | Outcome |
| SF3A1 | SNV | Missense_Mutation | novel | c.2005C>A | p.Pro669Thr | p.P669T | Q15459 | protein_coding | tolerated(0.37) | probably_damaging(0.981) | TCGA-A7-A0DB-01 | Breast | breast invasive carcinoma | Female | <65 | I/II | Hormone Therapy | arimidex | SD |
| SF3A1 | SNV | Missense_Mutation | c.1796N>A | p.Arg599Gln | p.R599Q | Q15459 | protein_coding | tolerated(0.68) | possibly_damaging(0.885) | TCGA-BH-A18G-01 | Breast | breast invasive carcinoma | Female | >=65 | I/II | Unknown | Unknown | SD | |
| SF3A1 | SNV | Missense_Mutation | c.1229A>G | p.Tyr410Cys | p.Y410C | Q15459 | protein_coding | deleterious(0) | possibly_damaging(0.608) | TCGA-D8-A1XK-01 | Breast | breast invasive carcinoma | Female | <65 | I/II | Chemotherapy | doxorubicine+cyclophosphamide | SD | |
| SF3A1 | SNV | Missense_Mutation | novel | c.823G>T | p.Asp275Tyr | p.D275Y | Q15459 | protein_coding | deleterious(0) | probably_damaging(0.977) | TCGA-OK-A5Q2-01 | Breast | breast invasive carcinoma | Female | <65 | I/II | Unknown | Unknown | SD |
| SF3A1 | deletion | Frame_Shift_Del | novel | c.1452delT | p.Ile484MetfsTer17 | p.I484Mfs*17 | Q15459 | protein_coding | TCGA-EW-A2FV-01 | Breast | breast invasive carcinoma | Female | <65 | III/IV | Chemotherapy | docetaxel | SD | ||
| SF3A1 | SNV | Missense_Mutation | novel | c.1798N>T | p.Pro600Ser | p.P600S | Q15459 | protein_coding | tolerated(0.08) | benign(0.118) | TCGA-A6-5665-01 | Colorectum | colon adenocarcinoma | Female | >=65 | I/II | Unknown | Unknown | PD |
| SF3A1 | SNV | Missense_Mutation | rs377475726 | c.1904N>T | p.Ala635Val | p.A635V | Q15459 | protein_coding | tolerated(0.23) | benign(0.047) | TCGA-AA-3663-01 | Colorectum | colon adenocarcinoma | Male | <65 | I/II | Unknown | Unknown | SD |
| SF3A1 | SNV | Missense_Mutation | c.1497N>T | p.Lys499Asn | p.K499N | Q15459 | protein_coding | deleterious(0) | probably_damaging(0.95) | TCGA-AA-3811-01 | Colorectum | colon adenocarcinoma | Female | >=65 | III/IV | Unknown | Unknown | PD | |
| SF3A1 | SNV | Missense_Mutation | rs370505540 | c.509N>T | p.Thr170Met | p.T170M | Q15459 | protein_coding | tolerated(0.06) | probably_damaging(0.996) | TCGA-AA-3980-01 | Colorectum | colon adenocarcinoma | Female | >=65 | I/II | Unknown | Unknown | SD |
| SF3A1 | SNV | Missense_Mutation | c.1289G>A | p.Arg430His | p.R430H | Q15459 | protein_coding | deleterious(0.01) | probably_damaging(0.991) | TCGA-AD-5900-01 | Colorectum | colon adenocarcinoma | Male | >=65 | I/II | Unknown | Unknown | SD |
| Page: 1 2 3 4 5 6 |
Top |
Related drugs of malignant transformation related genes |
| Identification of chemicals and drugs interact with genes involved in malignant transfromation |
| (DGIdb 4.0) |
| Entrez ID | Symbol | Category | Interaction Types | Drug Claim Name | Drug Name | PMIDs |
| Page: 1 |

Copyright 2023-Present -The University of Texas Health Science Center at Houston |