
|
|||||
|
 | |
| |
| |
| |
| |
| |
|
Gene: SERPINF2 |
Gene summary for SERPINF2 |
| Gene information | Species | Human | Gene symbol | SERPINF2 | Gene ID | 5345 |
| Gene name | serpin family F member 2 | |
| Gene Alias | A2AP | |
| Cytomap | 17p13.3 | |
| Gene Type | protein-coding | GO ID | GO:0000165 | UniProtAcc | P08697 |
Top |
Malignant transformation analysis |
| Identification of the aberrant gene expression in precancerous and cancerous lesions by comparing the gene expression of stem-like cells in diseased tissues with normal stem cells |
| Entrez ID | Symbol | Replicates | Species | Organ | Tissue | Adj P-value | Log2FC | Malignancy |
| 5345 | SERPINF2 | LZE7T | Human | Esophagus | ESCC | 4.85e-03 | 1.31e-01 | 0.0667 |
| 5345 | SERPINF2 | LZE24T | Human | Esophagus | ESCC | 6.68e-05 | 6.04e-02 | 0.0596 |
| 5345 | SERPINF2 | P4T-E | Human | Esophagus | ESCC | 1.40e-08 | 2.52e-01 | 0.1323 |
| 5345 | SERPINF2 | P8T-E | Human | Esophagus | ESCC | 5.83e-18 | 2.89e-01 | 0.0889 |
| 5345 | SERPINF2 | P9T-E | Human | Esophagus | ESCC | 7.93e-06 | 2.07e-01 | 0.1131 |
| 5345 | SERPINF2 | P11T-E | Human | Esophagus | ESCC | 7.12e-09 | 4.32e-01 | 0.1426 |
| 5345 | SERPINF2 | P12T-E | Human | Esophagus | ESCC | 2.14e-06 | 5.99e-02 | 0.1122 |
| 5345 | SERPINF2 | P15T-E | Human | Esophagus | ESCC | 4.87e-02 | 4.11e-02 | 0.1149 |
| 5345 | SERPINF2 | P16T-E | Human | Esophagus | ESCC | 1.87e-10 | 1.80e-01 | 0.1153 |
| 5345 | SERPINF2 | P22T-E | Human | Esophagus | ESCC | 5.35e-03 | 4.77e-02 | 0.1236 |
| 5345 | SERPINF2 | P24T-E | Human | Esophagus | ESCC | 1.23e-06 | 4.97e-02 | 0.1287 |
| 5345 | SERPINF2 | P26T-E | Human | Esophagus | ESCC | 2.00e-04 | 2.49e-02 | 0.1276 |
| 5345 | SERPINF2 | P27T-E | Human | Esophagus | ESCC | 4.11e-08 | 9.34e-02 | 0.1055 |
| 5345 | SERPINF2 | P30T-E | Human | Esophagus | ESCC | 5.75e-03 | 8.73e-02 | 0.137 |
| 5345 | SERPINF2 | P31T-E | Human | Esophagus | ESCC | 4.56e-07 | 4.95e-02 | 0.1251 |
| 5345 | SERPINF2 | P37T-E | Human | Esophagus | ESCC | 6.43e-06 | 4.12e-02 | 0.1371 |
| 5345 | SERPINF2 | P42T-E | Human | Esophagus | ESCC | 2.35e-02 | 7.17e-02 | 0.1175 |
| 5345 | SERPINF2 | P47T-E | Human | Esophagus | ESCC | 4.54e-08 | 4.08e-02 | 0.1067 |
| 5345 | SERPINF2 | P61T-E | Human | Esophagus | ESCC | 1.09e-03 | 1.66e-01 | 0.099 |
| 5345 | SERPINF2 | P65T-E | Human | Esophagus | ESCC | 3.22e-19 | 4.41e-01 | 0.0978 |
| Page: 1 2 |
| Tissue | Expression Dynamics | Abbreviation |
| Esophagus | 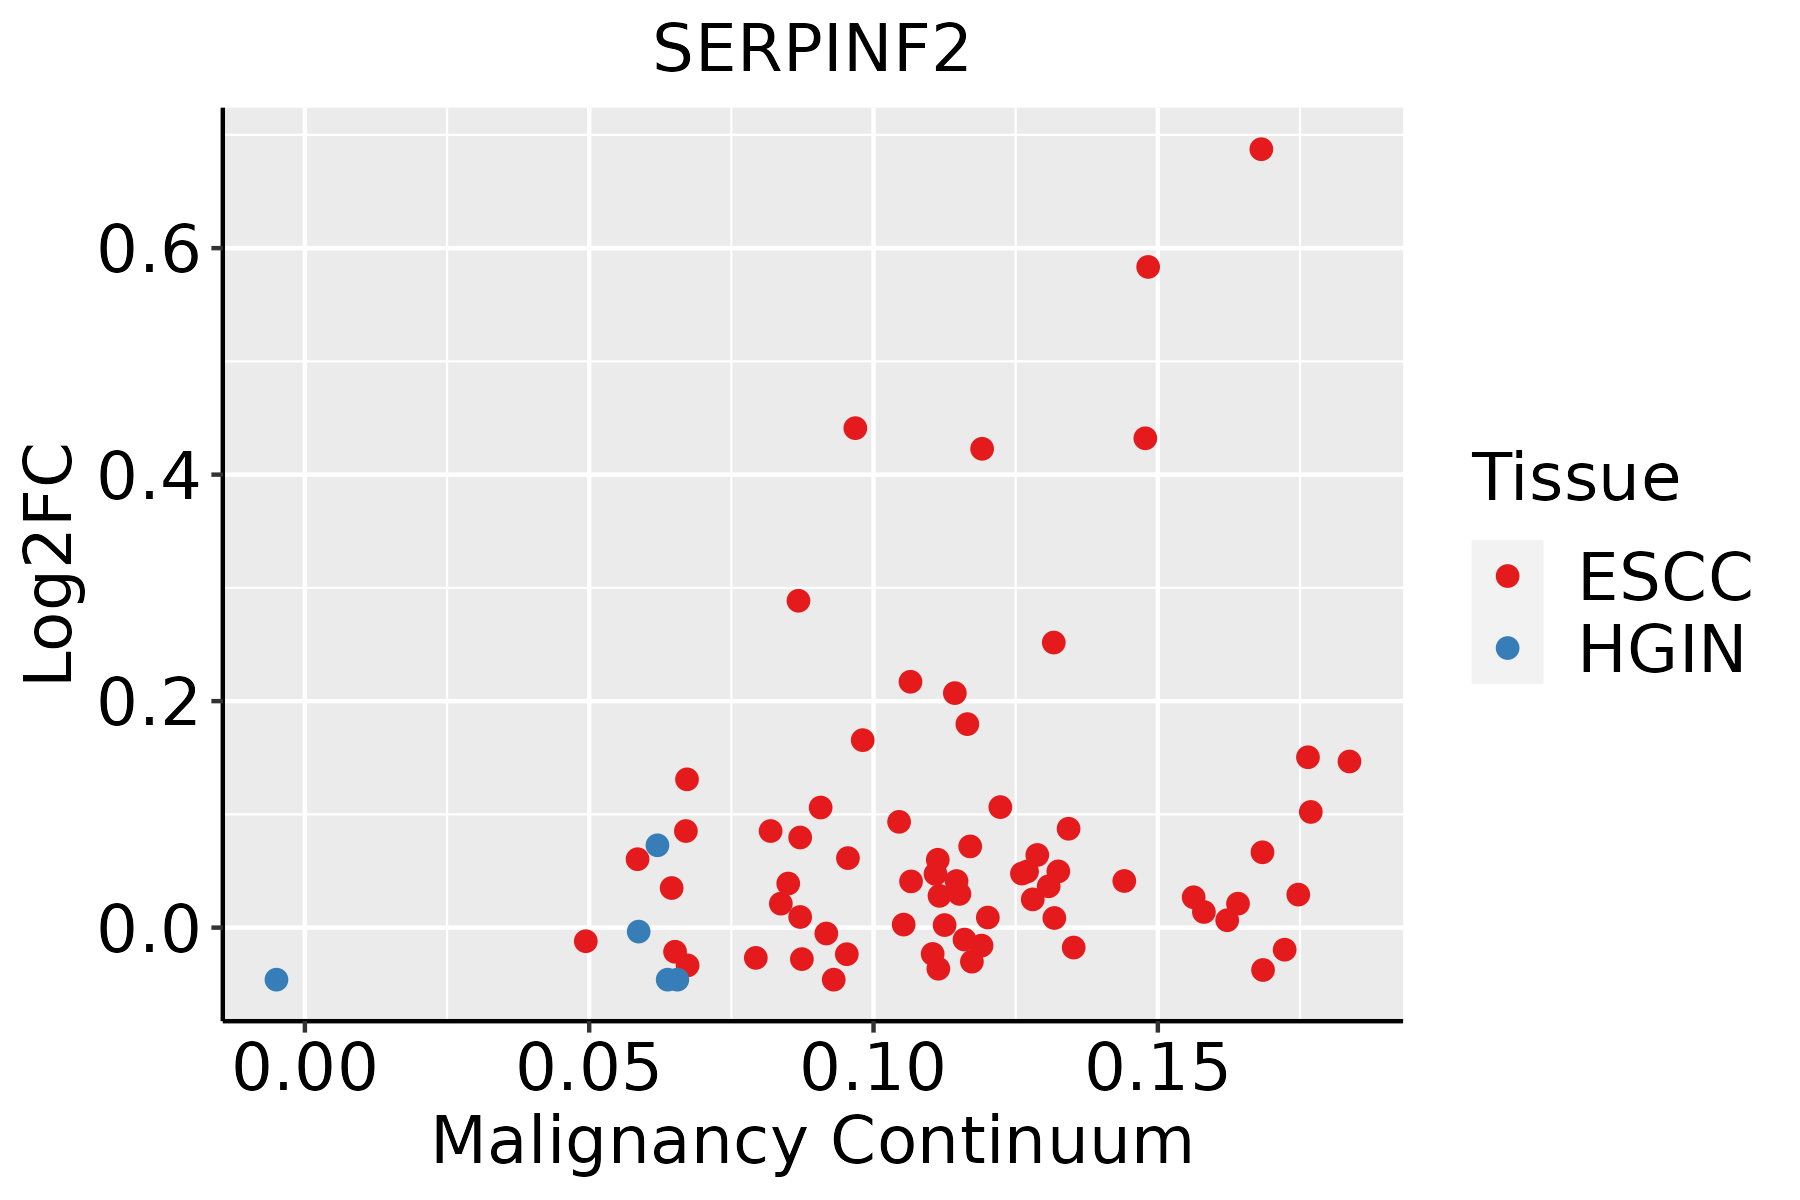 | ESCC: Esophageal squamous cell carcinoma |
| HGIN: High-grade intraepithelial neoplasias | ||
| LGIN: Low-grade intraepithelial neoplasias | ||
| Liver |  | HCC: Hepatocellular carcinoma |
| NAFLD: Non-alcoholic fatty liver disease |
| ∗log2FC in expression of this searched gene in stem-like cells from each diseased tissue sample relative to stem-like cells in normal samples in each tissue plotted against the malignancy continuum. Samples are colored based on if they are from different disease stage. |
Top |
Malignant transformation related pathway analysis |
| Find out the enriched GO biological processes and KEGG pathways involved in transition from healthy to precancer to cancer |
| Tissue | Disease Stage | Enriched GO biological Processes |
| Colorectum | AD |  |
| Colorectum | SER |  |
| Colorectum | MSS |  |
| Colorectum | MSI-H |  |
| Colorectum | FAP |  |
| ∗Top 15 enriched GO BP terms are showed in the bar plot of each disease state in each tissue. Each row represents a significant GO biological process which is colored according to the -log10(p.adjust). |
| Page: 1 2 3 4 5 6 7 8 9 |
| GO ID | Tissue | Disease Stage | Description | Gene Ratio | Bg Ratio | pvalue | p.adjust | Count |
| GO:0030193 | Liver | NAFLD | regulation of blood coagulation | 24/1882 | 66/18723 | 9.30e-09 | 1.26e-06 | 24 |
| GO:0050819 | Liver | NAFLD | negative regulation of coagulation | 21/1882 | 53/18723 | 1.33e-08 | 1.69e-06 | 21 |
| GO:1900046 | Liver | NAFLD | regulation of hemostasis | 24/1882 | 68/18723 | 1.84e-08 | 2.09e-06 | 24 |
| GO:0061045 | Liver | NAFLD | negative regulation of wound healing | 26/1882 | 78/18723 | 1.86e-08 | 2.09e-06 | 26 |
| GO:19030347 | Liver | NAFLD | regulation of response to wounding | 41/1882 | 167/18723 | 4.70e-08 | 4.58e-06 | 41 |
| GO:0050818 | Liver | NAFLD | regulation of coagulation | 24/1882 | 71/18723 | 4.80e-08 | 4.60e-06 | 24 |
| GO:0051917 | Liver | NAFLD | regulation of fibrinolysis | 10/1882 | 14/18723 | 7.05e-08 | 6.34e-06 | 10 |
| GO:00075994 | Liver | NAFLD | hemostasis | 49/1882 | 222/18723 | 9.23e-08 | 7.59e-06 | 49 |
| GO:00075964 | Liver | NAFLD | blood coagulation | 48/1882 | 217/18723 | 1.16e-07 | 8.81e-06 | 48 |
| GO:00508174 | Liver | NAFLD | coagulation | 48/1882 | 222/18723 | 2.40e-07 | 1.61e-05 | 48 |
| GO:00458617 | Liver | NAFLD | negative regulation of proteolysis | 66/1882 | 351/18723 | 4.02e-07 | 2.58e-05 | 66 |
| GO:00070157 | Liver | NAFLD | actin filament organization | 78/1882 | 442/18723 | 5.44e-07 | 3.21e-05 | 78 |
| GO:00903035 | Liver | NAFLD | positive regulation of wound healing | 20/1882 | 59/18723 | 5.91e-07 | 3.46e-05 | 20 |
| GO:0031639 | Liver | NAFLD | plasminogen activation | 12/1882 | 24/18723 | 8.76e-07 | 4.60e-05 | 12 |
| GO:00072543 | Liver | NAFLD | JNK cascade | 38/1882 | 167/18723 | 1.12e-06 | 5.52e-05 | 38 |
| GO:1903035 | Liver | NAFLD | negative regulation of response to wounding | 26/1882 | 94/18723 | 1.18e-06 | 5.66e-05 | 26 |
| GO:00310326 | Liver | NAFLD | actomyosin structure organization | 41/1882 | 196/18723 | 4.26e-06 | 1.66e-04 | 41 |
| GO:19030366 | Liver | NAFLD | positive regulation of response to wounding | 21/1882 | 72/18723 | 4.93e-06 | 1.83e-04 | 21 |
| GO:00514036 | Liver | NAFLD | stress-activated MAPK cascade | 47/1882 | 239/18723 | 5.26e-06 | 1.93e-04 | 47 |
| GO:00310986 | Liver | NAFLD | stress-activated protein kinase signaling cascade | 48/1882 | 247/18723 | 5.89e-06 | 2.07e-04 | 48 |
| Page: 1 2 3 4 5 6 7 8 9 10 11 12 |
| Pathway ID | Tissue | Disease Stage | Description | Gene Ratio | Bg Ratio | pvalue | p.adjust | qvalue | Count |
| hsa04610 | Liver | NAFLD | Complement and coagulation cascades | 35/1043 | 86/8465 | 2.48e-11 | 2.04e-09 | 1.64e-09 | 35 |
| hsa046101 | Liver | NAFLD | Complement and coagulation cascades | 35/1043 | 86/8465 | 2.48e-11 | 2.04e-09 | 1.64e-09 | 35 |
| hsa046102 | Liver | Cirrhotic | Complement and coagulation cascades | 48/2530 | 86/8465 | 4.41e-07 | 5.44e-06 | 3.35e-06 | 48 |
| hsa046103 | Liver | Cirrhotic | Complement and coagulation cascades | 48/2530 | 86/8465 | 4.41e-07 | 5.44e-06 | 3.35e-06 | 48 |
| hsa046104 | Liver | HCC | Complement and coagulation cascades | 57/4020 | 86/8465 | 3.19e-04 | 1.45e-03 | 8.04e-04 | 57 |
| hsa046105 | Liver | HCC | Complement and coagulation cascades | 57/4020 | 86/8465 | 3.19e-04 | 1.45e-03 | 8.04e-04 | 57 |
| Page: 1 |
Top |
Cell-cell communication analysis |
| Identification of potential cell-cell interactions between two cell types and their ligand-receptor pairs for different disease states |
| Ligand | Receptor | LRpair | Pathway | Tissue | Disease Stage |
| Page: 1 |
Top |
Single-cell gene regulatory network inference analysis |
| Find out the significant the regulons (TFs) and the target genes of each regulon across cell types for different disease states |
| TF | Cell Type | Tissue | Disease Stage | Target Gene | RSS | Regulon Activity |
| ∗The dot plots of a searched regulon are shown for all cell subpopulations in each disease state of each tissue based on the regulon specific score inferred using pySCENIC and by calculating the average expression. |
| Page: 1 |
Top |
Somatic mutation of malignant transformation related genes |
| Annotation of somatic variants for genes involved in malignant transformation |
| Hugo Symbol | Variant Class | Variant Classification | dbSNP RS | HGVSc | HGVSp | HGVSp Short | SWISSPROT | BIOTYPE | SIFT | PolyPhen | Tumor Sample Barcode | Tissue | Histology | Sex | Age | Stage | Therapy Types | Drugs | Outcome |
| SERPINF2 | SNV | Missense_Mutation | c.743N>A | p.Ser248Asn | p.S248N | P08697 | protein_coding | tolerated(0.16) | benign(0.001) | TCGA-A8-A08R-01 | Breast | breast invasive carcinoma | Female | <65 | I/II | Unknown | Unknown | SD | |
| SERPINF2 | SNV | Missense_Mutation | c.611T>C | p.Ile204Thr | p.I204T | P08697 | protein_coding | deleterious(0.04) | probably_damaging(1) | TCGA-BH-A1FL-01 | Breast | breast invasive carcinoma | Female | >=65 | I/II | Unknown | Unknown | PD | |
| SERPINF2 | SNV | Missense_Mutation | novel | c.1311N>G | p.Asn437Lys | p.N437K | P08697 | protein_coding | deleterious(0) | possibly_damaging(0.72) | TCGA-E2-A576-01 | Breast | breast invasive carcinoma | Female | >=65 | I/II | Chemotherapy | taxotere | SD |
| SERPINF2 | insertion | Nonsense_Mutation | novel | c.1028_1029insATACACACAACATAAAAAAGTTACTGAGAACTCTTCTTAGT | p.His343GlnfsTer14 | p.H343Qfs*14 | P08697 | protein_coding | TCGA-BH-A0B4-01 | Breast | breast invasive carcinoma | Male | >=65 | III/IV | Hormone Therapy | tamoxiphen | SD | ||
| SERPINF2 | insertion | Frame_Shift_Ins | novel | c.1330_1331insCTCGCTGGCTTCCCTGGAAGGGGAAGGAGGAGAAGCTGGGG | p.Leu444ProfsTer31 | p.L444Pfs*31 | P08697 | protein_coding | TCGA-BH-A0HQ-01 | Breast | breast invasive carcinoma | Female | <65 | I/II | Hormone Therapy | arimidex | SD | ||
| SERPINF2 | SNV | Missense_Mutation | novel | c.229N>A | p.Glu77Lys | p.E77K | P08697 | protein_coding | tolerated(0.36) | benign(0.014) | TCGA-4J-AA1J-01 | Cervix | cervical & endocervical cancer | Female | <65 | I/II | Unknown | Unknown | SD |
| SERPINF2 | SNV | Missense_Mutation | rs121965062 | c.1231N>A | p.Val411Met | p.V411M | P08697 | protein_coding | tolerated(0.07) | benign(0.409) | TCGA-EA-A410-01 | Cervix | cervical & endocervical cancer | Female | <65 | I/II | Unknown | Unknown | SD |
| SERPINF2 | SNV | Missense_Mutation | c.1214C>T | p.Ser405Phe | p.S405F | P08697 | protein_coding | deleterious(0) | probably_damaging(0.999) | TCGA-JW-A5VJ-01 | Cervix | cervical & endocervical cancer | Female | <65 | I/II | Unknown | Unknown | PD | |
| SERPINF2 | SNV | Missense_Mutation | rs376458796 | c.1171G>A | p.Val391Met | p.V391M | P08697 | protein_coding | deleterious(0.03) | probably_damaging(0.995) | TCGA-5M-AAT6-01 | Colorectum | colon adenocarcinoma | Female | <65 | III/IV | Unknown | Unknown | PD |
| SERPINF2 | SNV | Missense_Mutation | c.1306N>A | p.Pro436Thr | p.P436T | P08697 | protein_coding | deleterious(0) | probably_damaging(1) | TCGA-A6-5665-01 | Colorectum | colon adenocarcinoma | Female | >=65 | I/II | Unknown | Unknown | PD |
| Page: 1 2 3 4 5 |
Top |
Related drugs of malignant transformation related genes |
| Identification of chemicals and drugs interact with genes involved in malignant transfromation |
| (DGIdb 4.0) |
| Entrez ID | Symbol | Category | Interaction Types | Drug Claim Name | Drug Name | PMIDs |
| Page: 1 |

Copyright 2023-Present -The University of Texas Health Science Center at Houston |