
|
|||||
|
 | |
| |
| |
| |
| |
| |
|
Gene: SEMA3D |
Gene summary for SEMA3D |
| Gene information | Species | Human | Gene symbol | SEMA3D | Gene ID | 223117 |
| Gene name | semaphorin 3D | |
| Gene Alias | Sema-Z2 | |
| Cytomap | 7q21.11 | |
| Gene Type | protein-coding | GO ID | GO:0000902 | UniProtAcc | O95025 |
Top |
Malignant transformation analysis |
| Identification of the aberrant gene expression in precancerous and cancerous lesions by comparing the gene expression of stem-like cells in diseased tissues with normal stem cells |
| Entrez ID | Symbol | Replicates | Species | Organ | Tissue | Adj P-value | Log2FC | Malignancy |
| 223117 | SEMA3D | Adj_PTCwithHT_6 | Human | Thyroid | HT | 1.01e-02 | -3.92e-01 | 0.02 |
| 223117 | SEMA3D | PTCwithHT_6 | Human | Thyroid | HT | 2.69e-04 | -3.94e-01 | 0.02 |
| 223117 | SEMA3D | PTCwithHT_8 | Human | Thyroid | HT | 5.67e-05 | -3.96e-01 | 0.0351 |
| 223117 | SEMA3D | PTCwithoutHT_2 | Human | Thyroid | PTC | 1.28e-06 | -3.96e-01 | 0.0419 |
| 223117 | SEMA3D | male-WTA | Human | Thyroid | PTC | 3.68e-05 | -2.48e-01 | 0.1037 |
| 223117 | SEMA3D | PTC01 | Human | Thyroid | PTC | 1.49e-05 | -3.79e-01 | 0.1899 |
| 223117 | SEMA3D | PTC04 | Human | Thyroid | PTC | 6.91e-04 | -3.73e-01 | 0.1927 |
| 223117 | SEMA3D | PTC06 | Human | Thyroid | PTC | 3.90e-03 | -3.56e-01 | 0.2057 |
| 223117 | SEMA3D | PTC07 | Human | Thyroid | PTC | 1.12e-05 | -3.70e-01 | 0.2044 |
| 223117 | SEMA3D | ATC12 | Human | Thyroid | ATC | 2.66e-05 | -3.96e-01 | 0.34 |
| 223117 | SEMA3D | ATC13 | Human | Thyroid | ATC | 1.23e-02 | -2.07e-01 | 0.34 |
| 223117 | SEMA3D | ATC2 | Human | Thyroid | ATC | 1.80e-02 | -1.02e-01 | 0.34 |
| 223117 | SEMA3D | ATC4 | Human | Thyroid | ATC | 1.90e-05 | -3.96e-01 | 0.34 |
| Page: 1 |
| Tissue | Expression Dynamics | Abbreviation |
| Thyroid | 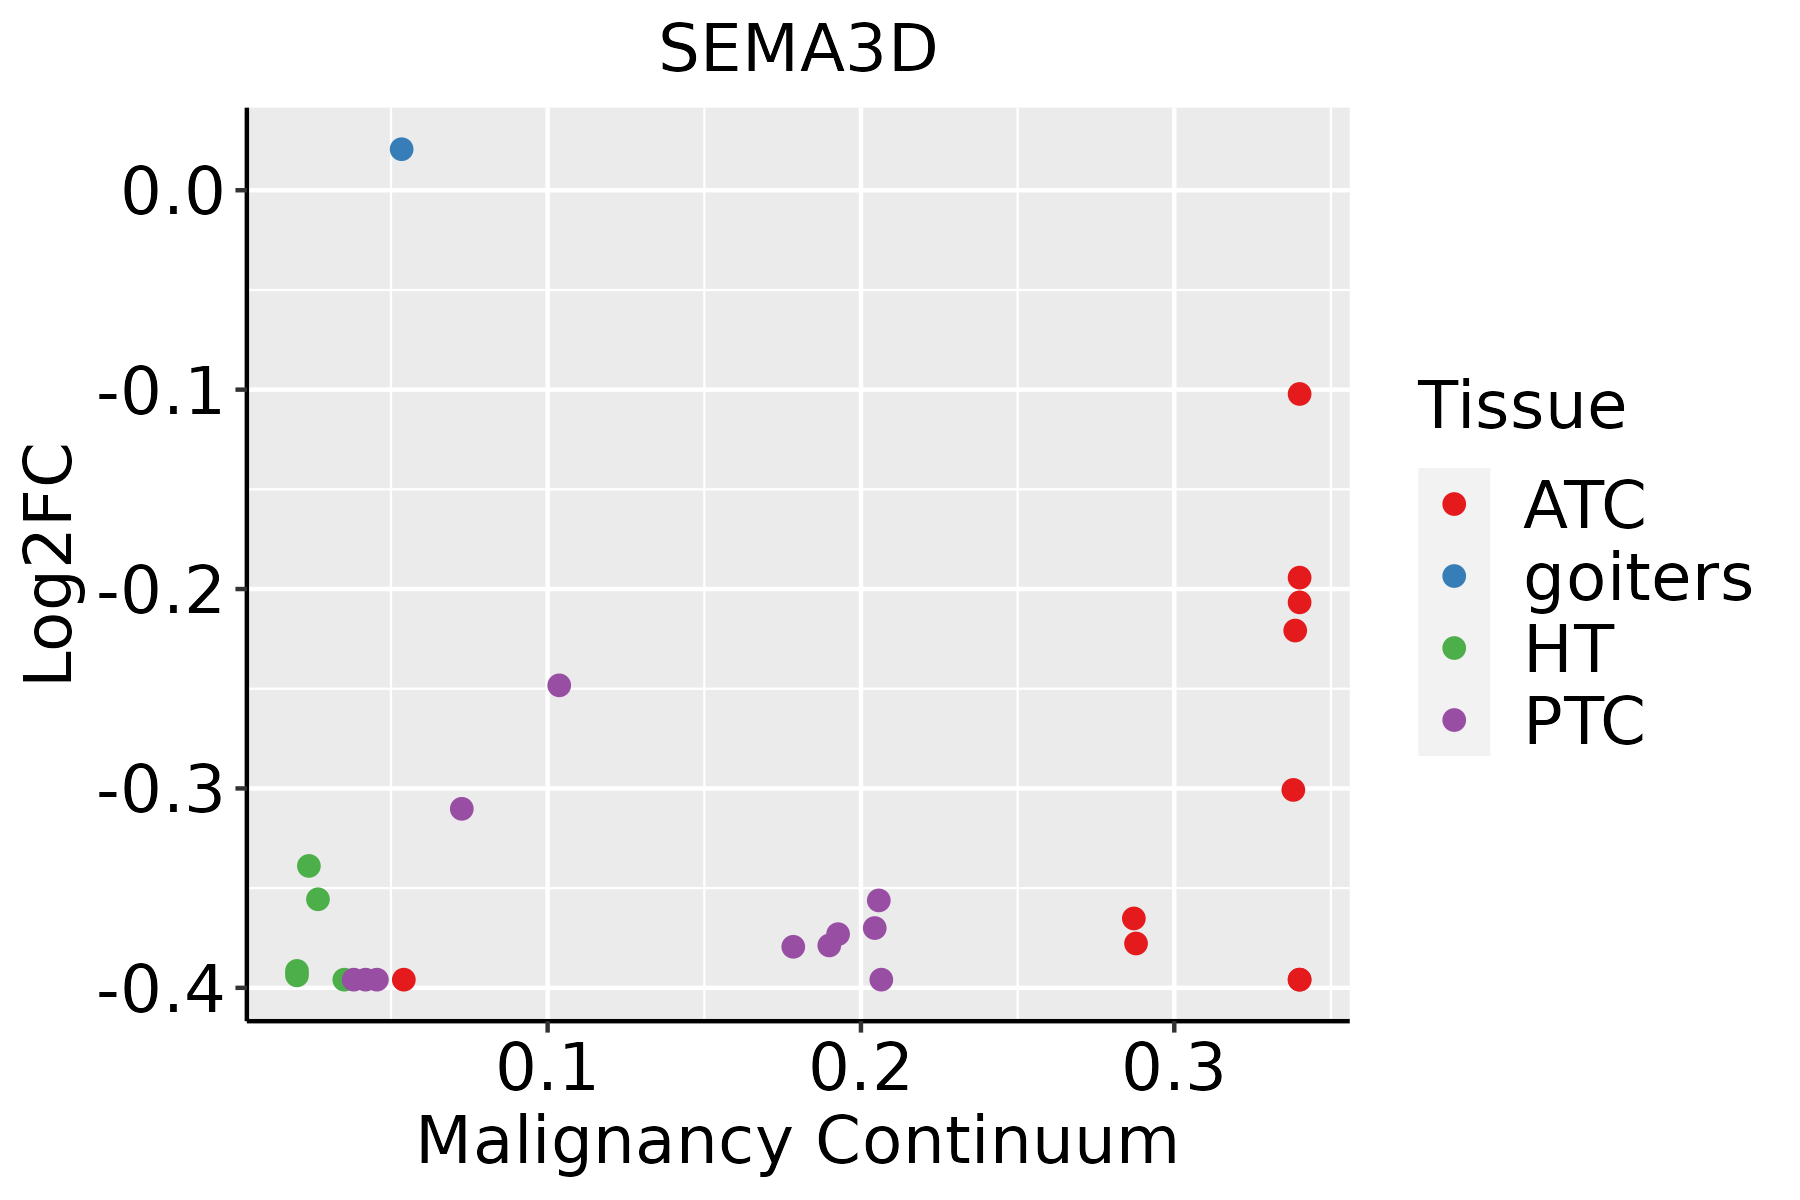 | ATC: Anaplastic thyroid cancer |
| HT: Hashimoto's thyroiditis | ||
| PTC: Papillary thyroid cancer |
| ∗log2FC in expression of this searched gene in stem-like cells from each diseased tissue sample relative to stem-like cells in normal samples in each tissue plotted against the malignancy continuum. Samples are colored based on if they are from different disease stage. |
Top |
Malignant transformation related pathway analysis |
| Find out the enriched GO biological processes and KEGG pathways involved in transition from healthy to precancer to cancer |
| Tissue | Disease Stage | Enriched GO biological Processes |
| Colorectum | AD |  |
| Colorectum | SER |  |
| Colorectum | MSS |  |
| Colorectum | MSI-H |  |
| Colorectum | FAP |  |
| ∗Top 15 enriched GO BP terms are showed in the bar plot of each disease state in each tissue. Each row represents a significant GO biological process which is colored according to the -log10(p.adjust). |
| Page: 1 2 3 4 5 6 7 8 9 |
| GO ID | Tissue | Disease Stage | Description | Gene Ratio | Bg Ratio | pvalue | p.adjust | Count |
| GO:004886321 | Thyroid | ATC | stem cell differentiation | 97/6293 | 206/18723 | 3.88e-05 | 3.15e-04 | 97 |
| GO:003051613 | Thyroid | ATC | regulation of axon extension | 51/6293 | 95/18723 | 4.33e-05 | 3.50e-04 | 51 |
| GO:006138712 | Thyroid | ATC | regulation of extent of cell growth | 56/6293 | 110/18723 | 1.30e-04 | 9.17e-04 | 56 |
| GO:003134514 | Thyroid | ATC | negative regulation of cell projection organization | 86/6293 | 186/18723 | 2.25e-04 | 1.46e-03 | 86 |
| GO:001097712 | Thyroid | ATC | negative regulation of neuron projection development | 66/6293 | 137/18723 | 2.82e-04 | 1.80e-03 | 66 |
| GO:00509206 | Thyroid | ATC | regulation of chemotaxis | 99/6293 | 223/18723 | 4.91e-04 | 2.86e-03 | 99 |
| GO:004001316 | Thyroid | ATC | negative regulation of locomotion | 160/6293 | 391/18723 | 1.36e-03 | 7.07e-03 | 160 |
| GO:004863815 | Thyroid | ATC | regulation of developmental growth | 136/6293 | 330/18723 | 2.17e-03 | 1.02e-02 | 136 |
| GO:00074113 | Thyroid | ATC | axon guidance | 96/6293 | 227/18723 | 3.74e-03 | 1.63e-02 | 96 |
| GO:0071526 | Thyroid | ATC | semaphorin-plexin signaling pathway | 22/6293 | 40/18723 | 4.32e-03 | 1.80e-02 | 22 |
| GO:00974853 | Thyroid | ATC | neuron projection guidance | 96/6293 | 228/18723 | 4.36e-03 | 1.81e-02 | 96 |
| GO:0048846 | Thyroid | ATC | axon extension involved in axon guidance | 20/6293 | 37/18723 | 8.24e-03 | 3.16e-02 | 20 |
| GO:1902284 | Thyroid | ATC | neuron projection extension involved in neuron projection guidance | 20/6293 | 37/18723 | 8.24e-03 | 3.16e-02 | 20 |
| GO:00107216 | Thyroid | ATC | negative regulation of cell development | 76/6293 | 180/18723 | 9.50e-03 | 3.49e-02 | 76 |
| Page: 1 2 3 4 |
| Pathway ID | Tissue | Disease Stage | Description | Gene Ratio | Bg Ratio | pvalue | p.adjust | qvalue | Count |
| Page: 1 |
Top |
Cell-cell communication analysis |
| Identification of potential cell-cell interactions between two cell types and their ligand-receptor pairs for different disease states |
| Ligand | Receptor | LRpair | Pathway | Tissue | Disease Stage |
| SEMA3D | NRP1_PLXNA2 | SEMA3D_NRP1_PLXNA2 | SEMA3 | Breast | ADJ |
| SEMA3D | NRP2_PLXNA2 | SEMA3D_NRP2_PLXNA2 | SEMA3 | Breast | ADJ |
| SEMA3D | NRP1_PLXNA4 | SEMA3D_NRP1_PLXNA4 | SEMA3 | Breast | DCIS |
| SEMA3D | NRP1_PLXNA2 | SEMA3D_NRP1_PLXNA2 | SEMA3 | Breast | Healthy |
| SEMA3D | NRP2_PLXNA2 | SEMA3D_NRP2_PLXNA2 | SEMA3 | Breast | Healthy |
| SEMA3D | NRP1_PLXNA2 | SEMA3D_NRP1_PLXNA2 | SEMA3 | Endometrium | ADJ |
| SEMA3D | NRP1_PLXNA2 | SEMA3D_NRP1_PLXNA2 | SEMA3 | Endometrium | AEH |
| SEMA3D | NRP2_PLXNA2 | SEMA3D_NRP2_PLXNA2 | SEMA3 | Endometrium | AEH |
| SEMA3D | NRP1_PLXNA2 | SEMA3D_NRP1_PLXNA2 | SEMA3 | Endometrium | EEC |
| SEMA3D | NRP1_PLXNA2 | SEMA3D_NRP1_PLXNA2 | SEMA3 | Esophagus | ESCC |
| SEMA3D | NRP2_PLXNA2 | SEMA3D_NRP2_PLXNA2 | SEMA3 | Esophagus | ESCC |
| SEMA3D | NRP1_PLXNA1 | SEMA3D_NRP1_PLXNA1 | SEMA3 | HNSCC | OSCC |
| SEMA3D | NRP1_PLXNA2 | SEMA3D_NRP1_PLXNA2 | SEMA3 | HNSCC | OSCC |
| SEMA3D | NRP2_PLXNA1 | SEMA3D_NRP2_PLXNA1 | SEMA3 | HNSCC | OSCC |
| SEMA3D | NRP2_PLXNA2 | SEMA3D_NRP2_PLXNA2 | SEMA3 | HNSCC | OSCC |
| SEMA3D | NRP1_PLXNA2 | SEMA3D_NRP1_PLXNA2 | SEMA3 | HNSCC | Precancer |
| SEMA3D | NRP2_PLXNA1 | SEMA3D_NRP2_PLXNA1 | SEMA3 | HNSCC | Precancer |
| SEMA3D | NRP2_PLXNA2 | SEMA3D_NRP2_PLXNA2 | SEMA3 | HNSCC | Precancer |
| SEMA3D | NRP1_PLXNA4 | SEMA3D_NRP1_PLXNA4 | SEMA3 | Lung | ADJ |
| SEMA3D | NRP1_PLXNA2 | SEMA3D_NRP1_PLXNA2 | SEMA3 | Lung | AIS |
| Page: 1 2 3 |
Top |
Single-cell gene regulatory network inference analysis |
| Find out the significant the regulons (TFs) and the target genes of each regulon across cell types for different disease states |
| TF | Cell Type | Tissue | Disease Stage | Target Gene | RSS | Regulon Activity |
| ∗The dot plots of a searched regulon are shown for all cell subpopulations in each disease state of each tissue based on the regulon specific score inferred using pySCENIC and by calculating the average expression. |
| Page: 1 |
Top |
Somatic mutation of malignant transformation related genes |
| Annotation of somatic variants for genes involved in malignant transformation |
| Hugo Symbol | Variant Class | Variant Classification | dbSNP RS | HGVSc | HGVSp | HGVSp Short | SWISSPROT | BIOTYPE | SIFT | PolyPhen | Tumor Sample Barcode | Tissue | Histology | Sex | Age | Stage | Therapy Types | Drugs | Outcome |
| SEMA3D | SNV | Missense_Mutation | c.428N>A | p.Ile143Lys | p.I143K | O95025 | protein_coding | deleterious(0) | benign(0.017) | TCGA-A2-A0CT-01 | Breast | breast invasive carcinoma | Female | >=65 | I/II | Chemotherapy | cytoxan | SD | |
| SEMA3D | SNV | Missense_Mutation | novel | c.1958G>A | p.Arg653Gln | p.R653Q | O95025 | protein_coding | tolerated(0.1) | benign(0.346) | TCGA-AN-A046-01 | Breast | breast invasive carcinoma | Female | >=65 | I/II | Unknown | Unknown | SD |
| SEMA3D | SNV | Missense_Mutation | novel | c.1184N>T | p.Pro395Leu | p.P395L | O95025 | protein_coding | deleterious(0) | probably_damaging(0.999) | TCGA-AN-A0AJ-01 | Breast | breast invasive carcinoma | Female | >=65 | I/II | Unknown | Unknown | SD |
| SEMA3D | SNV | Missense_Mutation | novel | c.1706G>A | p.Arg569Lys | p.R569K | O95025 | protein_coding | deleterious(0) | benign(0.207) | TCGA-AO-A0JC-01 | Breast | breast invasive carcinoma | Female | <65 | I/II | Chemotherapy | fluorouracil | SD |
| SEMA3D | SNV | Missense_Mutation | novel | c.2274G>C | p.Lys758Asn | p.K758N | O95025 | protein_coding | deleterious(0.01) | benign(0.219) | TCGA-AR-A2LE-01 | Breast | breast invasive carcinoma | Female | >=65 | I/II | Hormone Therapy | tamoxiphen | PD |
| SEMA3D | SNV | Missense_Mutation | c.566N>T | p.Gln189Leu | p.Q189L | O95025 | protein_coding | tolerated(0.83) | possibly_damaging(0.741) | TCGA-B6-A0RE-01 | Breast | breast invasive carcinoma | Female | <65 | I/II | Unknown | Unknown | SD | |
| SEMA3D | SNV | Missense_Mutation | c.1990N>G | p.Tyr664Asp | p.Y664D | O95025 | protein_coding | tolerated(0.06) | benign(0.038) | TCGA-BH-A0DL-01 | Breast | breast invasive carcinoma | Female | <65 | I/II | Chemotherapy | cytoxan | CR | |
| SEMA3D | SNV | Missense_Mutation | c.79N>C | p.Met27Leu | p.M27L | O95025 | protein_coding | tolerated(1) | benign(0) | TCGA-BH-A1EO-01 | Breast | breast invasive carcinoma | Female | >=65 | I/II | Unknown | Unknown | SD | |
| SEMA3D | SNV | Missense_Mutation | novel | c.1471G>C | p.Glu491Gln | p.E491Q | O95025 | protein_coding | deleterious(0.01) | probably_damaging(0.981) | TCGA-C8-A8HP-01 | Breast | breast invasive carcinoma | Female | <65 | III/IV | Chemotherapy | 5-fluorouracil | CR |
| SEMA3D | SNV | Missense_Mutation | c.424C>G | p.His142Asp | p.H142D | O95025 | protein_coding | deleterious(0.01) | probably_damaging(1) | TCGA-D8-A145-01 | Breast | breast invasive carcinoma | Female | >=65 | I/II | Hormone Therapy | tamoxiphen | SD |
| Page: 1 2 3 4 5 6 7 8 9 10 11 12 13 14 15 |
Top |
Related drugs of malignant transformation related genes |
| Identification of chemicals and drugs interact with genes involved in malignant transfromation |
| (DGIdb 4.0) |
| Entrez ID | Symbol | Category | Interaction Types | Drug Claim Name | Drug Name | PMIDs |
| Page: 1 |

Copyright 2023-Present -The University of Texas Health Science Center at Houston |