
|
|||||
|
 | |
| |
| |
| |
| |
| |
|
Gene: SDHAF3 |
Gene summary for SDHAF3 |
| Gene information | Species | Human | Gene symbol | SDHAF3 | Gene ID | 57001 |
| Gene name | succinate dehydrogenase complex assembly factor 3 | |
| Gene Alias | ACN9 | |
| Cytomap | 7q21.3 | |
| Gene Type | protein-coding | GO ID | GO:0005975 | UniProtAcc | Q9NRP4 |
Top |
Malignant transformation analysis |
| Identification of the aberrant gene expression in precancerous and cancerous lesions by comparing the gene expression of stem-like cells in diseased tissues with normal stem cells |
| Entrez ID | Symbol | Replicates | Species | Organ | Tissue | Adj P-value | Log2FC | Malignancy |
| 57001 | SDHAF3 | HTA11_347_2000001011 | Human | Colorectum | AD | 1.07e-15 | 7.44e-01 | -0.1954 |
| 57001 | SDHAF3 | A015-C-203 | Human | Colorectum | FAP | 7.52e-06 | -1.55e-01 | -0.1294 |
| 57001 | SDHAF3 | A002-C-201 | Human | Colorectum | FAP | 2.69e-04 | -1.81e-01 | 0.0324 |
| 57001 | SDHAF3 | A001-C-108 | Human | Colorectum | FAP | 1.90e-04 | -1.30e-01 | -0.0272 |
| 57001 | SDHAF3 | A002-C-205 | Human | Colorectum | FAP | 3.47e-05 | -1.89e-01 | -0.1236 |
| 57001 | SDHAF3 | A001-C-104 | Human | Colorectum | FAP | 3.99e-02 | -1.52e-01 | 0.0184 |
| 57001 | SDHAF3 | A015-C-006 | Human | Colorectum | FAP | 8.03e-05 | -2.17e-01 | -0.0994 |
| 57001 | SDHAF3 | A002-C-114 | Human | Colorectum | FAP | 2.76e-04 | -2.01e-01 | -0.1561 |
| 57001 | SDHAF3 | A015-C-104 | Human | Colorectum | FAP | 1.49e-09 | -1.95e-01 | -0.1899 |
| 57001 | SDHAF3 | A001-C-014 | Human | Colorectum | FAP | 4.09e-04 | -1.55e-01 | 0.0135 |
| 57001 | SDHAF3 | A002-C-016 | Human | Colorectum | FAP | 2.64e-03 | -1.62e-01 | 0.0521 |
| 57001 | SDHAF3 | A002-C-116 | Human | Colorectum | FAP | 3.79e-05 | -1.88e-01 | -0.0452 |
| 57001 | SDHAF3 | A018-E-020 | Human | Colorectum | FAP | 4.56e-05 | -2.00e-01 | -0.2034 |
| 57001 | SDHAF3 | F034 | Human | Colorectum | FAP | 4.26e-04 | -1.60e-01 | -0.0665 |
| 57001 | SDHAF3 | CRC-3-11773 | Human | Colorectum | CRC | 2.19e-03 | -1.72e-01 | 0.2564 |
| 57001 | SDHAF3 | LZE4T | Human | Esophagus | ESCC | 2.49e-15 | 4.24e-01 | 0.0811 |
| 57001 | SDHAF3 | LZE7T | Human | Esophagus | ESCC | 5.85e-13 | 5.69e-01 | 0.0667 |
| 57001 | SDHAF3 | LZE8T | Human | Esophagus | ESCC | 5.02e-04 | 2.04e-01 | 0.067 |
| 57001 | SDHAF3 | LZE20T | Human | Esophagus | ESCC | 4.57e-06 | 2.52e-01 | 0.0662 |
| 57001 | SDHAF3 | LZE22T | Human | Esophagus | ESCC | 6.88e-10 | 7.47e-01 | 0.068 |
| Page: 1 2 3 4 5 6 7 |
| Tissue | Expression Dynamics | Abbreviation |
| Colorectum (GSE201348) |  | FAP: Familial adenomatous polyposis |
| CRC: Colorectal cancer | ||
| Colorectum (HTA11) |  | AD: Adenomas |
| SER: Sessile serrated lesions | ||
| MSI-H: Microsatellite-high colorectal cancer | ||
| MSS: Microsatellite stable colorectal cancer | ||
| Esophagus | 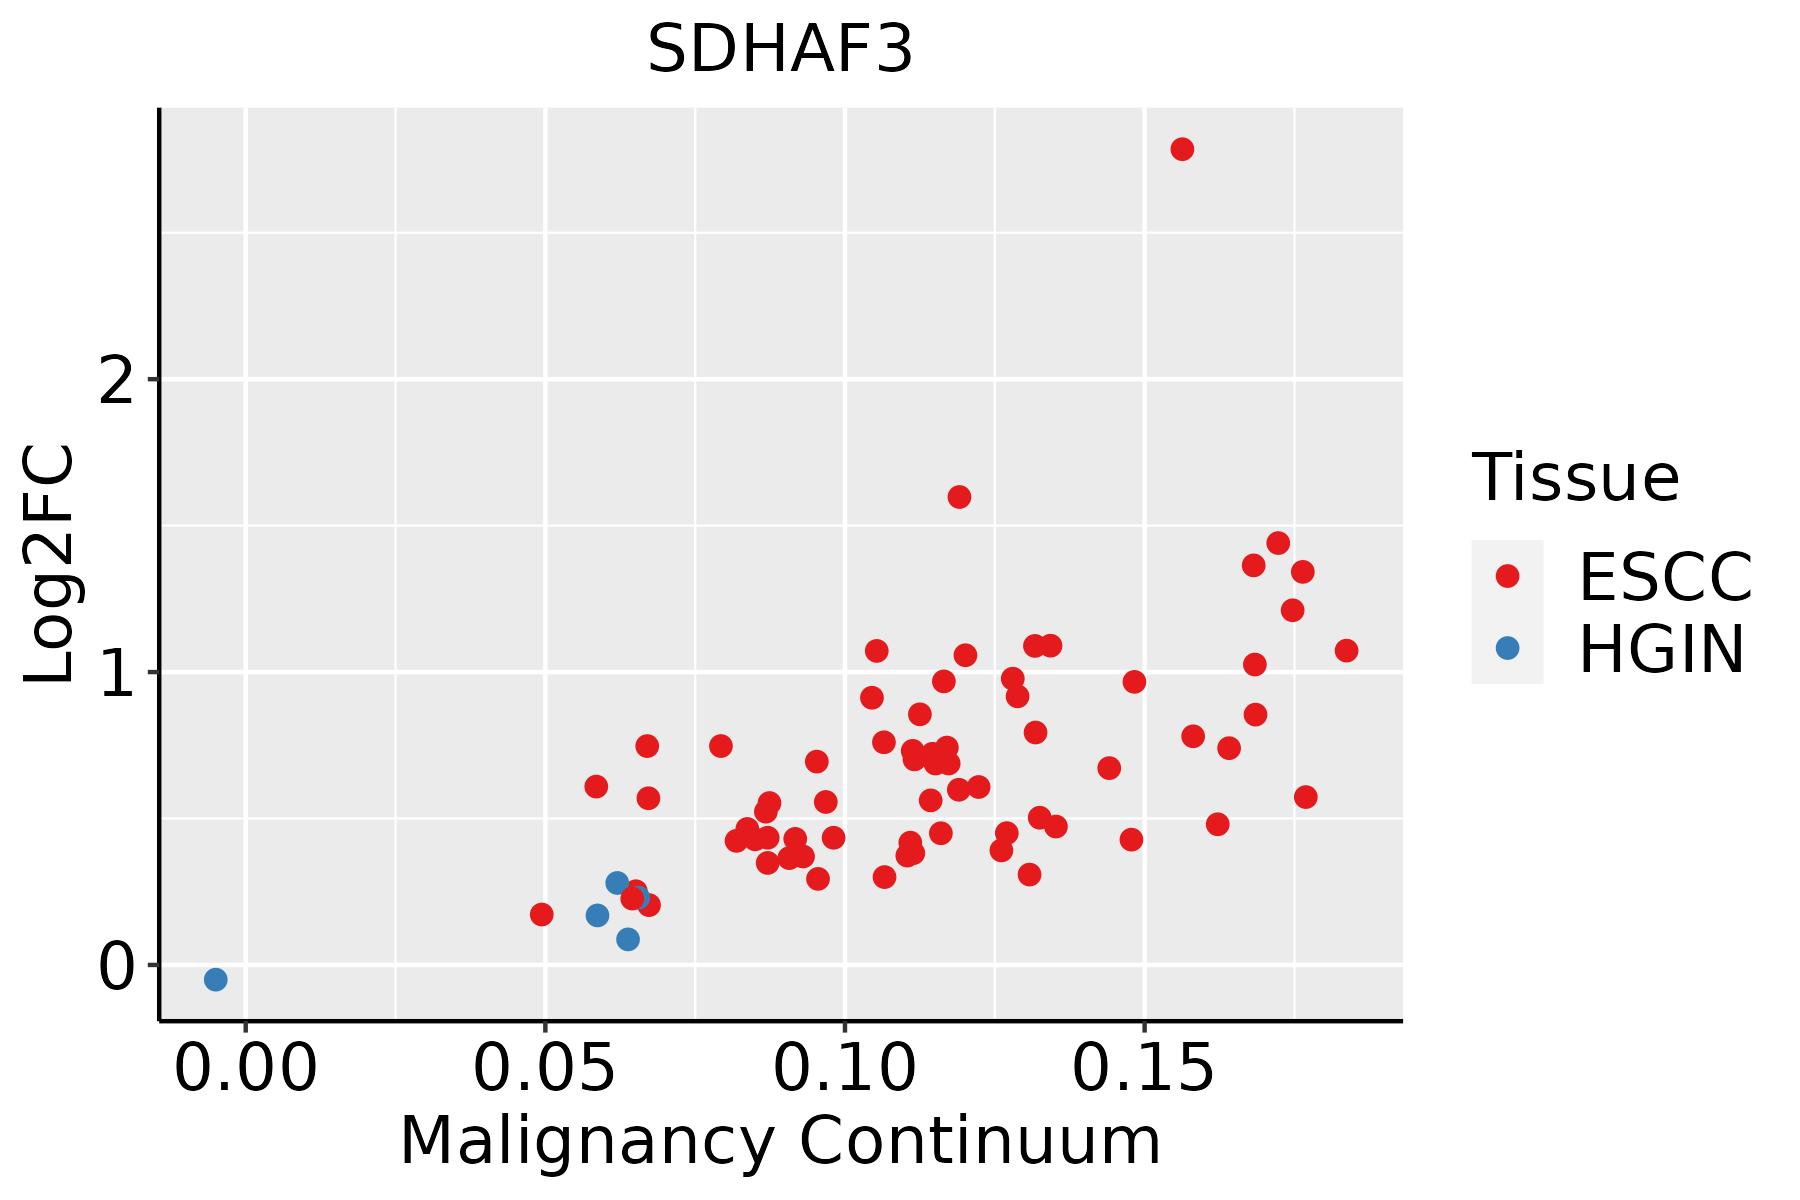 | ESCC: Esophageal squamous cell carcinoma |
| HGIN: High-grade intraepithelial neoplasias | ||
| LGIN: Low-grade intraepithelial neoplasias | ||
| GC | 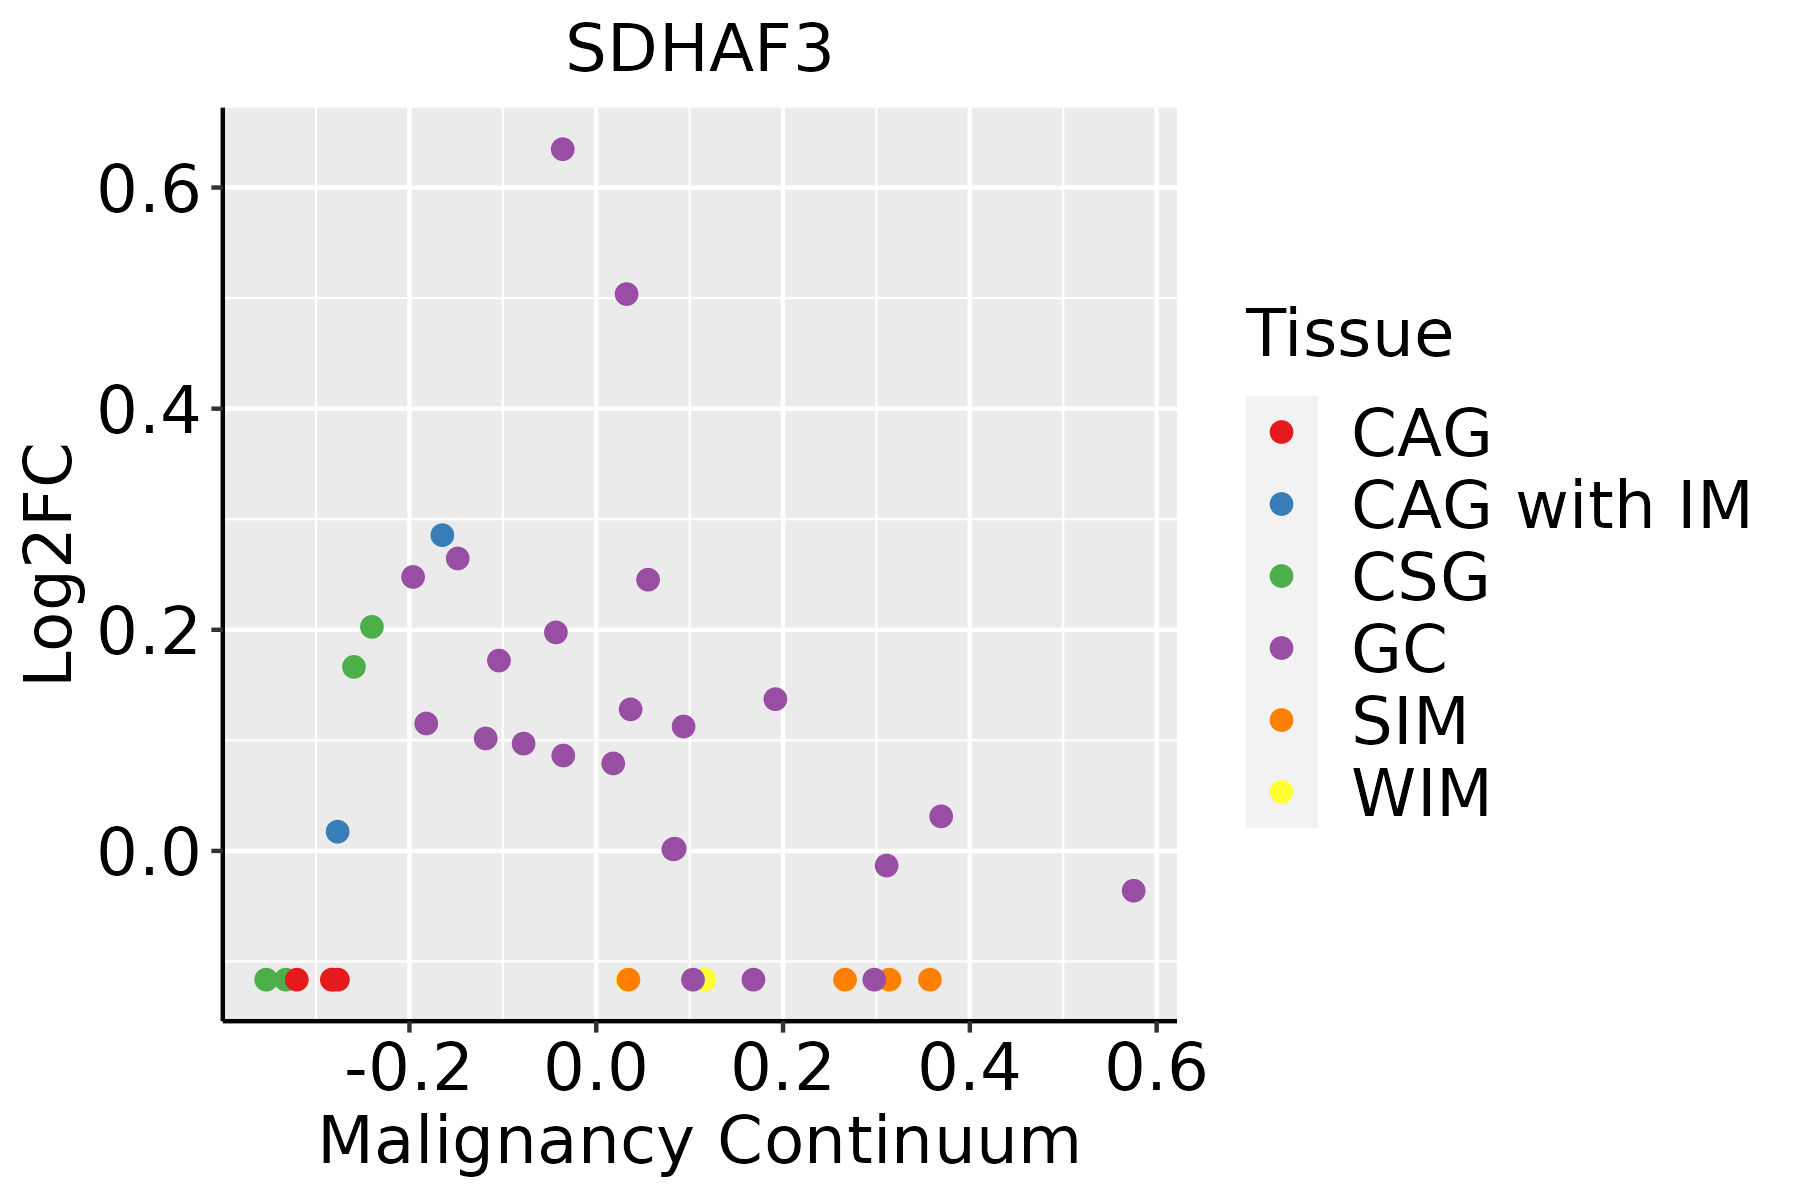 | CAG: Chronic atrophic gastritis |
| CAG with IM: Chronic atrophic gastritis with intestinal metaplasia | ||
| CSG: Chronic superficial gastritis | ||
| GC: Gastric cancer | ||
| SIM: Severe intestinal metaplasia | ||
| WIM: Wild intestinal metaplasia | ||
| Liver |  | HCC: Hepatocellular carcinoma |
| NAFLD: Non-alcoholic fatty liver disease | ||
| Oral Cavity | 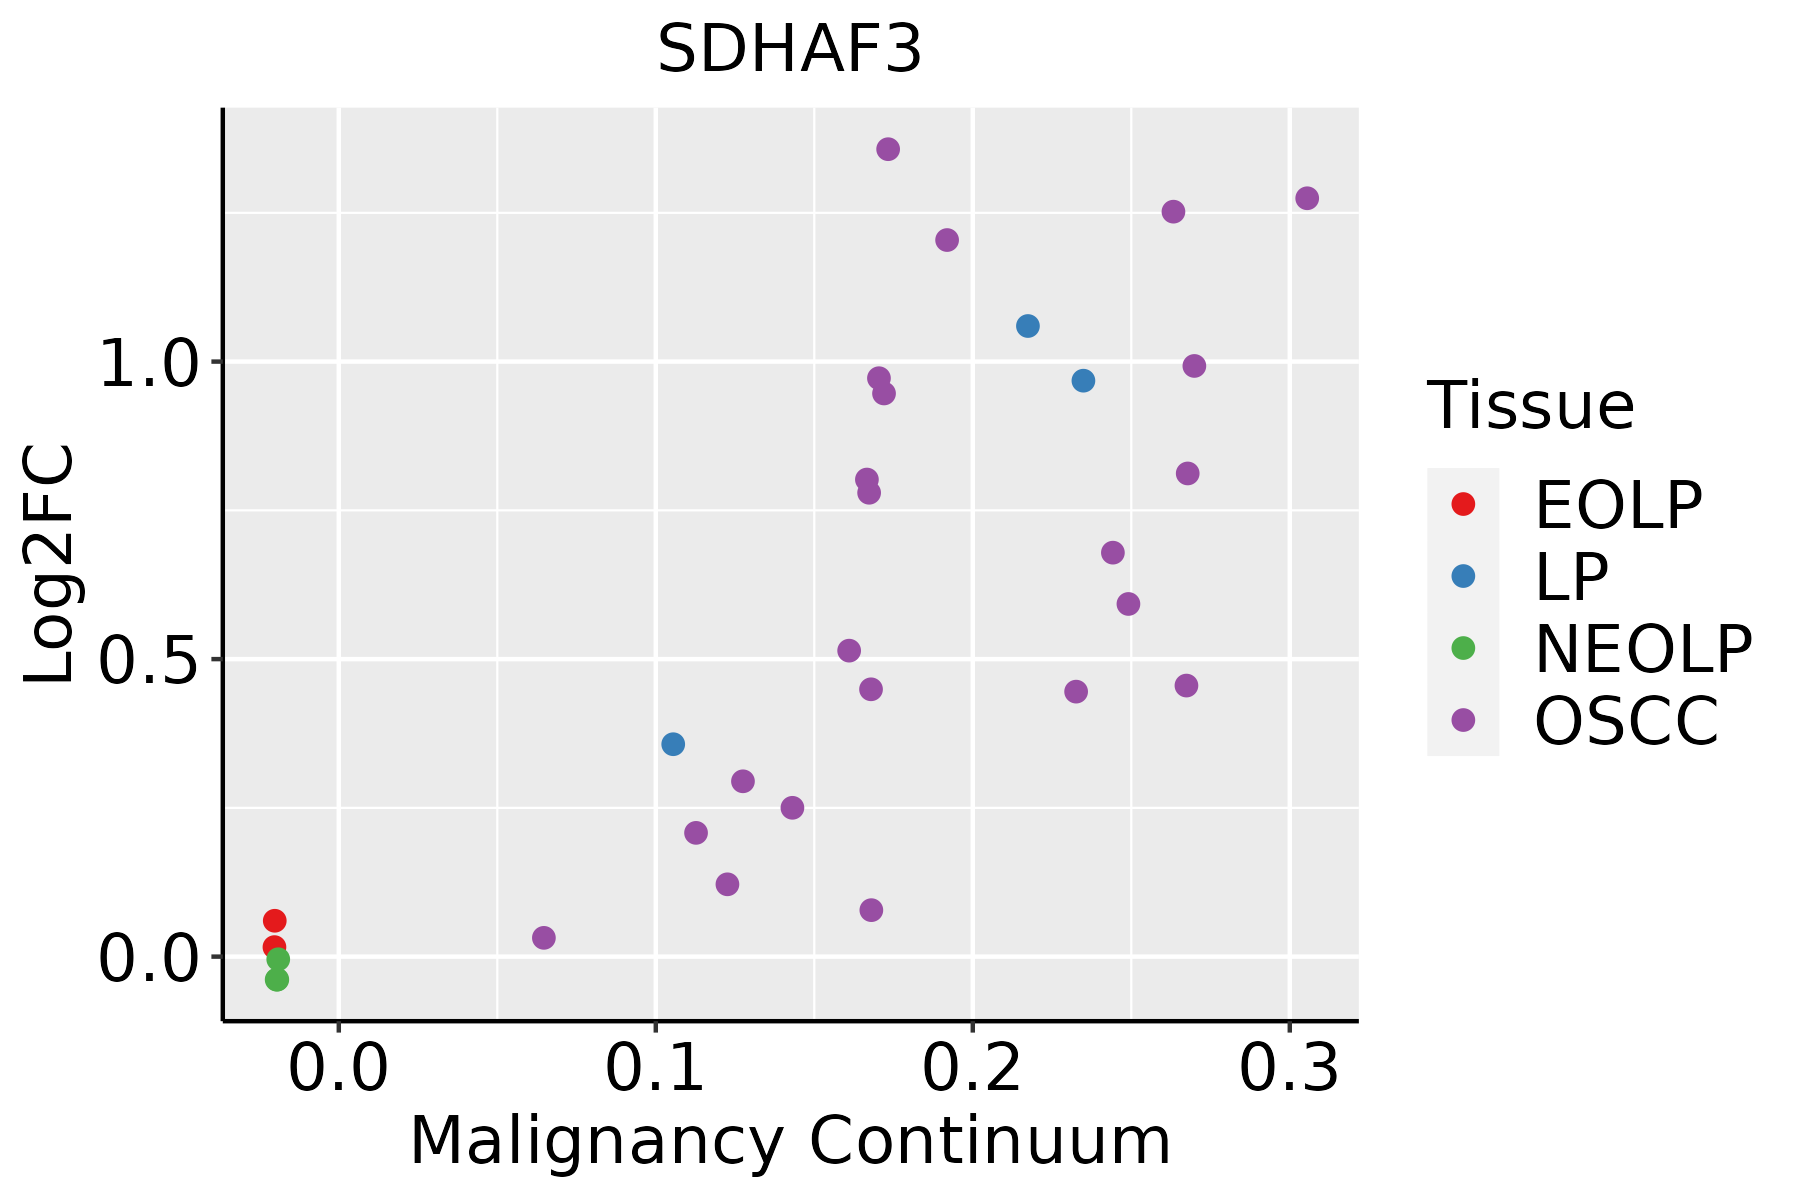 | EOLP: Erosive Oral lichen planus |
| LP: leukoplakia | ||
| NEOLP: Non-erosive oral lichen planus | ||
| OSCC: Oral squamous cell carcinoma | ||
| Prostate | 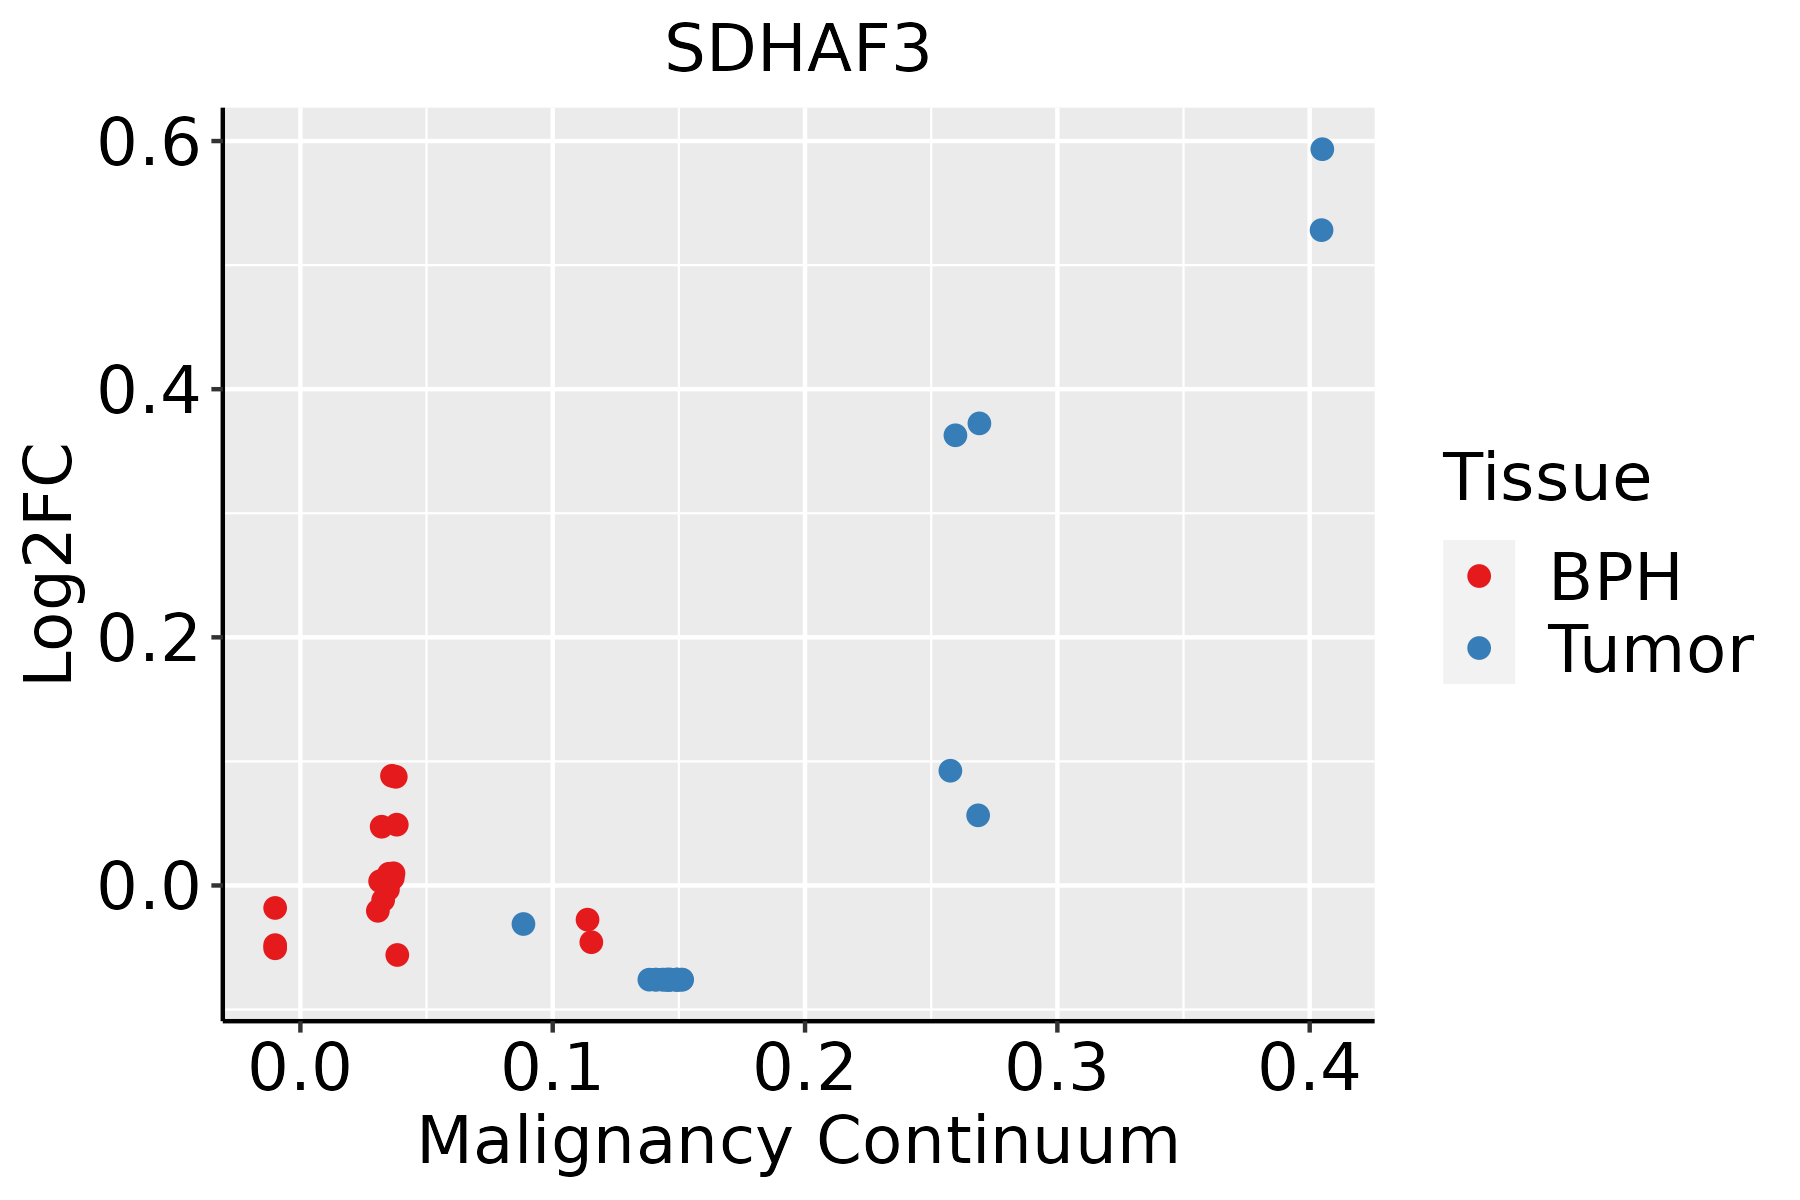 | BPH: Benign Prostatic Hyperplasia |
| Thyroid | 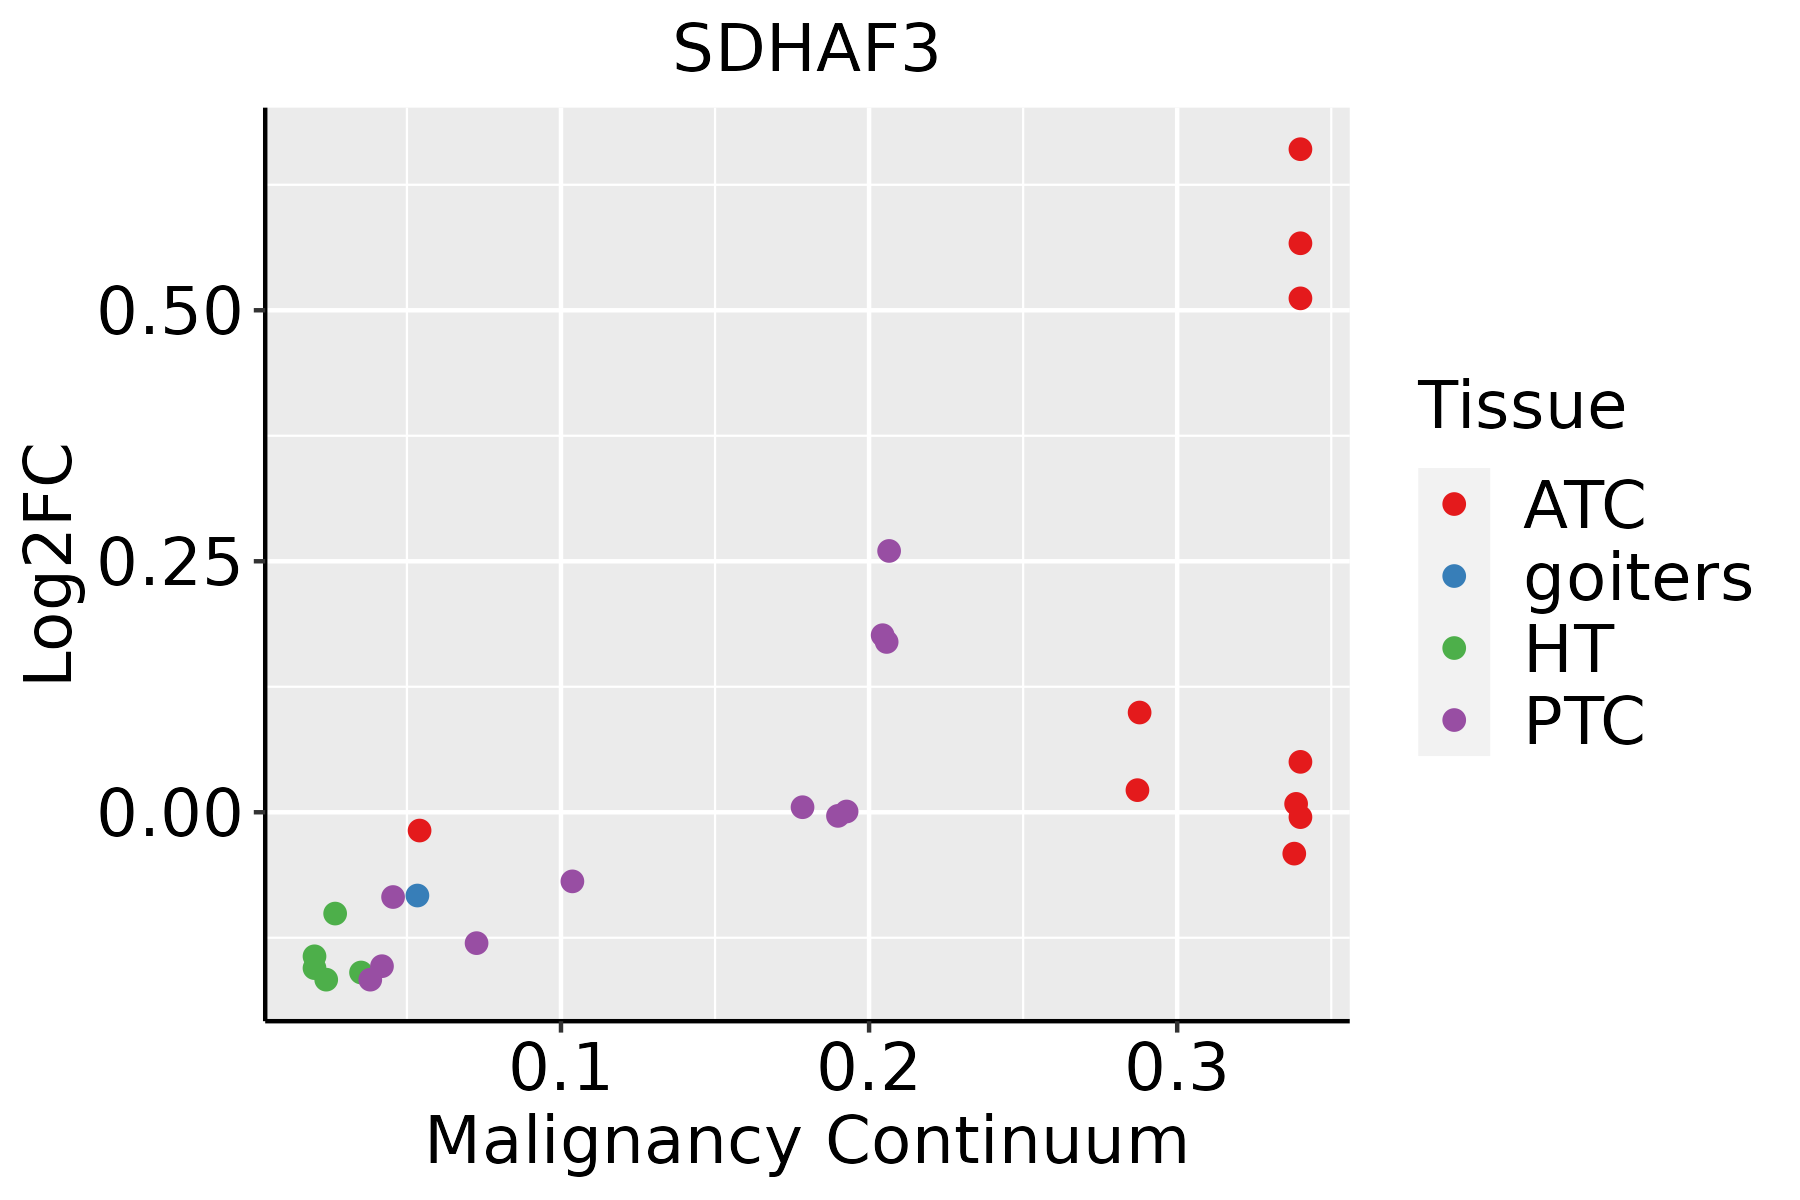 | ATC: Anaplastic thyroid cancer |
| HT: Hashimoto's thyroiditis | ||
| PTC: Papillary thyroid cancer |
| ∗log2FC in expression of this searched gene in stem-like cells from each diseased tissue sample relative to stem-like cells in normal samples in each tissue plotted against the malignancy continuum. Samples are colored based on if they are from different disease stage. |
Top |
Malignant transformation related pathway analysis |
| Find out the enriched GO biological processes and KEGG pathways involved in transition from healthy to precancer to cancer |
| Tissue | Disease Stage | Enriched GO biological Processes |
| Colorectum | AD |  |
| Colorectum | SER |  |
| Colorectum | MSS |  |
| Colorectum | MSI-H |  |
| Colorectum | FAP |  |
| ∗Top 15 enriched GO BP terms are showed in the bar plot of each disease state in each tissue. Each row represents a significant GO biological process which is colored according to the -log10(p.adjust). |
| Page: 1 2 3 4 5 6 7 8 9 |
| GO ID | Tissue | Disease Stage | Description | Gene Ratio | Bg Ratio | pvalue | p.adjust | Count |
| GO:00061111 | Liver | HCC | regulation of gluconeogenesis | 31/7958 | 48/18723 | 1.66e-03 | 8.71e-03 | 31 |
| GO:00432551 | Liver | HCC | regulation of carbohydrate biosynthetic process | 56/7958 | 97/18723 | 1.75e-03 | 9.11e-03 | 56 |
| GO:003310818 | Oral cavity | OSCC | mitochondrial respiratory chain complex assembly | 75/7305 | 93/18723 | 2.17e-16 | 1.68e-14 | 75 |
| GO:00059968 | Oral cavity | OSCC | monosaccharide metabolic process | 129/7305 | 257/18723 | 1.63e-04 | 1.13e-03 | 129 |
| GO:00193188 | Oral cavity | OSCC | hexose metabolic process | 118/7305 | 237/18723 | 4.53e-04 | 2.73e-03 | 118 |
| GO:00060068 | Oral cavity | OSCC | glucose metabolic process | 98/7305 | 196/18723 | 1.10e-03 | 5.63e-03 | 98 |
| GO:00620128 | Oral cavity | OSCC | regulation of small molecule metabolic process | 155/7305 | 334/18723 | 3.30e-03 | 1.41e-02 | 155 |
| GO:00160513 | Oral cavity | OSCC | carbohydrate biosynthetic process | 97/7305 | 202/18723 | 5.50e-03 | 2.13e-02 | 97 |
| GO:00436484 | Oral cavity | OSCC | dicarboxylic acid metabolic process | 50/7305 | 96/18723 | 6.24e-03 | 2.35e-02 | 50 |
| GO:00442625 | Oral cavity | OSCC | cellular carbohydrate metabolic process | 130/7305 | 283/18723 | 9.98e-03 | 3.49e-02 | 130 |
| GO:003310819 | Oral cavity | LP | mitochondrial respiratory chain complex assembly | 63/4623 | 93/18723 | 2.24e-18 | 4.13e-16 | 63 |
| GO:000599613 | Oral cavity | LP | monosaccharide metabolic process | 86/4623 | 257/18723 | 9.13e-04 | 7.79e-03 | 86 |
| GO:001931813 | Oral cavity | LP | hexose metabolic process | 78/4623 | 237/18723 | 2.55e-03 | 1.80e-02 | 78 |
| GO:000600614 | Oral cavity | LP | glucose metabolic process | 64/4623 | 196/18723 | 7.09e-03 | 3.98e-02 | 64 |
| GO:003310817 | Prostate | Tumor | mitochondrial respiratory chain complex assembly | 47/3246 | 93/18723 | 2.28e-13 | 2.49e-11 | 47 |
| GO:000600613 | Prostate | Tumor | glucose metabolic process | 55/3246 | 196/18723 | 1.22e-04 | 1.14e-03 | 55 |
| GO:000610912 | Prostate | Tumor | regulation of carbohydrate metabolic process | 50/3246 | 178/18723 | 2.36e-04 | 2.00e-03 | 50 |
| GO:006201214 | Prostate | Tumor | regulation of small molecule metabolic process | 83/3246 | 334/18723 | 2.96e-04 | 2.39e-03 | 83 |
| GO:00193187 | Prostate | Tumor | hexose metabolic process | 59/3246 | 237/18723 | 1.96e-03 | 1.14e-02 | 59 |
| GO:001067511 | Prostate | Tumor | regulation of cellular carbohydrate metabolic process | 39/3246 | 146/18723 | 2.93e-03 | 1.58e-02 | 39 |
| Page: 1 2 3 4 5 6 |
| Pathway ID | Tissue | Disease Stage | Description | Gene Ratio | Bg Ratio | pvalue | p.adjust | qvalue | Count |
| Page: 1 |
Top |
Cell-cell communication analysis |
| Identification of potential cell-cell interactions between two cell types and their ligand-receptor pairs for different disease states |
| Ligand | Receptor | LRpair | Pathway | Tissue | Disease Stage |
| Page: 1 |
Top |
Single-cell gene regulatory network inference analysis |
| Find out the significant the regulons (TFs) and the target genes of each regulon across cell types for different disease states |
| TF | Cell Type | Tissue | Disease Stage | Target Gene | RSS | Regulon Activity |
| ∗The dot plots of a searched regulon are shown for all cell subpopulations in each disease state of each tissue based on the regulon specific score inferred using pySCENIC and by calculating the average expression. |
| Page: 1 |
Top |
Somatic mutation of malignant transformation related genes |
| Annotation of somatic variants for genes involved in malignant transformation |
| Hugo Symbol | Variant Class | Variant Classification | dbSNP RS | HGVSc | HGVSp | HGVSp Short | SWISSPROT | BIOTYPE | SIFT | PolyPhen | Tumor Sample Barcode | Tissue | Histology | Sex | Age | Stage | Therapy Types | Drugs | Outcome |
| SDHAF3 | SNV | Missense_Mutation | rs781174674 | c.70C>T | p.Pro24Ser | p.P24S | Q9NRP4 | protein_coding | deleterious(0) | probably_damaging(1) | TCGA-BH-A0DZ-01 | Breast | breast invasive carcinoma | Female | <65 | I/II | Chemotherapy | docetaxel | SD |
| SDHAF3 | SNV | Missense_Mutation | rs755073792 | c.208N>A | p.Glu70Lys | p.E70K | Q9NRP4 | protein_coding | tolerated(0.59) | benign(0.137) | TCGA-AA-A010-01 | Colorectum | colon adenocarcinoma | Female | <65 | I/II | Chemotherapy | folinic | CR |
| SDHAF3 | SNV | Missense_Mutation | c.134N>C | p.Val45Ala | p.V45A | Q9NRP4 | protein_coding | tolerated(0.89) | benign(0.005) | TCGA-AY-6197-01 | Colorectum | colon adenocarcinoma | Male | <65 | I/II | Unknown | Unknown | SD | |
| SDHAF3 | SNV | Missense_Mutation | novel | c.190T>G | p.Leu64Val | p.L64V | Q9NRP4 | protein_coding | deleterious(0.03) | possibly_damaging(0.848) | TCGA-CA-6717-01 | Colorectum | colon adenocarcinoma | Male | <65 | I/II | Chemotherapy | oxaliplatin | CR |
| SDHAF3 | insertion | Frame_Shift_Ins | novel | c.372_373insCATGC | p.Phe125HisfsTer10 | p.F125Hfs*10 | Q9NRP4 | protein_coding | TCGA-AM-5820-01 | Colorectum | colon adenocarcinoma | Female | <65 | I/II | Unknown | Unknown | SD | ||
| SDHAF3 | SNV | Missense_Mutation | rs755073792 | c.208G>A | p.Glu70Lys | p.E70K | Q9NRP4 | protein_coding | tolerated(0.59) | benign(0.137) | TCGA-A5-A0G1-01 | Endometrium | uterine corpus endometrioid carcinoma | Female | >=65 | I/II | Unknown | Unknown | SD |
| SDHAF3 | SNV | Missense_Mutation | c.188N>T | p.Ala63Val | p.A63V | Q9NRP4 | protein_coding | tolerated(0.89) | benign(0) | TCGA-BS-A0UF-01 | Endometrium | uterine corpus endometrioid carcinoma | Female | >=65 | I/II | Unknown | Unknown | SD | |
| SDHAF3 | SNV | Missense_Mutation | rs755073792 | c.208N>A | p.Glu70Lys | p.E70K | Q9NRP4 | protein_coding | tolerated(0.59) | benign(0.137) | TCGA-DF-A2KU-01 | Endometrium | uterine corpus endometrioid carcinoma | Female | Unknown | I/II | Unknown | Unknown | SD |
| SDHAF3 | SNV | Missense_Mutation | rs755073792 | c.208N>A | p.Glu70Lys | p.E70K | Q9NRP4 | protein_coding | tolerated(0.59) | benign(0.137) | TCGA-EO-A3B0-01 | Endometrium | uterine corpus endometrioid carcinoma | Female | <65 | III/IV | Unknown | Unknown | SD |
| SDHAF3 | SNV | Missense_Mutation | rs754390024 | c.41N>C | p.Lys14Thr | p.K14T | Q9NRP4 | protein_coding | deleterious(0) | benign(0.38) | TCGA-QF-A5YS-01 | Endometrium | uterine corpus endometrioid carcinoma | Female | <65 | I/II | Chemotherapy | carboplatin | CR |
| Page: 1 2 |
Top |
Related drugs of malignant transformation related genes |
| Identification of chemicals and drugs interact with genes involved in malignant transfromation |
| (DGIdb 4.0) |
| Entrez ID | Symbol | Category | Interaction Types | Drug Claim Name | Drug Name | PMIDs |
| Page: 1 |

Copyright 2023-Present -The University of Texas Health Science Center at Houston |