
|
|||||
|
 | |
| |
| |
| |
| |
| |
|
Gene: SAMD4B |
Gene summary for SAMD4B |
| Gene information | Species | Human | Gene symbol | SAMD4B | Gene ID | 55095 |
| Gene name | sterile alpha motif domain containing 4B | |
| Gene Alias | SMGB | |
| Cytomap | 19q13.2 | |
| Gene Type | protein-coding | GO ID | GO:0000288 | UniProtAcc | M0QZ22 |
Top |
Malignant transformation analysis |
| Identification of the aberrant gene expression in precancerous and cancerous lesions by comparing the gene expression of stem-like cells in diseased tissues with normal stem cells |
| Entrez ID | Symbol | Replicates | Species | Organ | Tissue | Adj P-value | Log2FC | Malignancy |
| 55095 | SAMD4B | LZE4T | Human | Esophagus | ESCC | 1.29e-03 | -3.68e-02 | 0.0811 |
| 55095 | SAMD4B | LZE7T | Human | Esophagus | ESCC | 4.84e-06 | 2.77e-01 | 0.0667 |
| 55095 | SAMD4B | LZE8T | Human | Esophagus | ESCC | 2.96e-15 | 1.28e-01 | 0.067 |
| 55095 | SAMD4B | LZE22D1 | Human | Esophagus | HGIN | 1.05e-02 | -3.64e-02 | 0.0595 |
| 55095 | SAMD4B | LZE22T | Human | Esophagus | ESCC | 7.60e-05 | 2.67e-01 | 0.068 |
| 55095 | SAMD4B | LZE24T | Human | Esophagus | ESCC | 5.31e-18 | 3.02e-01 | 0.0596 |
| 55095 | SAMD4B | LZE21T | Human | Esophagus | ESCC | 8.29e-04 | 1.23e-01 | 0.0655 |
| 55095 | SAMD4B | P1T-E | Human | Esophagus | ESCC | 1.29e-03 | 6.27e-01 | 0.0875 |
| 55095 | SAMD4B | P2T-E | Human | Esophagus | ESCC | 1.92e-22 | 1.86e-01 | 0.1177 |
| 55095 | SAMD4B | P4T-E | Human | Esophagus | ESCC | 6.46e-09 | 1.64e-01 | 0.1323 |
| 55095 | SAMD4B | P5T-E | Human | Esophagus | ESCC | 1.69e-19 | 3.19e-02 | 0.1327 |
| 55095 | SAMD4B | P8T-E | Human | Esophagus | ESCC | 1.18e-33 | 5.75e-01 | 0.0889 |
| 55095 | SAMD4B | P9T-E | Human | Esophagus | ESCC | 7.04e-13 | 1.45e-01 | 0.1131 |
| 55095 | SAMD4B | P10T-E | Human | Esophagus | ESCC | 9.82e-23 | 3.26e-01 | 0.116 |
| 55095 | SAMD4B | P11T-E | Human | Esophagus | ESCC | 1.99e-13 | 4.75e-01 | 0.1426 |
| 55095 | SAMD4B | P12T-E | Human | Esophagus | ESCC | 6.43e-13 | 1.06e-01 | 0.1122 |
| 55095 | SAMD4B | P15T-E | Human | Esophagus | ESCC | 4.80e-11 | 2.26e-01 | 0.1149 |
| 55095 | SAMD4B | P16T-E | Human | Esophagus | ESCC | 7.15e-12 | 6.18e-02 | 0.1153 |
| 55095 | SAMD4B | P17T-E | Human | Esophagus | ESCC | 1.38e-04 | 2.97e-01 | 0.1278 |
| 55095 | SAMD4B | P19T-E | Human | Esophagus | ESCC | 1.66e-04 | 2.92e-01 | 0.1662 |
| Page: 1 2 3 4 5 6 |
| Tissue | Expression Dynamics | Abbreviation |
| Esophagus |  | ESCC: Esophageal squamous cell carcinoma |
| HGIN: High-grade intraepithelial neoplasias | ||
| LGIN: Low-grade intraepithelial neoplasias | ||
| Liver | 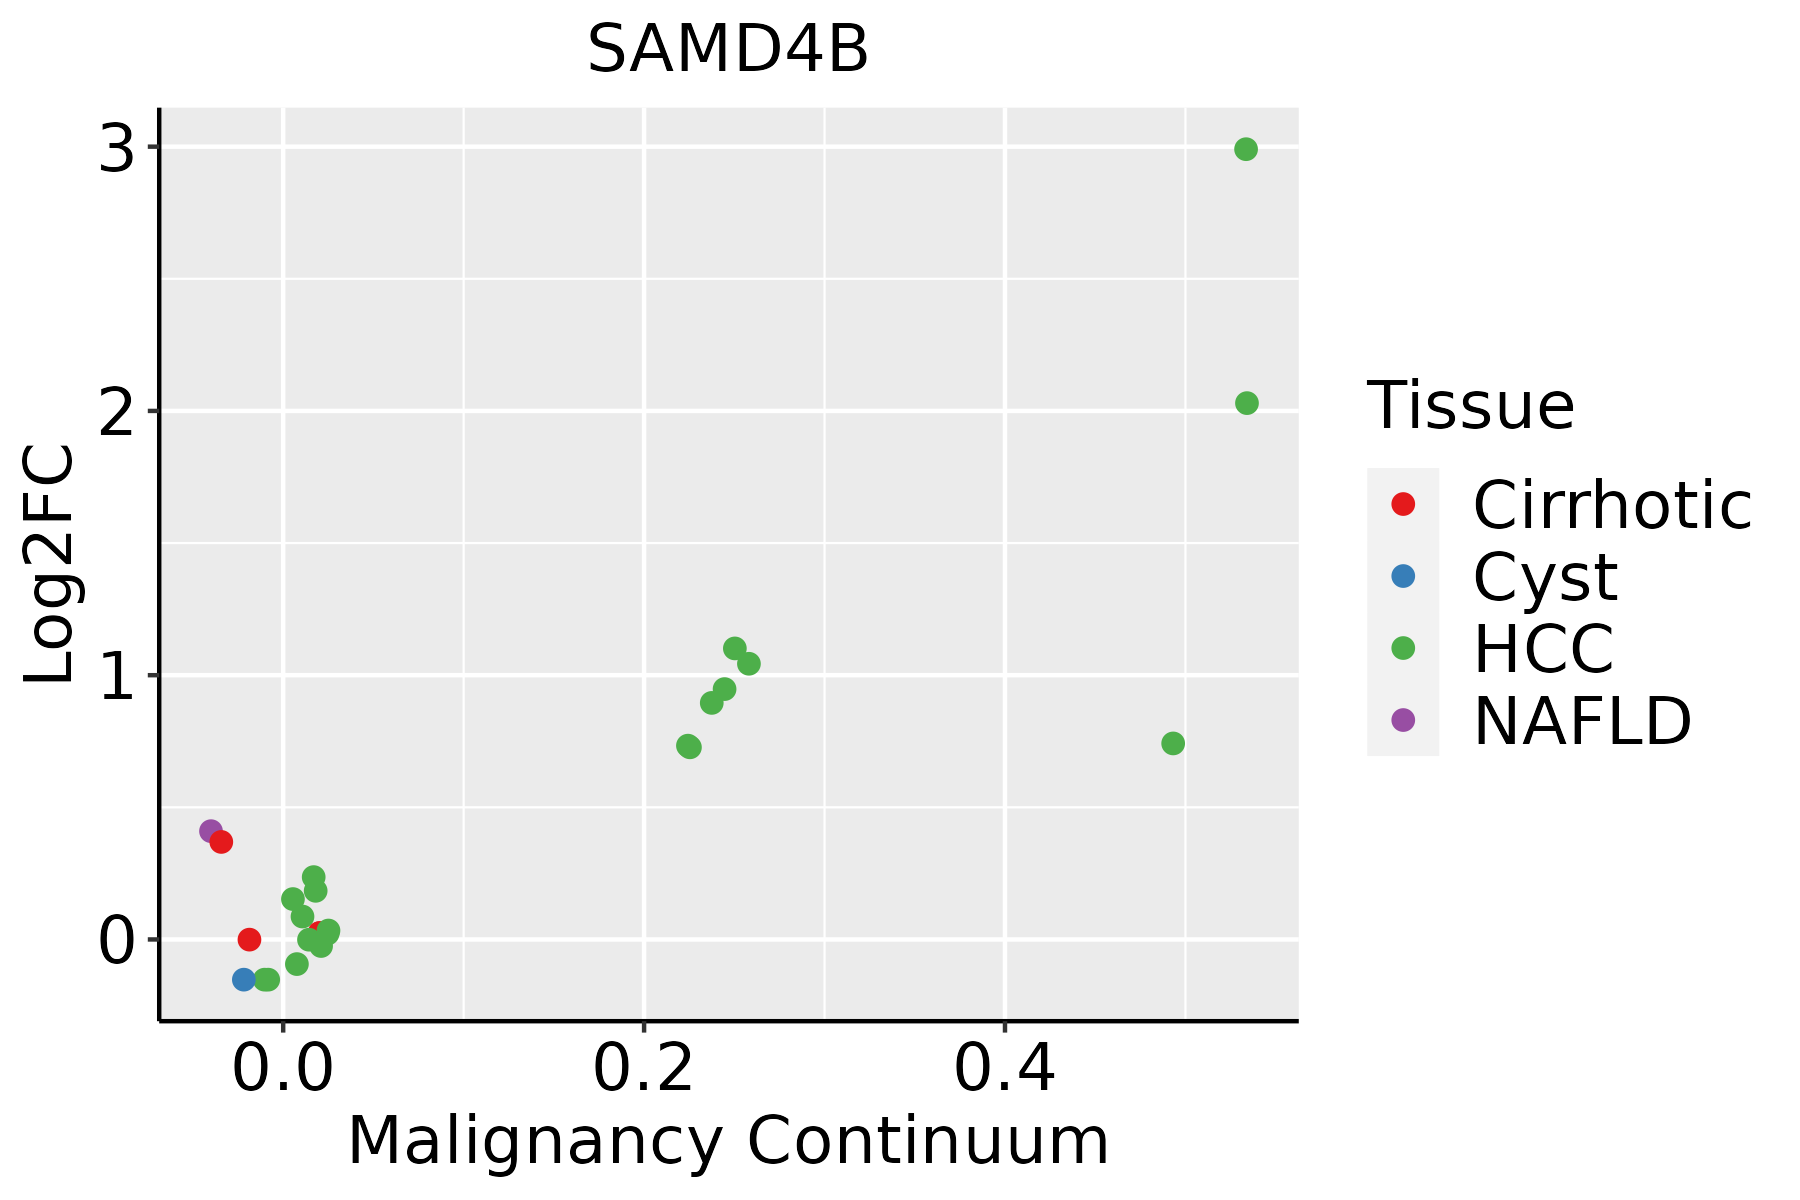 | HCC: Hepatocellular carcinoma |
| NAFLD: Non-alcoholic fatty liver disease | ||
| Oral Cavity |  | EOLP: Erosive Oral lichen planus |
| LP: leukoplakia | ||
| NEOLP: Non-erosive oral lichen planus | ||
| OSCC: Oral squamous cell carcinoma | ||
| Prostate | 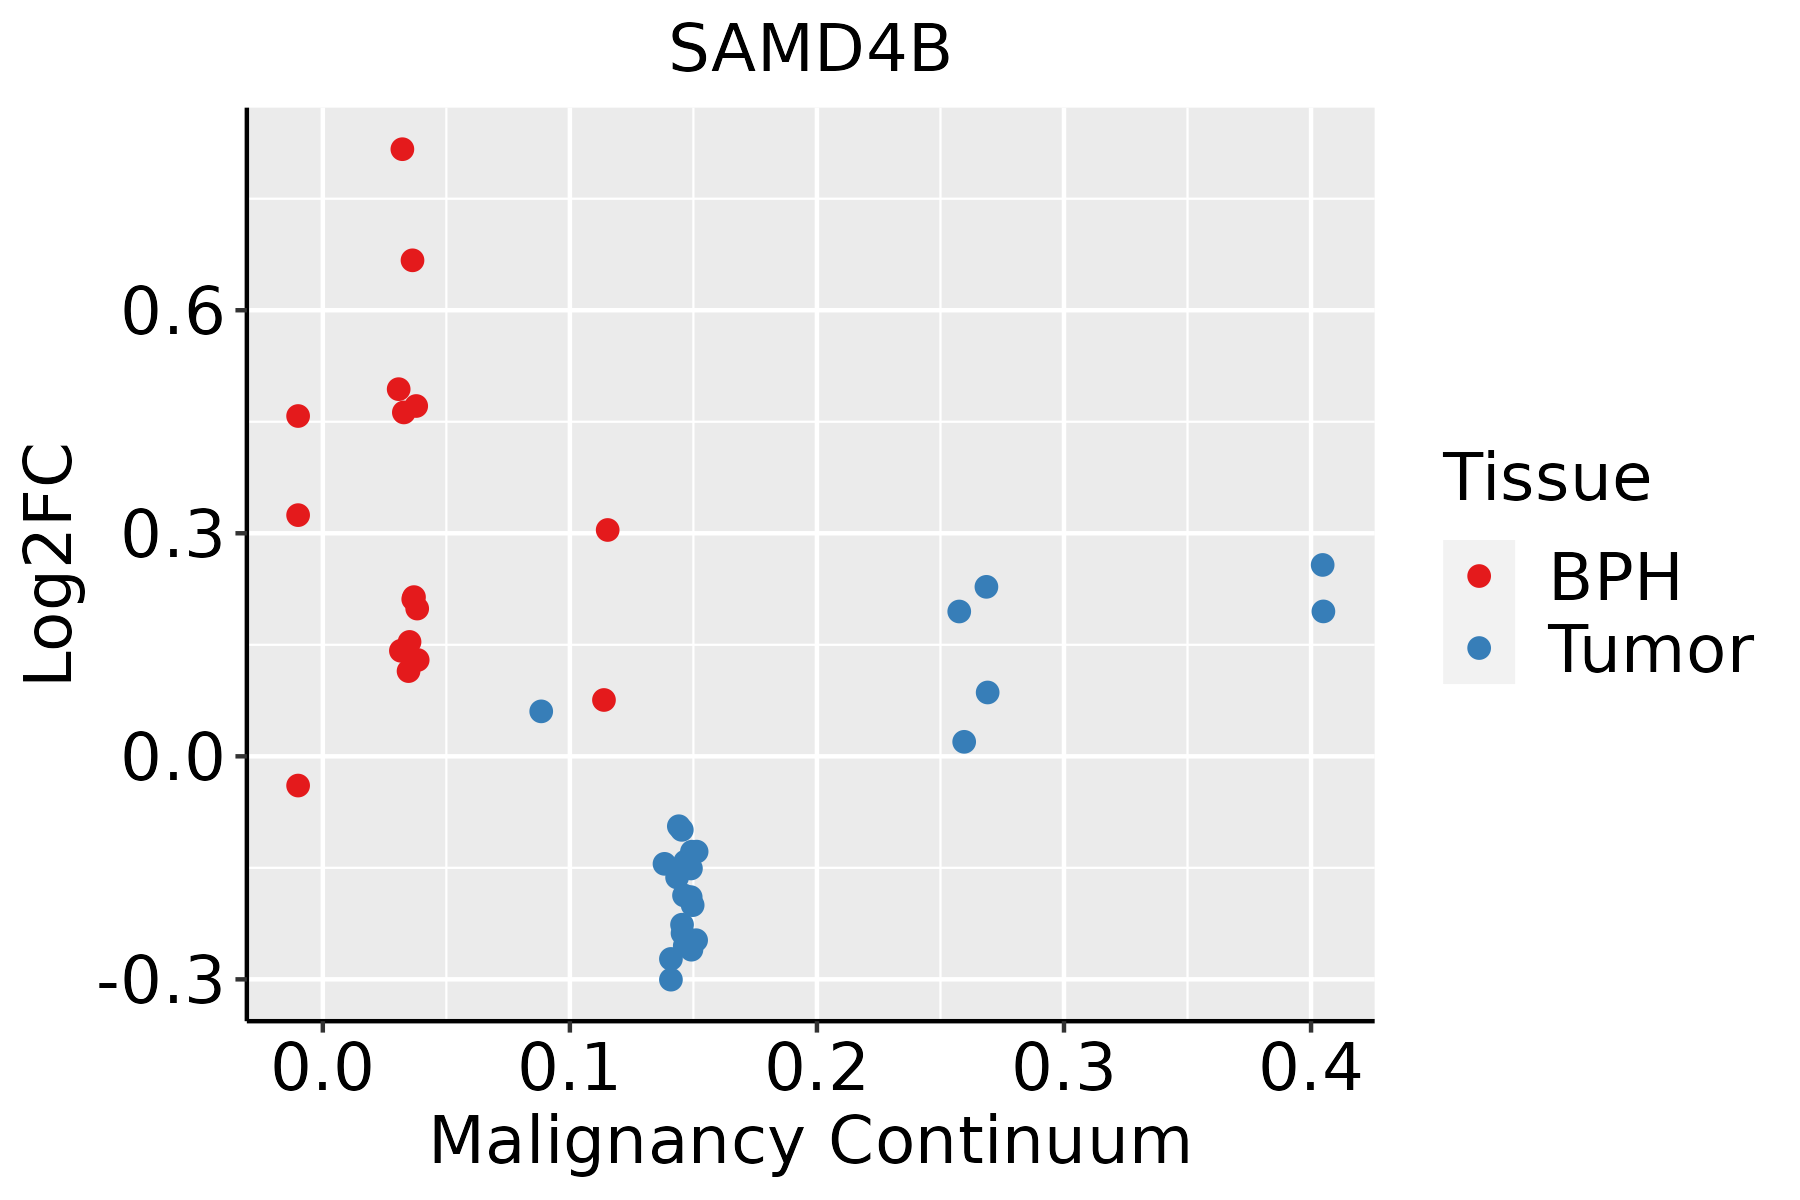 | BPH: Benign Prostatic Hyperplasia |
| Thyroid |  | ATC: Anaplastic thyroid cancer |
| HT: Hashimoto's thyroiditis | ||
| PTC: Papillary thyroid cancer |
| ∗log2FC in expression of this searched gene in stem-like cells from each diseased tissue sample relative to stem-like cells in normal samples in each tissue plotted against the malignancy continuum. Samples are colored based on if they are from different disease stage. |
Top |
Malignant transformation related pathway analysis |
| Find out the enriched GO biological processes and KEGG pathways involved in transition from healthy to precancer to cancer |
| Tissue | Disease Stage | Enriched GO biological Processes |
| Colorectum | AD |  |
| Colorectum | SER |  |
| Colorectum | MSS |  |
| Colorectum | MSI-H |  |
| Colorectum | FAP |  |
| ∗Top 15 enriched GO BP terms are showed in the bar plot of each disease state in each tissue. Each row represents a significant GO biological process which is colored according to the -log10(p.adjust). |
| Page: 1 2 3 4 5 6 7 8 9 |
| GO ID | Tissue | Disease Stage | Description | Gene Ratio | Bg Ratio | pvalue | p.adjust | Count |
| GO:19033134 | Liver | NAFLD | positive regulation of mRNA metabolic process | 28/1882 | 118/18723 | 1.21e-05 | 3.70e-04 | 28 |
| GO:00507794 | Liver | NAFLD | RNA destabilization | 23/1882 | 88/18723 | 1.34e-05 | 3.97e-04 | 23 |
| GO:00009564 | Liver | NAFLD | nuclear-transcribed mRNA catabolic process | 26/1882 | 112/18723 | 3.68e-05 | 9.23e-04 | 26 |
| GO:00171483 | Liver | NAFLD | negative regulation of translation | 43/1882 | 245/18723 | 2.05e-04 | 3.56e-03 | 43 |
| GO:00342493 | Liver | NAFLD | negative regulation of cellular amide metabolic process | 46/1882 | 273/18723 | 3.27e-04 | 5.04e-03 | 46 |
| GO:00002894 | Liver | NAFLD | nuclear-transcribed mRNA poly(A) tail shortening | 10/1882 | 29/18723 | 3.42e-04 | 5.22e-03 | 10 |
| GO:00002884 | Liver | NAFLD | nuclear-transcribed mRNA catabolic process, deadenylation-dependent decay | 14/1882 | 56/18723 | 1.03e-03 | 1.21e-02 | 14 |
| GO:000989622 | Liver | HCC | positive regulation of catabolic process | 335/7958 | 492/18723 | 3.83e-31 | 1.87e-28 | 335 |
| GO:003133122 | Liver | HCC | positive regulation of cellular catabolic process | 295/7958 | 427/18723 | 3.20e-29 | 1.45e-26 | 295 |
| GO:004427021 | Liver | HCC | cellular nitrogen compound catabolic process | 303/7958 | 451/18723 | 9.76e-27 | 3.64e-24 | 303 |
| GO:004670021 | Liver | HCC | heterocycle catabolic process | 299/7958 | 445/18723 | 2.07e-26 | 7.29e-24 | 299 |
| GO:190136121 | Liver | HCC | organic cyclic compound catabolic process | 325/7958 | 495/18723 | 6.52e-26 | 2.18e-23 | 325 |
| GO:001943921 | Liver | HCC | aromatic compound catabolic process | 309/7958 | 467/18723 | 1.56e-25 | 4.94e-23 | 309 |
| GO:000640121 | Liver | HCC | RNA catabolic process | 201/7958 | 278/18723 | 3.88e-24 | 1.02e-21 | 201 |
| GO:003465521 | Liver | HCC | nucleobase-containing compound catabolic process | 273/7958 | 407/18723 | 4.84e-24 | 1.23e-21 | 273 |
| GO:190331121 | Liver | HCC | regulation of mRNA metabolic process | 205/7958 | 288/18723 | 3.38e-23 | 6.90e-21 | 205 |
| GO:000640221 | Liver | HCC | mRNA catabolic process | 169/7958 | 232/18723 | 4.50e-21 | 6.96e-19 | 169 |
| GO:000641722 | Liver | HCC | regulation of translation | 287/7958 | 468/18723 | 8.79e-17 | 8.08e-15 | 287 |
| GO:004348721 | Liver | HCC | regulation of RNA stability | 119/7958 | 170/18723 | 3.20e-13 | 1.71e-11 | 119 |
| GO:000095621 | Liver | HCC | nuclear-transcribed mRNA catabolic process | 84/7958 | 112/18723 | 2.54e-12 | 1.18e-10 | 84 |
| Page: 1 2 3 4 5 6 7 8 9 10 11 12 13 |
| Pathway ID | Tissue | Disease Stage | Description | Gene Ratio | Bg Ratio | pvalue | p.adjust | qvalue | Count |
| Page: 1 |
Top |
Cell-cell communication analysis |
| Identification of potential cell-cell interactions between two cell types and their ligand-receptor pairs for different disease states |
| Ligand | Receptor | LRpair | Pathway | Tissue | Disease Stage |
| Page: 1 |
Top |
Single-cell gene regulatory network inference analysis |
| Find out the significant the regulons (TFs) and the target genes of each regulon across cell types for different disease states |
| TF | Cell Type | Tissue | Disease Stage | Target Gene | RSS | Regulon Activity |
| ∗The dot plots of a searched regulon are shown for all cell subpopulations in each disease state of each tissue based on the regulon specific score inferred using pySCENIC and by calculating the average expression. |
| Page: 1 |
Top |
Somatic mutation of malignant transformation related genes |
| Annotation of somatic variants for genes involved in malignant transformation |
| Hugo Symbol | Variant Class | Variant Classification | dbSNP RS | HGVSc | HGVSp | HGVSp Short | SWISSPROT | BIOTYPE | SIFT | PolyPhen | Tumor Sample Barcode | Tissue | Histology | Sex | Age | Stage | Therapy Types | Drugs | Outcome |
| SAMD4B | SNV | Missense_Mutation | novel | c.844G>A | p.Glu282Lys | p.E282K | Q5PRF9 | protein_coding | tolerated(0.11) | probably_damaging(0.956) | TCGA-AC-A5XS-01 | Breast | breast invasive carcinoma | Female | >=65 | I/II | Hormone Therapy | femara | SD |
| SAMD4B | insertion | Nonsense_Mutation | novel | c.1873_1874insTCTCCTTTGAGAATTGAAGATTGGAGAACTGTTTTGAGTGGACAGT | p.Gly625ValfsTer6 | p.G625Vfs*6 | Q5PRF9 | protein_coding | TCGA-A8-A07R-01 | Breast | breast invasive carcinoma | Female | >=65 | III/IV | Ancillary | zoledronic | SD | ||
| SAMD4B | SNV | Missense_Mutation | novel | c.2023C>A | p.Leu675Met | p.L675M | Q5PRF9 | protein_coding | deleterious(0) | probably_damaging(0.99) | TCGA-ZJ-AAXT-01 | Cervix | cervical & endocervical cancer | Female | <65 | III/IV | Unknown | Unknown | SD |
| SAMD4B | SNV | Missense_Mutation | novel | c.1133N>C | p.Asn378Thr | p.N378T | Q5PRF9 | protein_coding | tolerated(0.45) | possibly_damaging(0.678) | TCGA-A6-5665-01 | Colorectum | colon adenocarcinoma | Female | >=65 | I/II | Unknown | Unknown | PD |
| SAMD4B | SNV | Missense_Mutation | rs774597687 | c.601N>A | p.Val201Met | p.V201M | Q5PRF9 | protein_coding | tolerated(0.26) | benign(0.006) | TCGA-AA-3713-01 | Colorectum | colon adenocarcinoma | Male | >=65 | III/IV | Chemotherapy | 5-fluorouracil | PR |
| SAMD4B | SNV | Missense_Mutation | novel | c.1680N>G | p.Ile560Met | p.I560M | Q5PRF9 | protein_coding | deleterious(0.02) | benign(0.118) | TCGA-AA-A02R-01 | Colorectum | colon adenocarcinoma | Female | >=65 | I/II | Unknown | Unknown | PD |
| SAMD4B | SNV | Missense_Mutation | c.1637G>T | p.Arg546Leu | p.R546L | Q5PRF9 | protein_coding | deleterious(0) | probably_damaging(0.972) | TCGA-AD-5900-01 | Colorectum | colon adenocarcinoma | Male | >=65 | I/II | Unknown | Unknown | SD | |
| SAMD4B | SNV | Missense_Mutation | novel | c.2048C>T | p.Ala683Val | p.A683V | Q5PRF9 | protein_coding | deleterious(0) | probably_damaging(0.968) | TCGA-CA-6717-01 | Colorectum | colon adenocarcinoma | Male | <65 | I/II | Chemotherapy | oxaliplatin | CR |
| SAMD4B | SNV | Missense_Mutation | c.1340N>G | p.Tyr447Cys | p.Y447C | Q5PRF9 | protein_coding | tolerated(0.17) | benign(0.171) | TCGA-CM-6674-01 | Colorectum | colon adenocarcinoma | Male | <65 | I/II | Unknown | Unknown | SD | |
| SAMD4B | SNV | Missense_Mutation | novel | c.1680N>G | p.Ile560Met | p.I560M | Q5PRF9 | protein_coding | deleterious(0.02) | benign(0.118) | TCGA-G4-6586-01 | Colorectum | colon adenocarcinoma | Female | >=65 | I/II | Unknown | Unknown | SD |
| Page: 1 2 3 4 5 6 |
Top |
Related drugs of malignant transformation related genes |
| Identification of chemicals and drugs interact with genes involved in malignant transfromation |
| (DGIdb 4.0) |
| Entrez ID | Symbol | Category | Interaction Types | Drug Claim Name | Drug Name | PMIDs |
| Page: 1 |

Copyright 2023-Present -The University of Texas Health Science Center at Houston |