Schematic overview of the cellular and molecular mechanisms involved in the cancer progression, including the proposed cellular and molecular mechanisms in cancer cells trajectory. AT1: alveolar type 1 cells; AT2: alveolar type 2 cells; AAH: atypical adenomatous hyperplasia; AIS: adenocarcinoma in situ; MIA: minimally invasive adenocarcinoma; IA: invasive adenocarcinoma; EMT: epithelial-mesenchymal transition

Home

Download

Statistics

Help

Contact

Center for Computational Systems Medicine
leaf

Gene summary

leaf

Malignant transformation analysis

leaf

Malignant transformation related pathway analysis

leaf

Cell-cell communication analysis

leaf

Single-cell gene regulatory network inference analysis

leaf

Somatic mutation of malignant transformation related genes

leaf

Related drugs of malignant transformation related genes

Gene: SAFB2

Gene summary for SAFB2

check button Gene summary.

Gene informationSpeciesHuman
Gene symbol

SAFB2

Gene ID

9667

Gene namescaffold attachment factor B2
Gene AliasSAFB2
Cytomap19p13.3
Gene Typeprotein-coding
GO ID

GO:0000003

UniProtAcc

Q14151


Top

Malignant transformation analysis

check button Identification of the aberrant gene expression in precancerous and cancerous lesions by comparing the gene expression of stem-like cells in diseased tissues with normal stem cells
check button Malignant transformation involving gene list.
Entrez IDSymbolReplicatesSpeciesOrganTissueAdj P-valueLog2FCMalignancy
9667SAFB2LZE4THumanEsophagusESCC9.90e-103.58e-010.0811
9667SAFB2LZE7THumanEsophagusESCC2.14e-177.93e-010.0667
9667SAFB2LZE8THumanEsophagusESCC1.45e-082.05e-010.067
9667SAFB2LZE20THumanEsophagusESCC3.30e-041.70e-010.0662
9667SAFB2LZE24THumanEsophagusESCC1.41e-174.40e-010.0596
9667SAFB2LZE6THumanEsophagusESCC1.39e-022.22e-010.0845
9667SAFB2P1T-EHumanEsophagusESCC2.09e-085.10e-010.0875
9667SAFB2P2T-EHumanEsophagusESCC1.13e-233.84e-010.1177
9667SAFB2P4T-EHumanEsophagusESCC6.14e-317.59e-010.1323
9667SAFB2P5T-EHumanEsophagusESCC6.56e-185.60e-010.1327
9667SAFB2P8T-EHumanEsophagusESCC1.73e-215.31e-010.0889
9667SAFB2P9T-EHumanEsophagusESCC5.26e-175.47e-010.1131
9667SAFB2P10T-EHumanEsophagusESCC2.74e-327.33e-010.116
9667SAFB2P11T-EHumanEsophagusESCC4.62e-115.20e-010.1426
9667SAFB2P12T-EHumanEsophagusESCC4.61e-286.12e-010.1122
9667SAFB2P15T-EHumanEsophagusESCC2.06e-235.34e-010.1149
9667SAFB2P16T-EHumanEsophagusESCC5.61e-173.46e-010.1153
9667SAFB2P17T-EHumanEsophagusESCC8.62e-092.83e-010.1278
9667SAFB2P19T-EHumanEsophagusESCC2.52e-065.65e-010.1662
9667SAFB2P20T-EHumanEsophagusESCC2.27e-225.26e-010.1124
Page: 1 2 3 4 5 6 

check button Transcriptomic changes along malignancy continuum.
TissueExpression DynamicsAbbreviation
EsophagusThe image shows the transcriptomic changes along malignancy continuum.log2FC in expression of this searched gene in stem-like cells from each diseased tissue sample relative to stem-like cells in normal samples in each tissue plotted against the malignancy continuum. Samples are colored based on if they are from different disease stage.
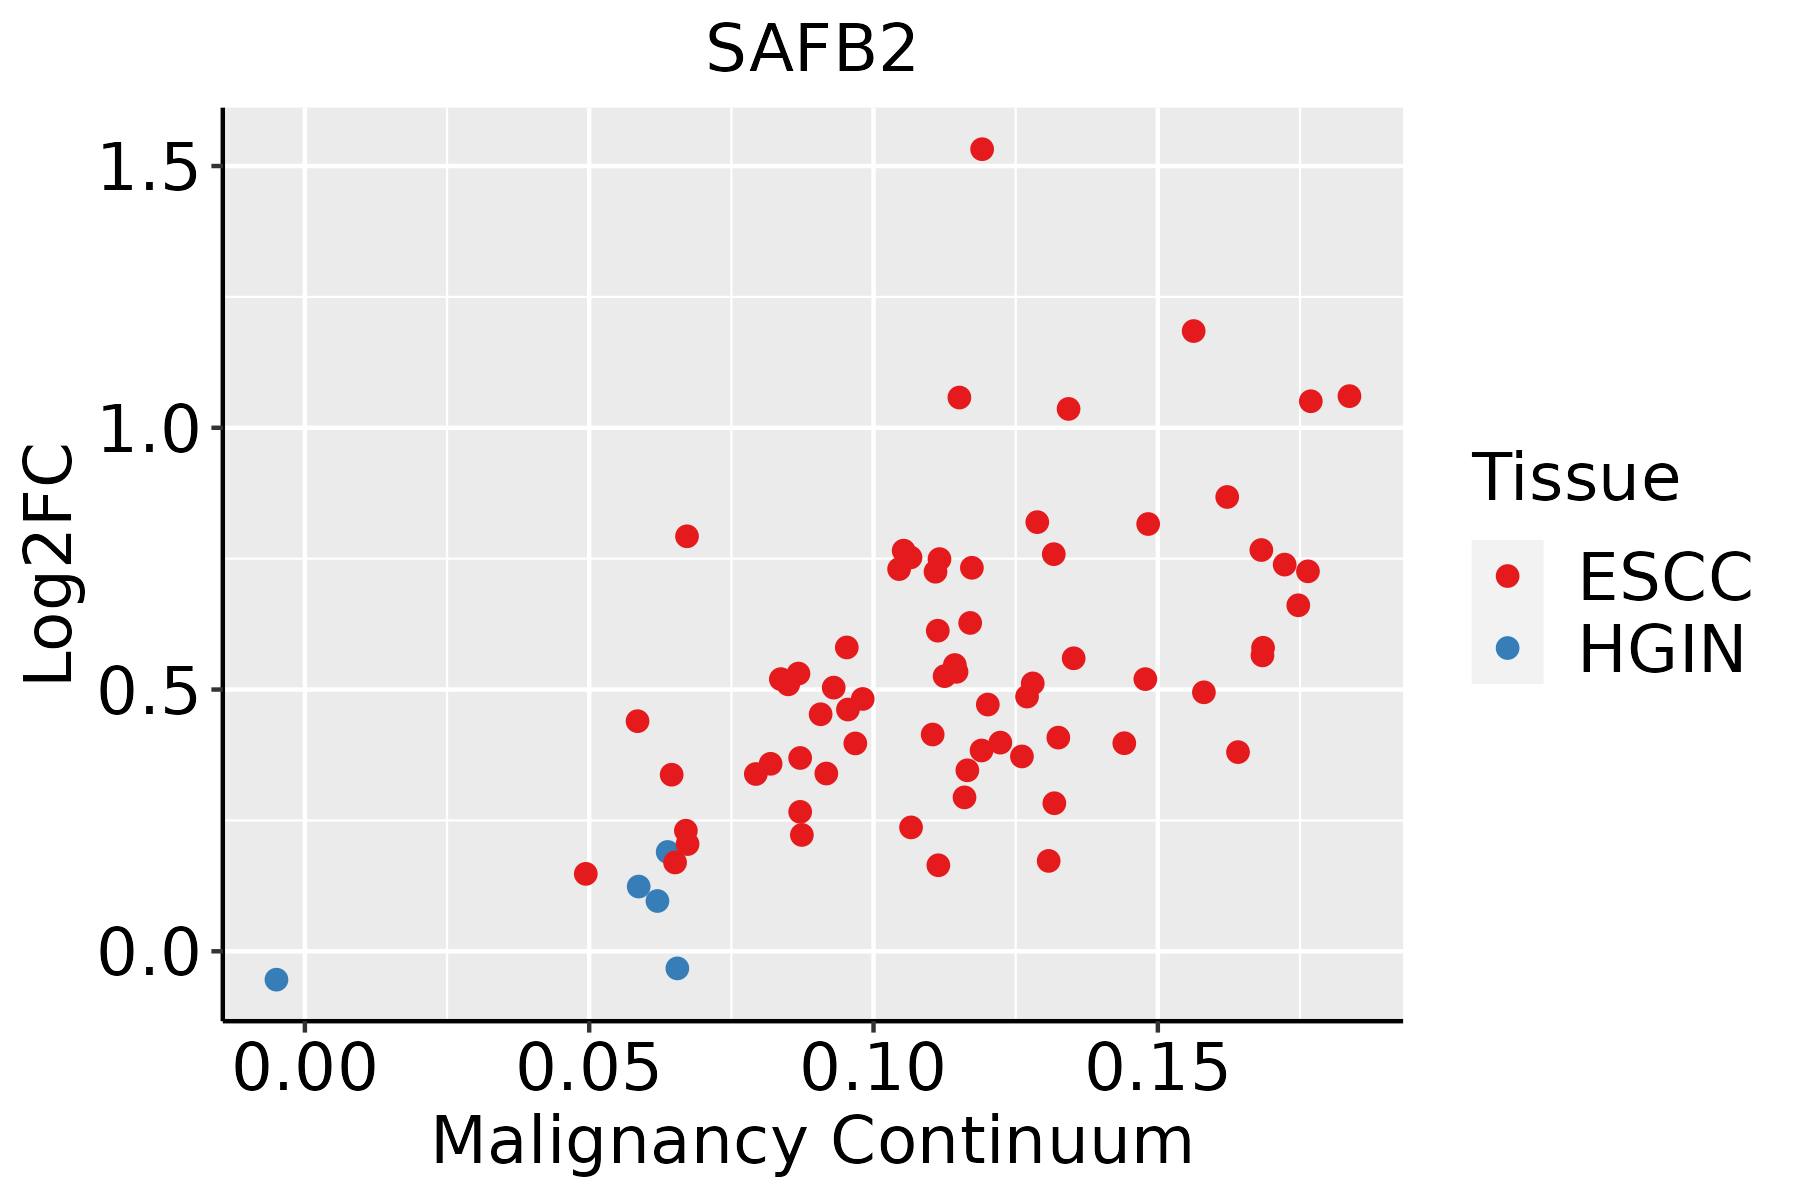
ESCC: Esophageal squamous cell carcinoma
HGIN: High-grade intraepithelial neoplasias
LGIN: Low-grade intraepithelial neoplasias
LiverThe image shows the transcriptomic changes along malignancy continuum.log2FC in expression of this searched gene in stem-like cells from each diseased tissue sample relative to stem-like cells in normal samples in each tissue plotted against the malignancy continuum. Samples are colored based on if they are from different disease stage.
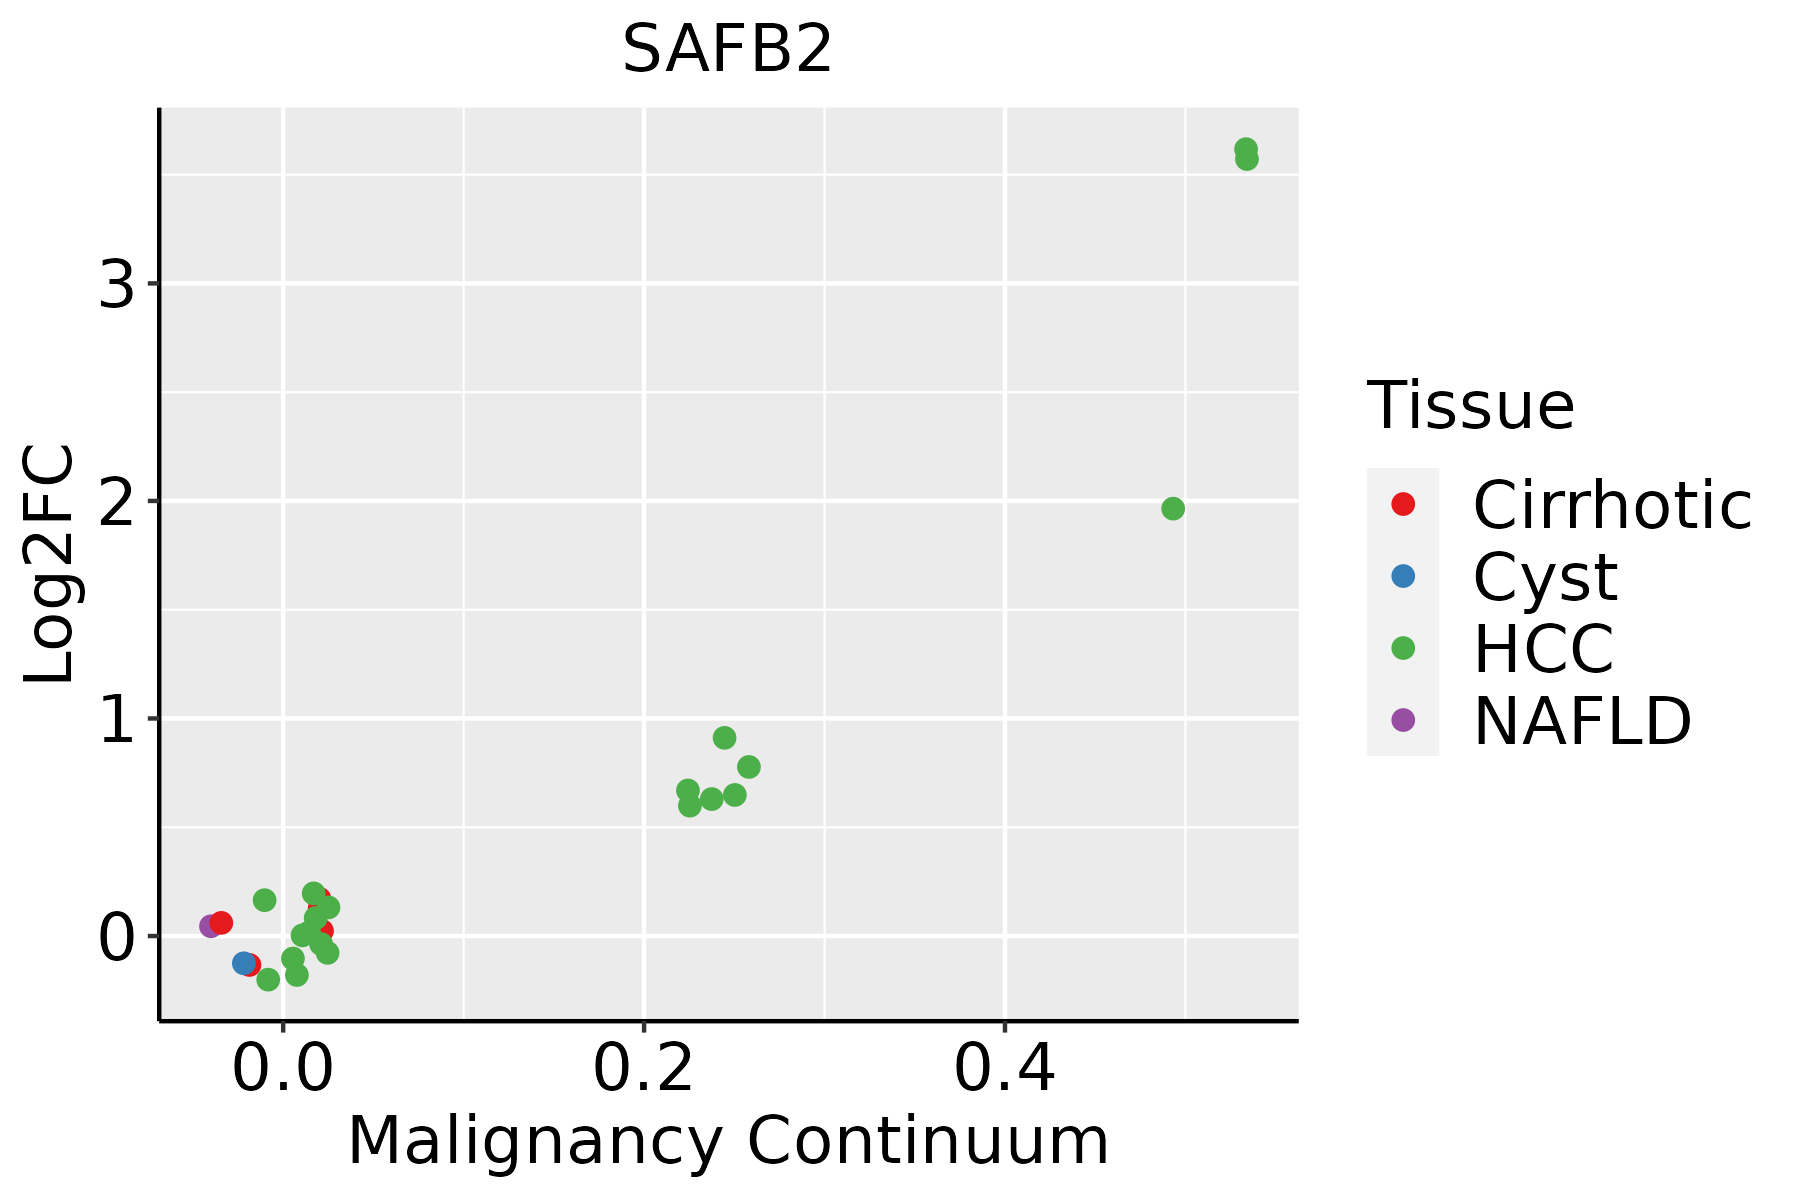
HCC: Hepatocellular carcinoma
NAFLD: Non-alcoholic fatty liver disease
Oral CavityThe image shows the transcriptomic changes along malignancy continuum.log2FC in expression of this searched gene in stem-like cells from each diseased tissue sample relative to stem-like cells in normal samples in each tissue plotted against the malignancy continuum. Samples are colored based on if they are from different disease stage.
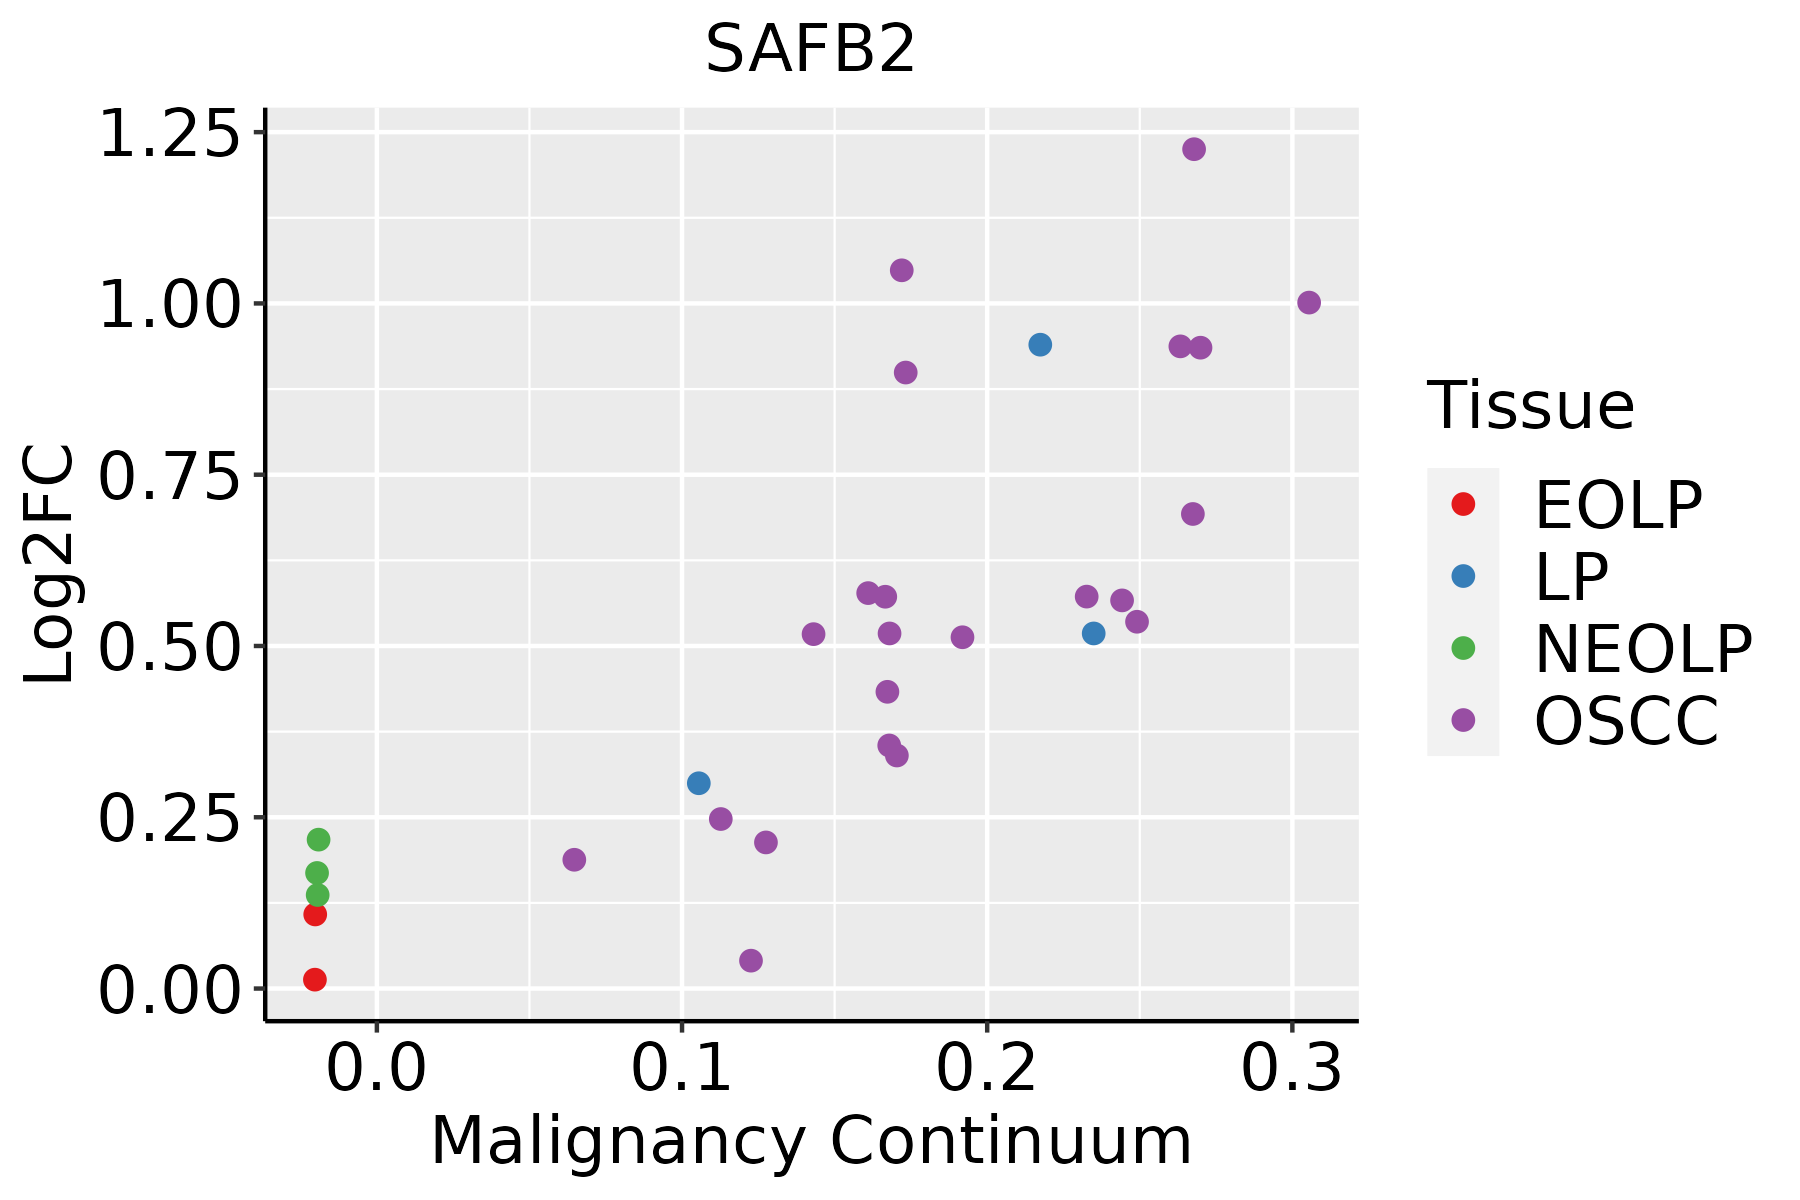
EOLP: Erosive Oral lichen planus
LP: leukoplakia
NEOLP: Non-erosive oral lichen planus
OSCC: Oral squamous cell carcinoma
ProstateThe image shows the transcriptomic changes along malignancy continuum.log2FC in expression of this searched gene in stem-like cells from each diseased tissue sample relative to stem-like cells in normal samples in each tissue plotted against the malignancy continuum. Samples are colored based on if they are from different disease stage.BPH: Benign Prostatic Hyperplasia
SkinThe image shows the transcriptomic changes along malignancy continuum.log2FC in expression of this searched gene in stem-like cells from each diseased tissue sample relative to stem-like cells in normal samples in each tissue plotted against the malignancy continuum. Samples are colored based on if they are from different disease stage.AK: Actinic keratosis
cSCC: Cutaneous squamous cell carcinoma
SCCIS:squamous cell carcinoma in situ
ThyroidThe image shows the transcriptomic changes along malignancy continuum.log2FC in expression of this searched gene in stem-like cells from each diseased tissue sample relative to stem-like cells in normal samples in each tissue plotted against the malignancy continuum. Samples are colored based on if they are from different disease stage.
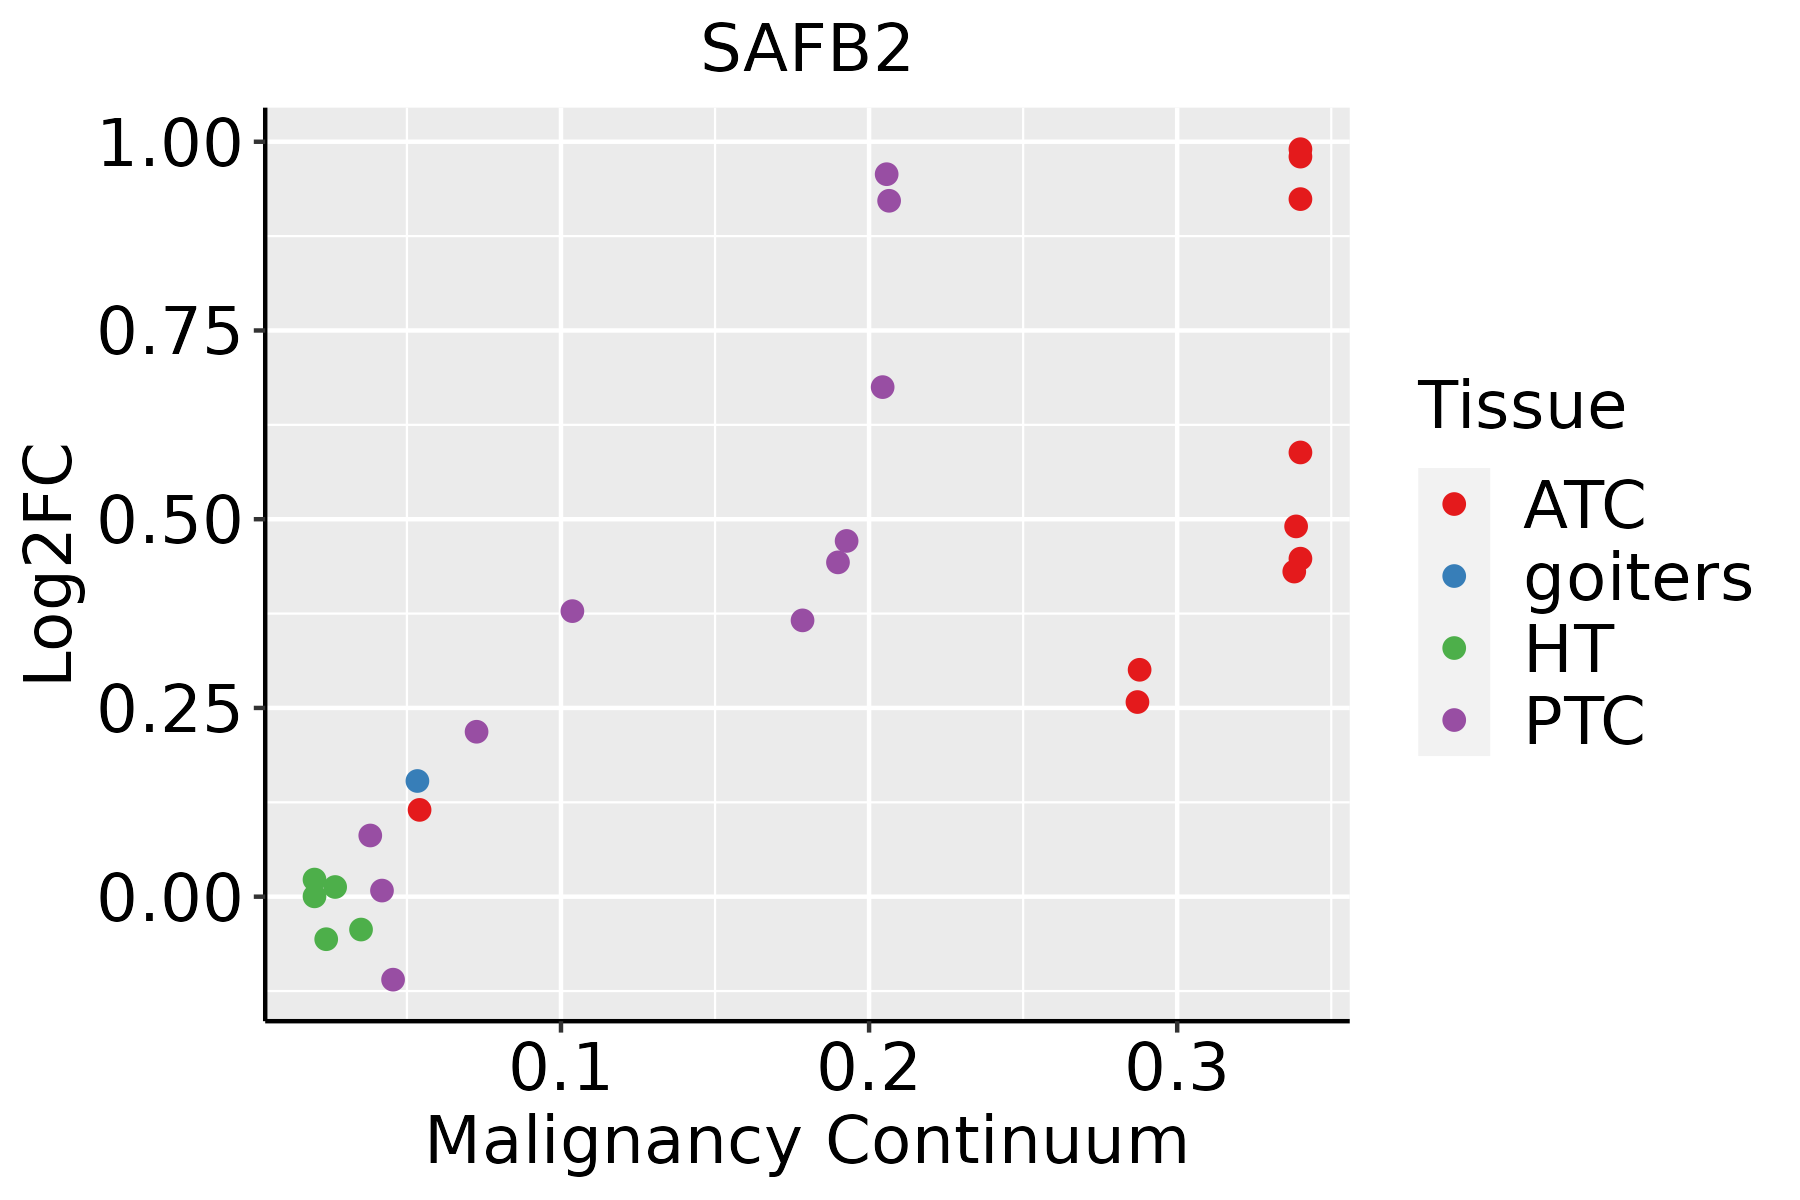
ATC: Anaplastic thyroid cancer
HT: Hashimoto's thyroiditis
PTC: Papillary thyroid cancer
∗log2FC in expression of this searched gene in stem-like cells from each diseased tissue sample relative to stem-like cells in normal samples in each tissue plotted against the malignancy continuum. Samples are colored based on if they are from different disease stage.

Top

Malignant transformation related pathway analysis

check buttonFind out the enriched GO biological processes and KEGG pathways involved in transition from healthy to precancer to cancer
check button Figure of enriched GO biological processes.
TissueDisease StageEnriched GO biological Processes
ColorectumADGO analysis - Figure of enriched GO biological processes: Top 15 enriched GO BP terms are showed in the bar plot of each disease state in each tissue. Each row represents a significant GO biological process which is colored according to the -log10(p.adjust).
ColorectumSERGO analysis - Figure of enriched GO biological processes: Top 15 enriched GO BP terms are showed in the bar plot of each disease state in each tissue. Each row represents a significant GO biological process which is colored according to the -log10(p.adjust).
ColorectumMSSGO analysis - Figure of enriched GO biological processes: Top 15 enriched GO BP terms are showed in the bar plot of each disease state in each tissue. Each row represents a significant GO biological process which is colored according to the -log10(p.adjust).
ColorectumMSI-HGO analysis - Figure of enriched GO biological processes: Top 15 enriched GO BP terms are showed in the bar plot of each disease state in each tissue. Each row represents a significant GO biological process which is colored according to the -log10(p.adjust).
ColorectumFAPGO analysis - Figure of enriched GO biological processes: Top 15 enriched GO BP terms are showed in the bar plot of each disease state in each tissue. Each row represents a significant GO biological process which is colored according to the -log10(p.adjust).
∗Top 15 enriched GO BP terms are showed in the bar plot of each disease state in each tissue. Each row represents a significant GO biological process which is colored according to the -log10(p.adjust).
Page: 1 2 3 4 5 6 7 8 9 

check button Enriched GO biological processes.
GO IDTissueDisease StageDescriptionGene RatioBg Ratiopvaluep.adjustCount
GO:190331133Oral cavityNEOLPregulation of mRNA metabolic process91/2005288/187232.65e-227.88e-1991
GO:005068433Oral cavityNEOLPregulation of mRNA processing56/2005137/187234.37e-206.48e-1756
GO:006145831Oral cavityNEOLPreproductive system development91/2005427/187238.18e-119.00e-0991
GO:004860831Oral cavityNEOLPreproductive structure development90/2005424/187231.30e-101.33e-0890
GO:003052231Oral cavityNEOLPintracellular receptor signaling pathway61/2005265/187235.22e-092.87e-0761
GO:004854532Oral cavityNEOLPresponse to steroid hormone64/2005339/187234.45e-069.55e-0564
GO:007138331Oral cavityNEOLPcellular response to steroid hormone stimulus42/2005204/187232.34e-053.73e-0442
GO:003051831Oral cavityNEOLPintracellular steroid hormone receptor signaling pathway27/2005116/187237.54e-059.71e-0427
GO:004340131Oral cavityNEOLPsteroid hormone mediated signaling pathway29/2005136/187232.17e-042.29e-0329
GO:00600082Oral cavityNEOLPSertoli cell differentiation8/200518/187232.78e-042.79e-038
GO:003052123Oral cavityNEOLPandrogen receptor signaling pathway13/200544/187234.99e-044.42e-0313
GO:000975515Oral cavityNEOLPhormone-mediated signaling pathway33/2005190/187233.53e-032.07e-0233
GO:190331116ProstateBPHregulation of mRNA metabolic process111/3107288/187232.28e-191.17e-16111
GO:005068415ProstateBPHregulation of mRNA processing64/3107137/187231.73e-163.82e-1464
GO:004854518ProstateBPHresponse to steroid hormone109/3107339/187239.35e-138.15e-11109
GO:006145810ProstateBPHreproductive system development126/3107427/187231.35e-119.95e-10126
GO:004860810ProstateBPHreproductive structure development124/3107424/187233.76e-112.43e-09124
GO:007138316ProstateBPHcellular response to steroid hormone stimulus71/3107204/187231.72e-109.79e-0971
GO:003052110ProstateBPHandrogen receptor signaling pathway23/310744/187235.88e-081.57e-0623
GO:003051810ProstateBPHintracellular steroid hormone receptor signaling pathway43/3107116/187238.48e-082.12e-0643
Page: 1 2 3 4 5 6 7 8 

check button Enriched KEGG pathways.
Pathway IDTissueDisease StageDescriptionGene RatioBg Ratiopvaluep.adjustqvalueCount
Page: 1 

Top

Cell-cell communication analysis

check buttonIdentification of potential cell-cell interactions between two cell types and their ligand-receptor pairs for different disease states
LigandReceptorLRpairPathwayTissueDisease Stage
Page: 1 

Top

Single-cell gene regulatory network inference analysis

check buttonFind out the significant the regulons (TFs) and the target genes of each regulon across cell types for different disease states
TFCell TypeTissueDisease StageTarget GeneRSSRegulon Activity
∗The dot plots of a searched regulon are shown for all cell subpopulations in each disease state of each tissue based on the regulon specific score inferred using pySCENIC and by calculating the average expression.
Page: 1 

Top

Somatic mutation of malignant transformation related genes

check buttonAnnotation of somatic variants for genes involved in malignant transformation
Hugo SymbolVariant ClassVariant ClassificationdbSNP RSHGVScHGVSpHGVSp ShortSWISSPROTBIOTYPESIFTPolyPhenTumor Sample BarcodeTissueHistologySexAgeStageTherapy TypesDrugsOutcome
SAFB2SNVMissense_Mutationnovelc.530N>Ap.Pro177Hisp.P177HQ14151protein_codingtolerated(0.43)possibly_damaging(0.473)TCGA-3C-AALI-01Breastbreast invasive carcinomaFemale<65I/IIUnspecificPoly EComplete Response
SAFB2SNVMissense_Mutationrs777512759c.2360N>Tp.Ser787Leup.S787LQ14151protein_codingdeleterious(0)benign(0.343)TCGA-A2-A0CL-01Breastbreast invasive carcinomaFemale<65III/IVChemotherapycytoxanSD
SAFB2SNVMissense_Mutationc.2426N>Ap.Gly809Glup.G809EQ14151protein_codingdeleterious(0.02)benign(0.381)TCGA-AN-A0AT-01Breastbreast invasive carcinomaFemale<65I/IIUnknownUnknownSD
SAFB2SNVMissense_Mutationnovelc.254C>Tp.Ser85Leup.S85LQ14151protein_codingdeleterious(0.04)benign(0.001)TCGA-D8-A3Z6-01Breastbreast invasive carcinomaFemale<65III/IVChemotherapycyclophosphaneSD
SAFB2SNVMissense_Mutationc.1508N>Gp.Glu503Glyp.E503GQ14151protein_codingdeleterious(0.02)possibly_damaging(0.553)TCGA-E2-A1LH-01Breastbreast invasive carcinomaFemale<65I/IIChemotherapyadriamycinSD
SAFB2SNVMissense_Mutationnovelc.221T>Cp.Ile74Thrp.I74TQ14151protein_codingdeleterious(0.01)benign(0.119)TCGA-E9-A5FK-01Breastbreast invasive carcinomaFemale<65III/IVChemotherapycyclophosphamideCR
SAFB2SNVMissense_Mutationc.1802N>Tp.Arg601Leup.R601LQ14151protein_codingdeleterious(0)probably_damaging(0.98)TCGA-GM-A2DL-01Breastbreast invasive carcinomaFemale<65I/IIHormone TherapytamoxiphenCR
SAFB2SNVMissense_Mutationnovelc.1375N>Ap.Asp459Asnp.D459NQ14151protein_codingdeleterious(0)benign(0.168)TCGA-GM-A3NW-01Breastbreast invasive carcinomaFemale<65I/IIChemotherapyfluorouracilSD
SAFB2SNVMissense_Mutationnovelc.2824N>Tp.His942Tyrp.H942YQ14151protein_codingdeleterious_low_confidence(0)benign(0.255)TCGA-OL-A5RW-01Breastbreast invasive carcinomaFemale<65I/IIChemotherapyadriamycinCR
SAFB2insertionNonsense_Mutationnovelc.1489_1490insTTCAAGTGATTCTCCTACTTCAGCCTCCCAAGTAACTGGGACTp.Glu497ValfsTer12p.E497Vfs*12Q14151protein_codingTCGA-A2-A0T2-01Breastbreast invasive carcinomaFemale>=65III/IVChemotherapyxelodaPD
Page: 1 2 3 4 5 6 7 8 9 10 11 

Top

Related drugs of malignant transformation related genes

check buttonIdentification of chemicals and drugs interact with genes involved in malignant transfromation
(DGIdb 4.0)
Entrez IDSymbolCategoryInteraction TypesDrug Claim NameDrug NamePMIDs
Page: 1