
|
|||||
|
 | |
| |
| |
| |
| |
| |
|
Gene: ROCK1 |
Gene summary for ROCK1 |
| Gene information | Species | Human | Gene symbol | ROCK1 | Gene ID | 6093 |
| Gene name | Rho associated coiled-coil containing protein kinase 1 | |
| Gene Alias | P160ROCK | |
| Cytomap | 18q11.1 | |
| Gene Type | protein-coding | GO ID | GO:0000165 | UniProtAcc | Q13464 |
Top |
Malignant transformation analysis |
| Identification of the aberrant gene expression in precancerous and cancerous lesions by comparing the gene expression of stem-like cells in diseased tissues with normal stem cells |
| Entrez ID | Symbol | Replicates | Species | Organ | Tissue | Adj P-value | Log2FC | Malignancy |
| 6093 | ROCK1 | LZE4T | Human | Esophagus | ESCC | 6.51e-20 | 4.52e-01 | 0.0811 |
| 6093 | ROCK1 | LZE7T | Human | Esophagus | ESCC | 4.14e-10 | 7.62e-01 | 0.0667 |
| 6093 | ROCK1 | LZE8T | Human | Esophagus | ESCC | 7.09e-10 | 3.83e-01 | 0.067 |
| 6093 | ROCK1 | LZE20T | Human | Esophagus | ESCC | 1.04e-09 | 1.76e-01 | 0.0662 |
| 6093 | ROCK1 | LZE24T | Human | Esophagus | ESCC | 1.83e-16 | 5.94e-01 | 0.0596 |
| 6093 | ROCK1 | LZE6T | Human | Esophagus | ESCC | 6.05e-03 | 2.66e-01 | 0.0845 |
| 6093 | ROCK1 | P1T-E | Human | Esophagus | ESCC | 5.81e-11 | 7.48e-01 | 0.0875 |
| 6093 | ROCK1 | P2T-E | Human | Esophagus | ESCC | 1.52e-46 | 8.44e-01 | 0.1177 |
| 6093 | ROCK1 | P4T-E | Human | Esophagus | ESCC | 4.28e-39 | 1.02e+00 | 0.1323 |
| 6093 | ROCK1 | P5T-E | Human | Esophagus | ESCC | 1.46e-29 | 6.05e-01 | 0.1327 |
| 6093 | ROCK1 | P8T-E | Human | Esophagus | ESCC | 8.21e-39 | 7.43e-01 | 0.0889 |
| 6093 | ROCK1 | P9T-E | Human | Esophagus | ESCC | 4.00e-22 | 7.65e-01 | 0.1131 |
| 6093 | ROCK1 | P10T-E | Human | Esophagus | ESCC | 1.69e-36 | 7.65e-01 | 0.116 |
| 6093 | ROCK1 | P11T-E | Human | Esophagus | ESCC | 2.19e-15 | 7.71e-01 | 0.1426 |
| 6093 | ROCK1 | P12T-E | Human | Esophagus | ESCC | 3.64e-78 | 1.47e+00 | 0.1122 |
| 6093 | ROCK1 | P15T-E | Human | Esophagus | ESCC | 9.85e-31 | 8.34e-01 | 0.1149 |
| 6093 | ROCK1 | P16T-E | Human | Esophagus | ESCC | 2.28e-30 | 5.26e-01 | 0.1153 |
| 6093 | ROCK1 | P17T-E | Human | Esophagus | ESCC | 1.66e-10 | 7.29e-01 | 0.1278 |
| 6093 | ROCK1 | P19T-E | Human | Esophagus | ESCC | 6.09e-15 | 1.03e+00 | 0.1662 |
| 6093 | ROCK1 | P20T-E | Human | Esophagus | ESCC | 5.72e-13 | 4.00e-01 | 0.1124 |
| Page: 1 2 3 4 5 6 7 8 |
| Tissue | Expression Dynamics | Abbreviation |
| Esophagus | 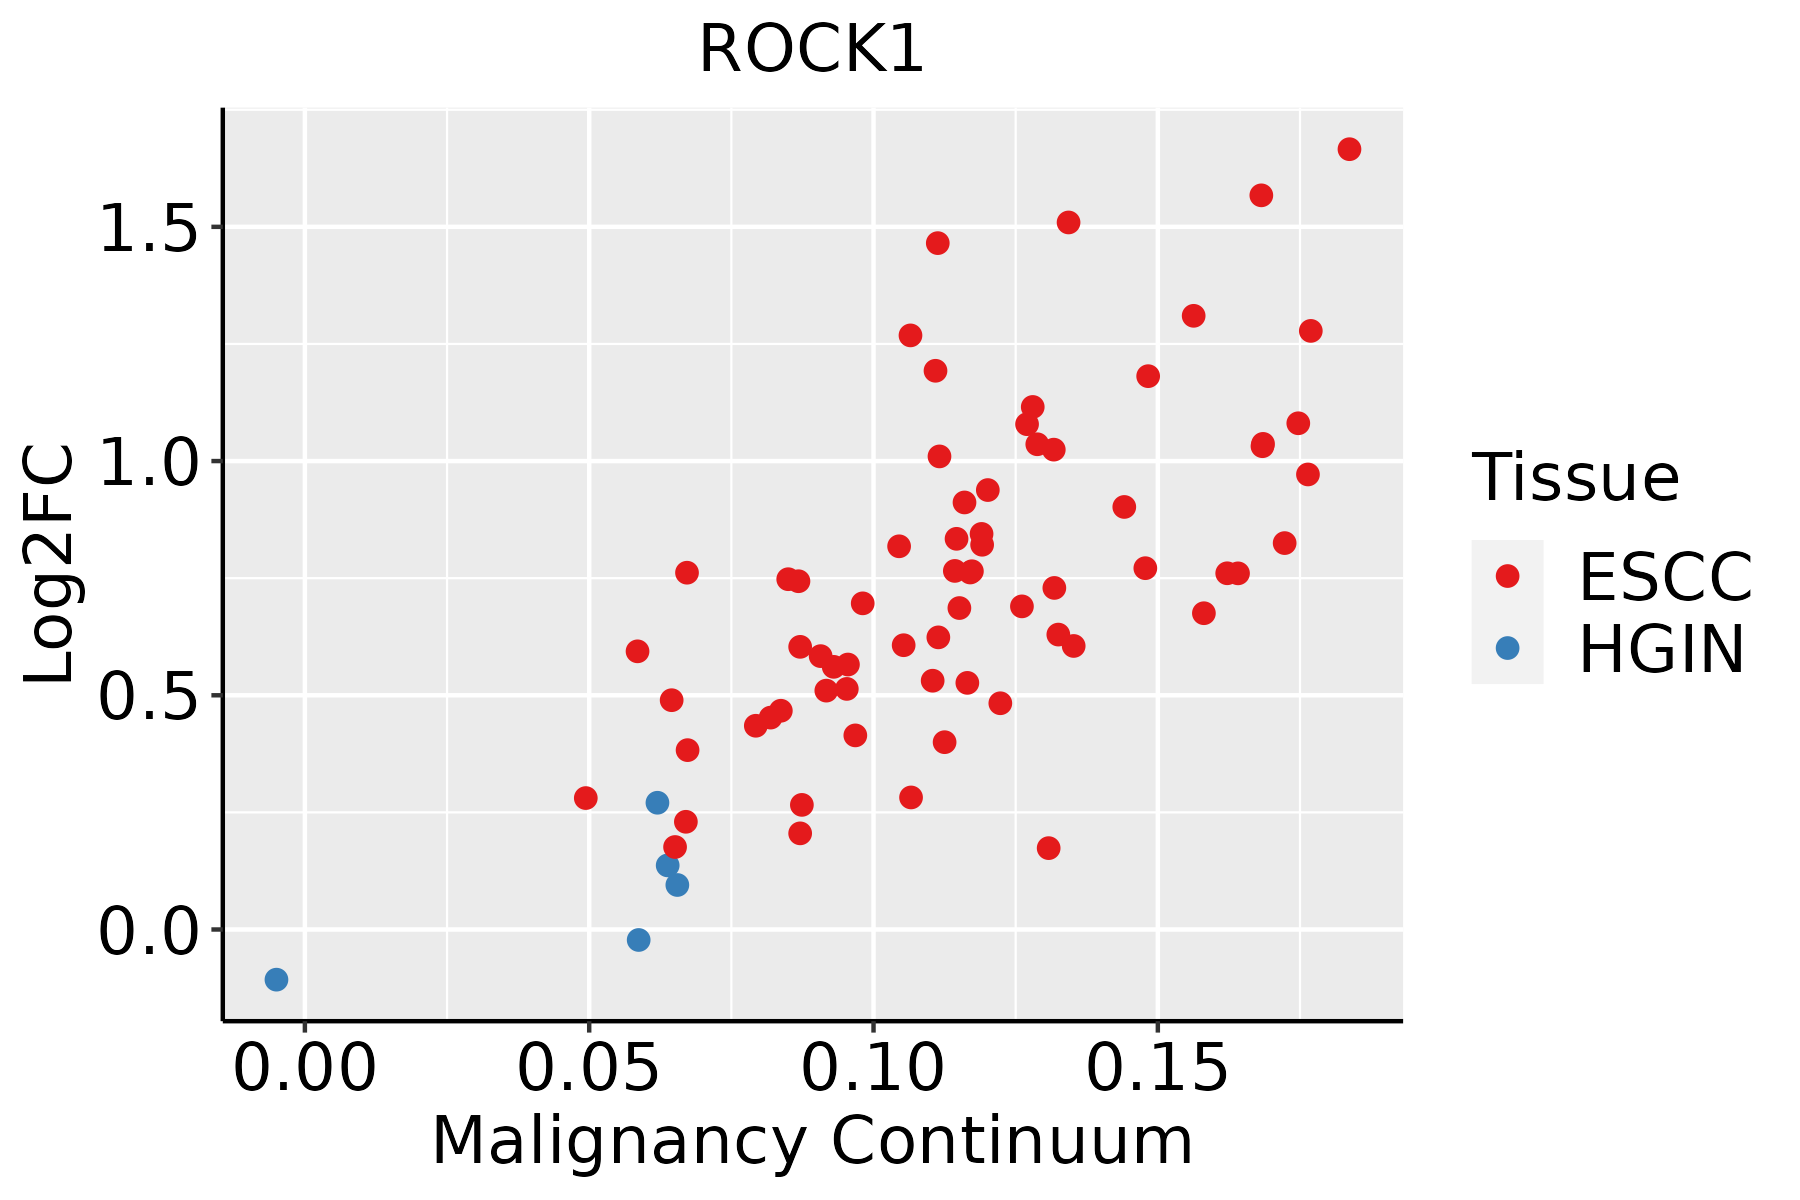 | ESCC: Esophageal squamous cell carcinoma |
| HGIN: High-grade intraepithelial neoplasias | ||
| LGIN: Low-grade intraepithelial neoplasias | ||
| Liver | 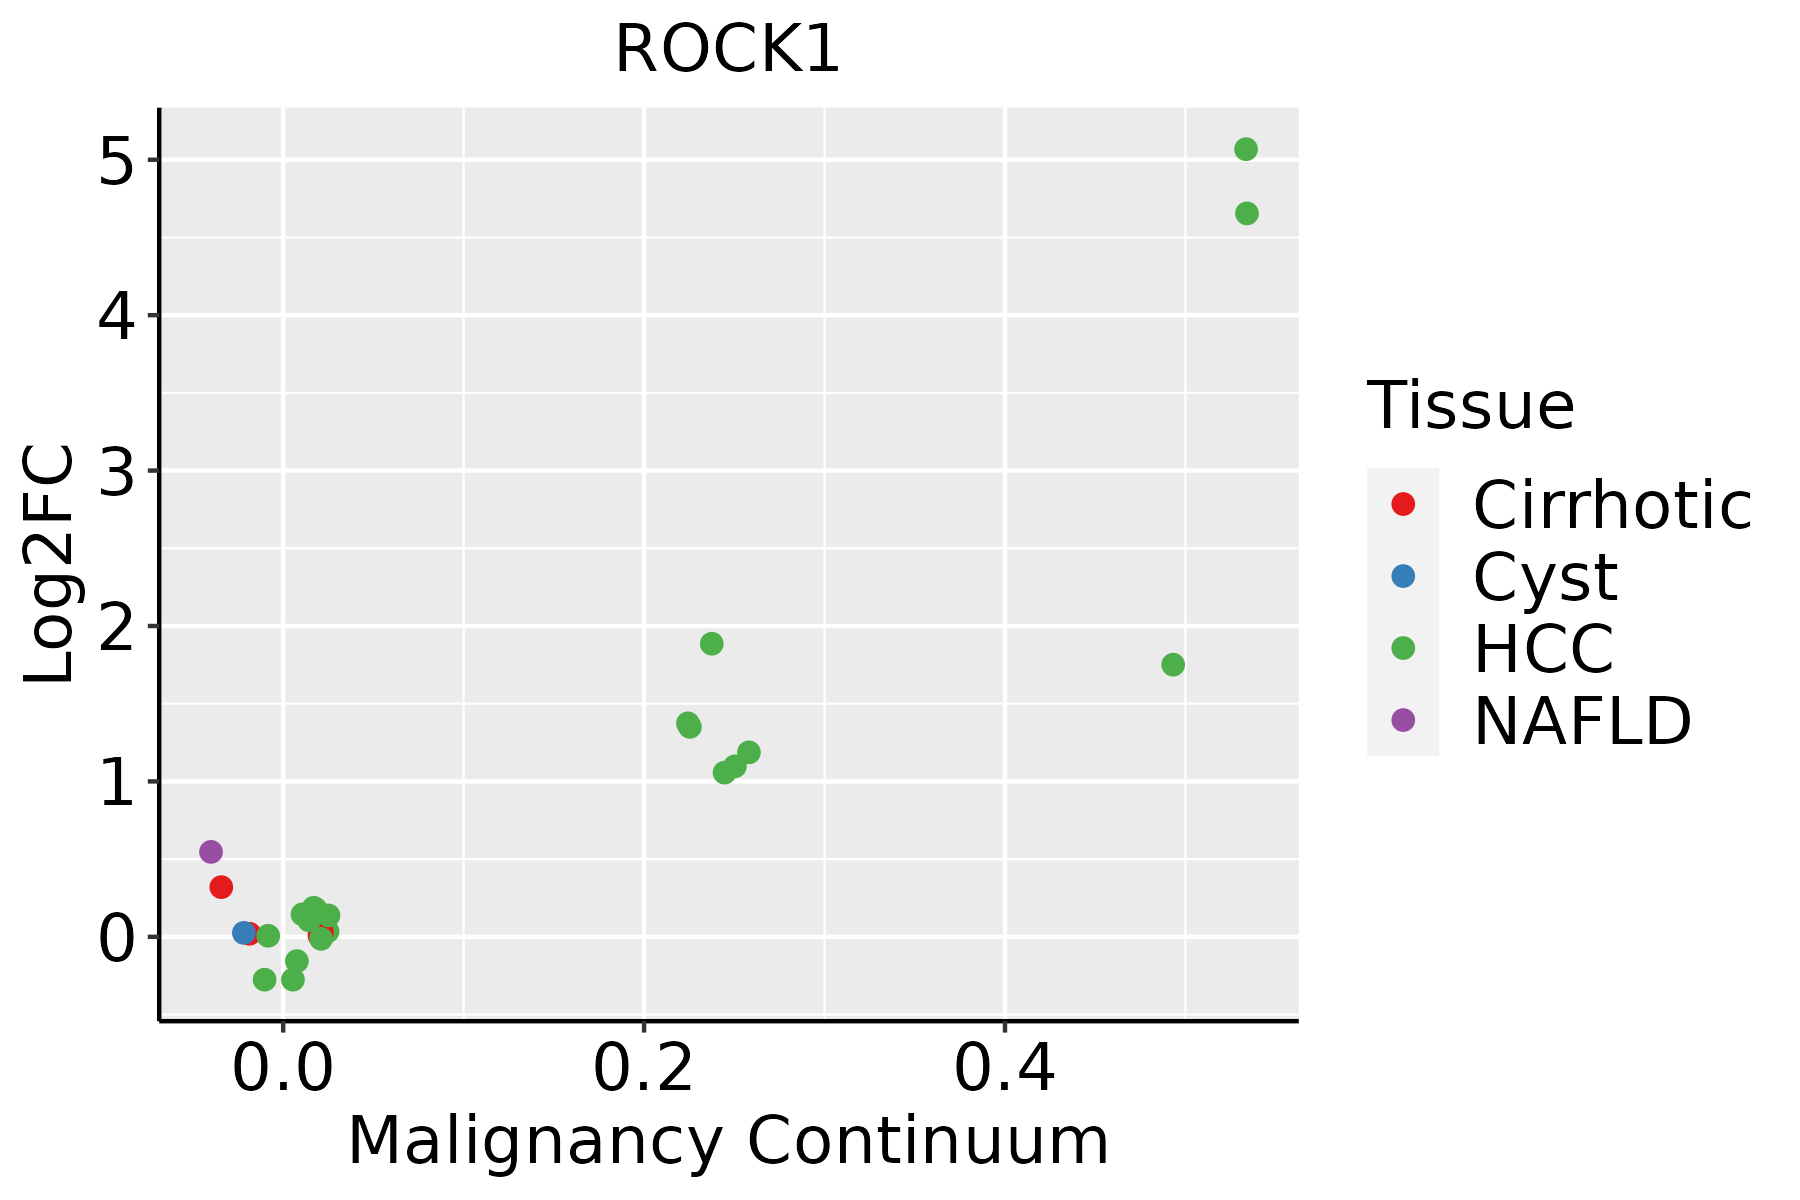 | HCC: Hepatocellular carcinoma |
| NAFLD: Non-alcoholic fatty liver disease | ||
| Lung |  | AAH: Atypical adenomatous hyperplasia |
| AIS: Adenocarcinoma in situ | ||
| IAC: Invasive lung adenocarcinoma | ||
| MIA: Minimally invasive adenocarcinoma | ||
| Oral Cavity | 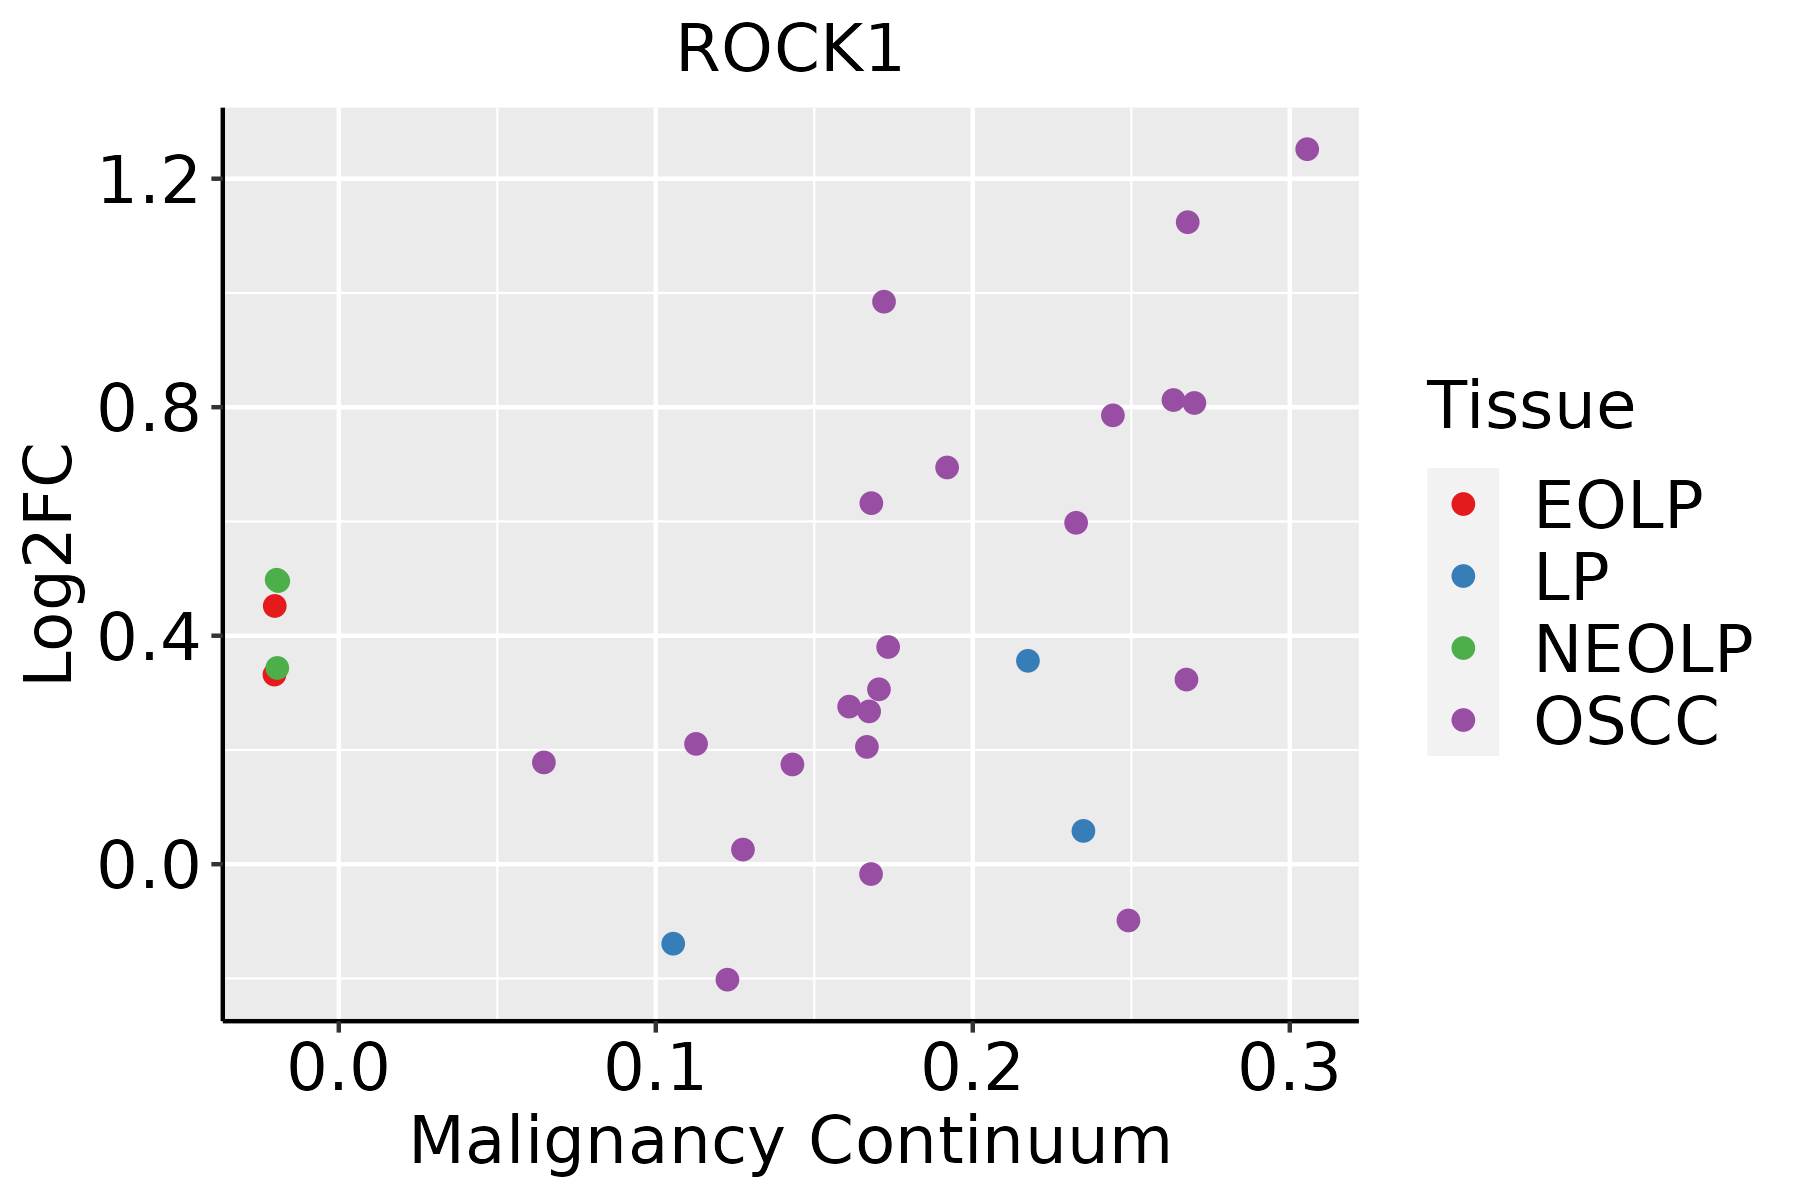 | EOLP: Erosive Oral lichen planus |
| LP: leukoplakia | ||
| NEOLP: Non-erosive oral lichen planus | ||
| OSCC: Oral squamous cell carcinoma | ||
| Prostate | 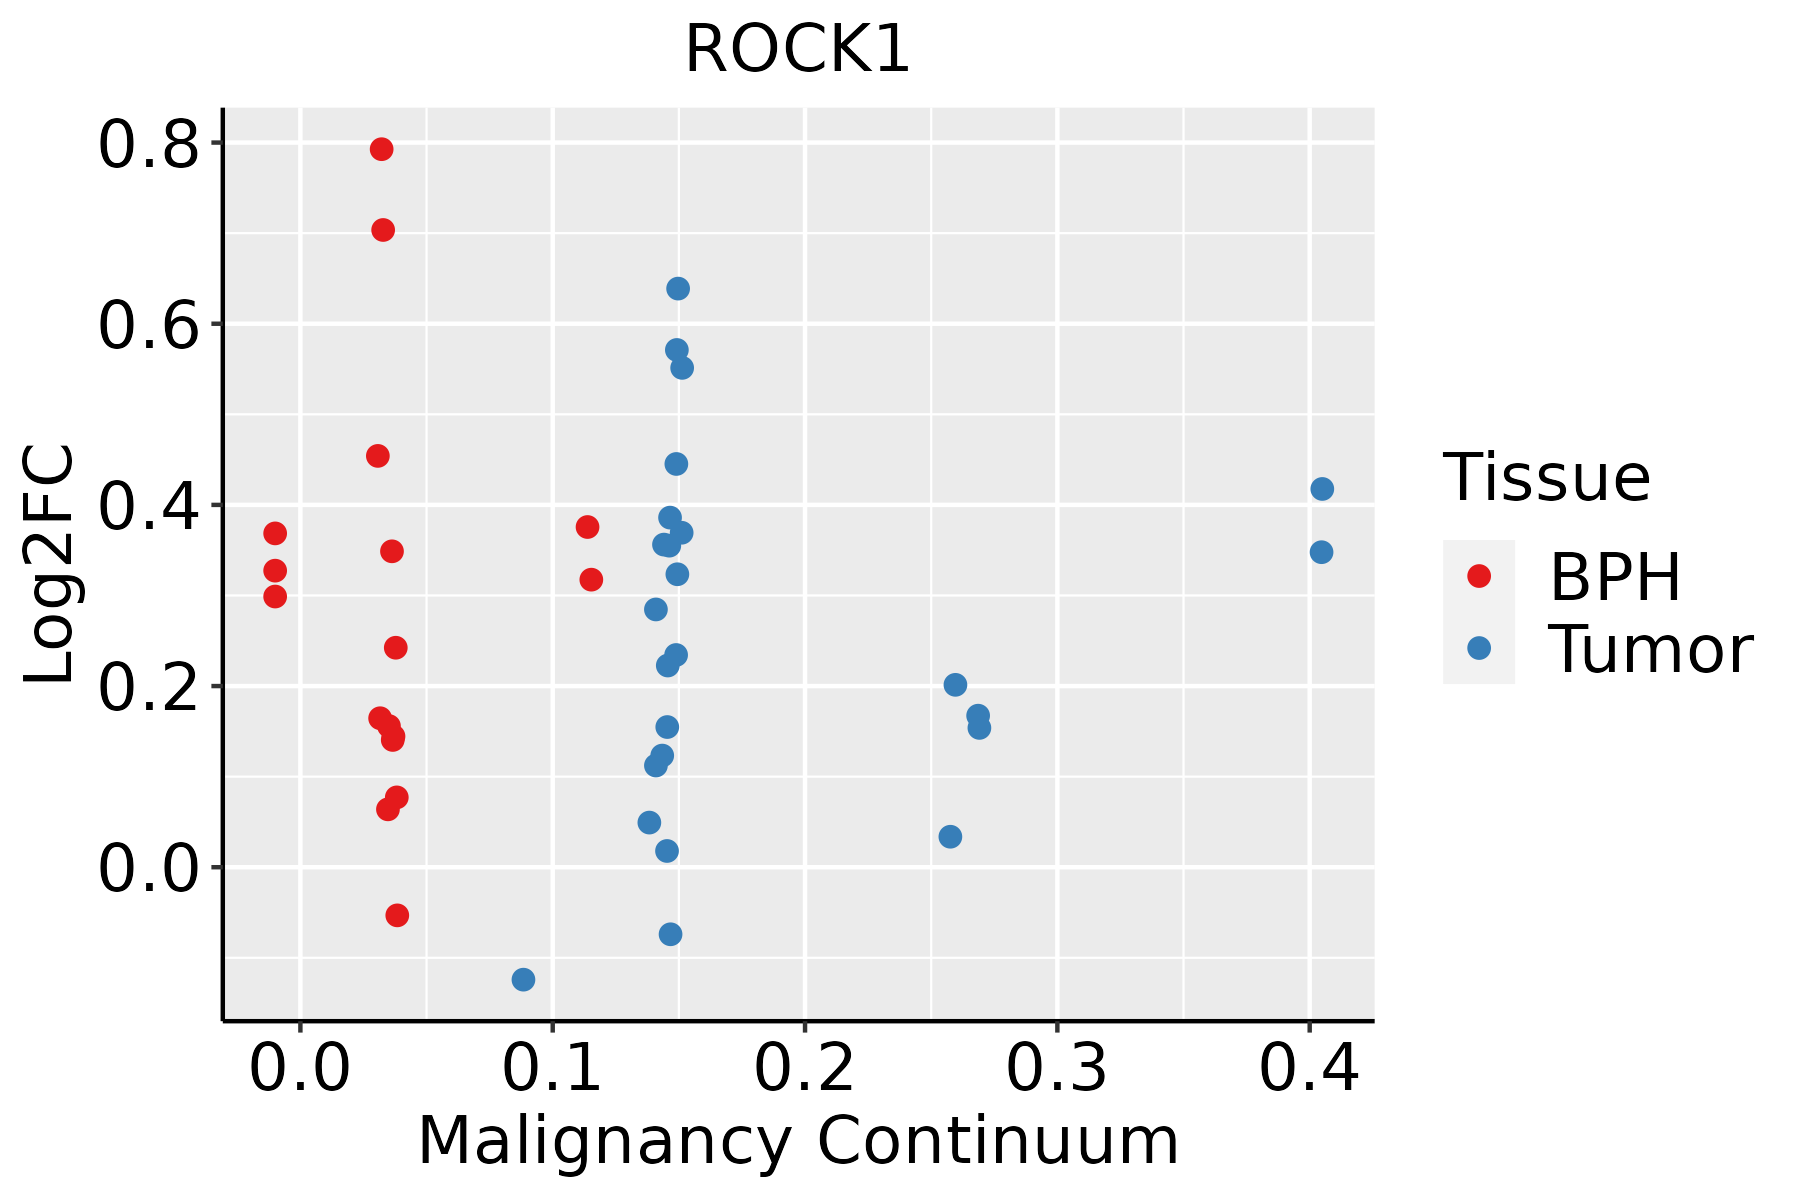 | BPH: Benign Prostatic Hyperplasia |
| Skin |  | AK: Actinic keratosis |
| cSCC: Cutaneous squamous cell carcinoma | ||
| SCCIS:squamous cell carcinoma in situ | ||
| Thyroid | 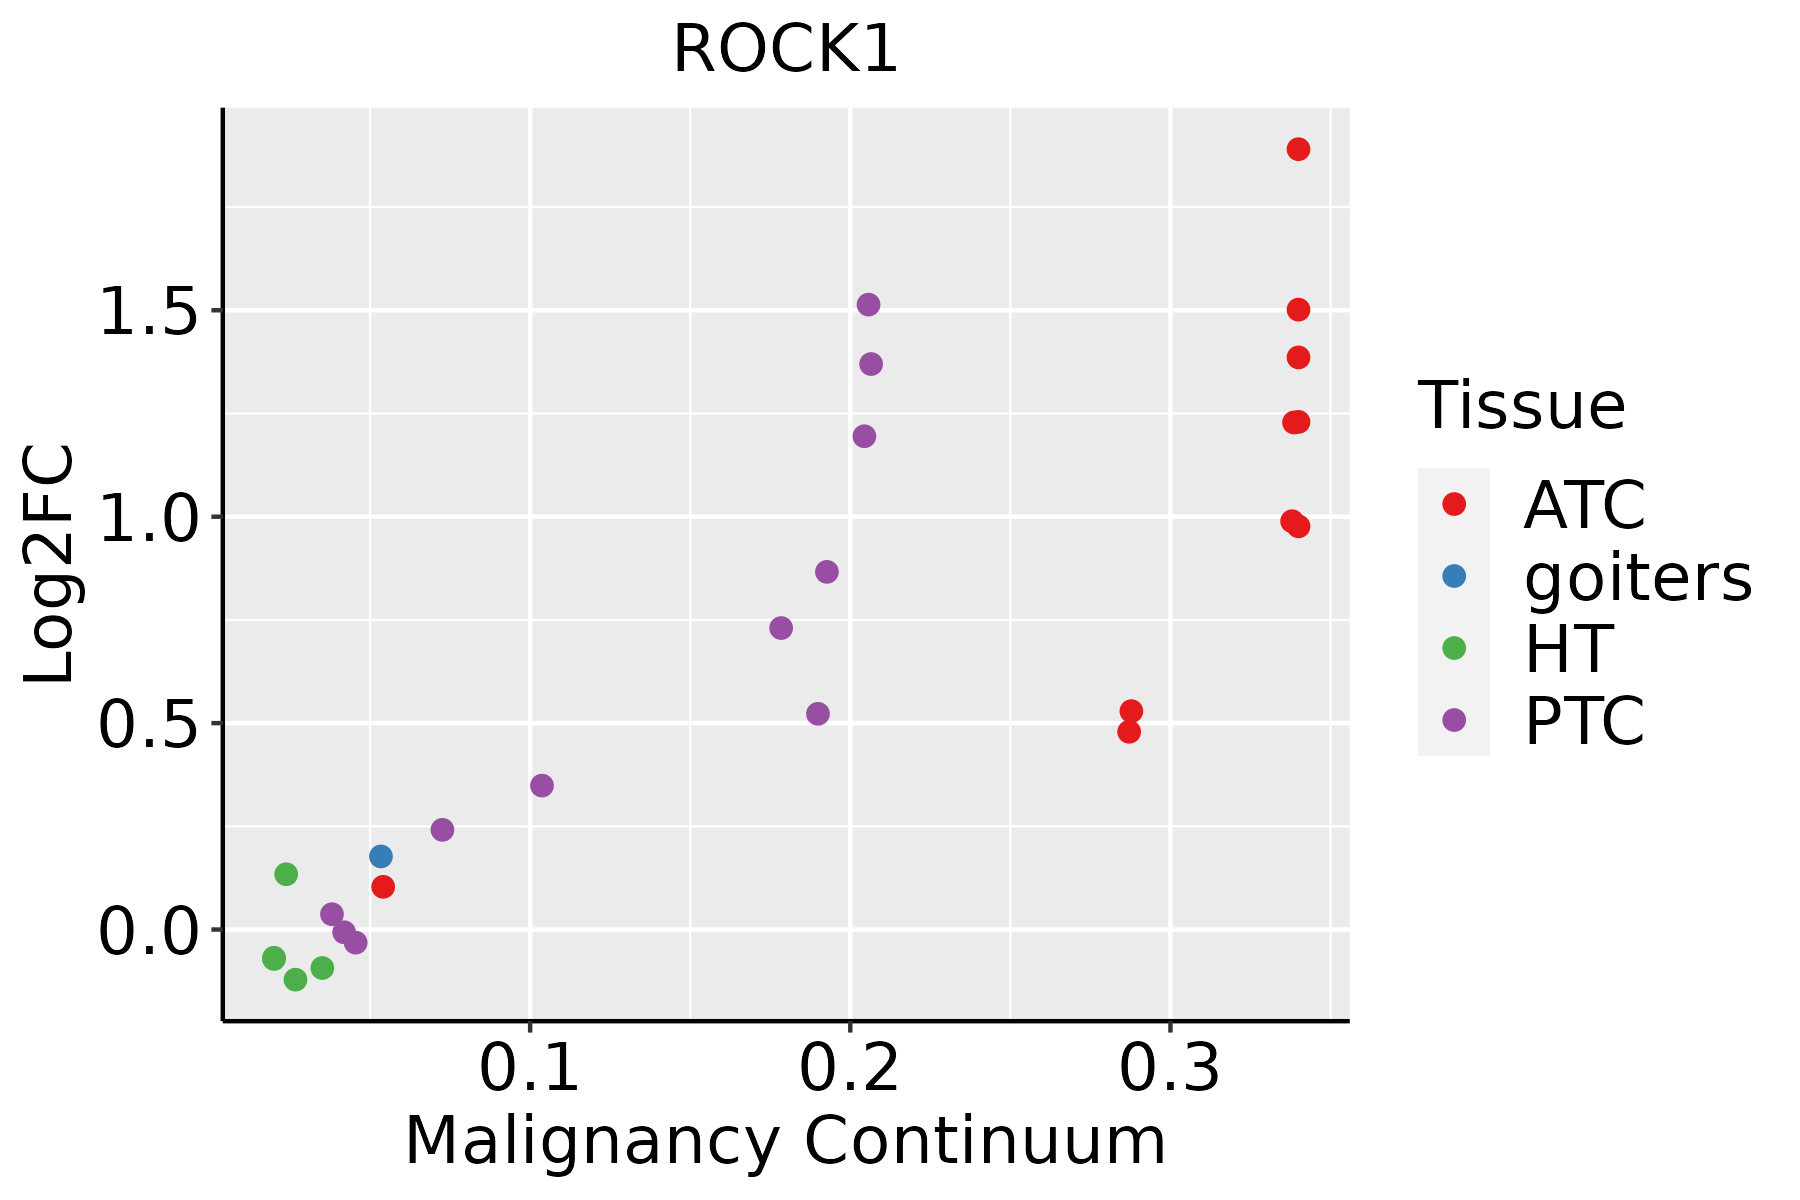 | ATC: Anaplastic thyroid cancer |
| HT: Hashimoto's thyroiditis | ||
| PTC: Papillary thyroid cancer |
| ∗log2FC in expression of this searched gene in stem-like cells from each diseased tissue sample relative to stem-like cells in normal samples in each tissue plotted against the malignancy continuum. Samples are colored based on if they are from different disease stage. |
Top |
Malignant transformation related pathway analysis |
| Find out the enriched GO biological processes and KEGG pathways involved in transition from healthy to precancer to cancer |
| Tissue | Disease Stage | Enriched GO biological Processes |
| Colorectum | AD |  |
| Colorectum | SER |  |
| Colorectum | MSS |  |
| Colorectum | MSI-H |  |
| Colorectum | FAP |  |
| ∗Top 15 enriched GO BP terms are showed in the bar plot of each disease state in each tissue. Each row represents a significant GO biological process which is colored according to the -log10(p.adjust). |
| Page: 1 2 3 4 5 6 7 8 9 |
| GO ID | Tissue | Disease Stage | Description | Gene Ratio | Bg Ratio | pvalue | p.adjust | Count |
| GO:005077916 | Esophagus | ESCC | RNA destabilization | 63/8552 | 88/18723 | 7.23e-07 | 9.40e-06 | 63 |
| GO:000206420 | Esophagus | ESCC | epithelial cell development | 136/8552 | 220/18723 | 9.50e-07 | 1.21e-05 | 136 |
| GO:011005327 | Esophagus | ESCC | regulation of actin filament organization | 166/8552 | 278/18723 | 1.54e-06 | 1.85e-05 | 166 |
| GO:190165319 | Esophagus | ESCC | cellular response to peptide | 208/8552 | 359/18723 | 1.68e-06 | 2.01e-05 | 208 |
| GO:000195217 | Esophagus | ESCC | regulation of cell-matrix adhesion | 85/8552 | 128/18723 | 1.70e-06 | 2.02e-05 | 85 |
| GO:00182099 | Esophagus | ESCC | peptidyl-serine modification | 196/8552 | 338/18723 | 3.07e-06 | 3.47e-05 | 196 |
| GO:001810515 | Esophagus | ESCC | peptidyl-serine phosphorylation | 184/8552 | 315/18723 | 3.22e-06 | 3.61e-05 | 184 |
| GO:000716018 | Esophagus | ESCC | cell-matrix adhesion | 141/8552 | 233/18723 | 3.33e-06 | 3.71e-05 | 141 |
| GO:003209116 | Esophagus | ESCC | negative regulation of protein binding | 65/8552 | 94/18723 | 3.46e-06 | 3.82e-05 | 65 |
| GO:005101727 | Esophagus | ESCC | actin filament bundle assembly | 100/8552 | 157/18723 | 3.87e-06 | 4.17e-05 | 100 |
| GO:0043434111 | Esophagus | ESCC | response to peptide hormone | 234/8552 | 414/18723 | 4.93e-06 | 5.21e-05 | 234 |
| GO:015011619 | Esophagus | ESCC | regulation of cell-substrate junction organization | 51/8552 | 71/18723 | 6.99e-06 | 7.04e-05 | 51 |
| GO:001050816 | Esophagus | ESCC | positive regulation of autophagy | 81/8552 | 124/18723 | 7.74e-06 | 7.65e-05 | 81 |
| GO:006157227 | Esophagus | ESCC | actin filament bundle organization | 101/8552 | 161/18723 | 9.22e-06 | 8.82e-05 | 101 |
| GO:000991310 | Esophagus | ESCC | epidermal cell differentiation | 122/8552 | 202/18723 | 1.69e-05 | 1.51e-04 | 122 |
| GO:005189318 | Esophagus | ESCC | regulation of focal adhesion assembly | 47/8552 | 66/18723 | 2.31e-05 | 1.98e-04 | 47 |
| GO:009010918 | Esophagus | ESCC | regulation of cell-substrate junction assembly | 47/8552 | 66/18723 | 2.31e-05 | 1.98e-04 | 47 |
| GO:003086517 | Esophagus | ESCC | cortical cytoskeleton organization | 44/8552 | 61/18723 | 2.50e-05 | 2.13e-04 | 44 |
| GO:00456826 | Esophagus | ESCC | regulation of epidermis development | 46/8552 | 65/18723 | 3.65e-05 | 2.97e-04 | 46 |
| GO:007137516 | Esophagus | ESCC | cellular response to peptide hormone stimulus | 166/8552 | 290/18723 | 4.48e-05 | 3.55e-04 | 166 |
| Page: 1 2 3 4 5 6 7 8 9 10 11 12 13 14 15 16 17 18 19 20 21 22 23 24 25 26 27 28 29 30 31 32 33 34 35 36 37 38 39 40 41 42 43 44 45 46 47 48 49 50 51 52 53 54 55 56 57 58 59 60 61 62 63 64 65 66 67 68 69 70 71 72 73 74 75 76 77 78 79 80 81 82 83 84 85 86 87 88 89 90 91 92 93 94 95 96 97 98 99 100 |
| Pathway ID | Tissue | Disease Stage | Description | Gene Ratio | Bg Ratio | pvalue | p.adjust | qvalue | Count |
| hsa05131211 | Esophagus | ESCC | Shigellosis | 176/4205 | 247/8465 | 2.27e-12 | 4.01e-11 | 2.05e-11 | 176 |
| hsa05130211 | Esophagus | ESCC | Pathogenic Escherichia coli infection | 142/4205 | 197/8465 | 8.21e-11 | 1.06e-09 | 5.42e-10 | 142 |
| hsa0513526 | Esophagus | ESCC | Yersinia infection | 100/4205 | 137/8465 | 1.80e-08 | 1.59e-07 | 8.12e-08 | 100 |
| hsa0520529 | Esophagus | ESCC | Proteoglycans in cancer | 138/4205 | 205/8465 | 1.79e-07 | 1.40e-06 | 7.15e-07 | 138 |
| hsa05163210 | Esophagus | ESCC | Human cytomegalovirus infection | 148/4205 | 225/8465 | 5.73e-07 | 4.00e-06 | 2.05e-06 | 148 |
| hsa0452030 | Esophagus | ESCC | Adherens junction | 69/4205 | 93/8465 | 1.08e-06 | 6.83e-06 | 3.50e-06 | 69 |
| hsa0407116 | Esophagus | ESCC | Sphingolipid signaling pathway | 85/4205 | 121/8465 | 3.04e-06 | 1.73e-05 | 8.84e-06 | 85 |
| hsa0451020 | Esophagus | ESCC | Focal adhesion | 127/4205 | 203/8465 | 1.25e-04 | 4.99e-04 | 2.56e-04 | 127 |
| hsa04530211 | Esophagus | ESCC | Tight junction | 105/4205 | 169/8465 | 6.73e-04 | 2.23e-03 | 1.14e-03 | 105 |
| hsa043507 | Esophagus | ESCC | TGF-beta signaling pathway | 69/4205 | 108/8465 | 1.92e-03 | 5.54e-03 | 2.84e-03 | 69 |
| hsa0436016 | Esophagus | ESCC | Axon guidance | 108/4205 | 182/8465 | 5.13e-03 | 1.30e-02 | 6.67e-03 | 108 |
| hsa0481028 | Esophagus | ESCC | Regulation of actin cytoskeleton | 133/4205 | 229/8465 | 5.94e-03 | 1.48e-02 | 7.56e-03 | 133 |
| hsa05131310 | Esophagus | ESCC | Shigellosis | 176/4205 | 247/8465 | 2.27e-12 | 4.01e-11 | 2.05e-11 | 176 |
| hsa05130310 | Esophagus | ESCC | Pathogenic Escherichia coli infection | 142/4205 | 197/8465 | 8.21e-11 | 1.06e-09 | 5.42e-10 | 142 |
| hsa05135111 | Esophagus | ESCC | Yersinia infection | 100/4205 | 137/8465 | 1.80e-08 | 1.59e-07 | 8.12e-08 | 100 |
| hsa0520537 | Esophagus | ESCC | Proteoglycans in cancer | 138/4205 | 205/8465 | 1.79e-07 | 1.40e-06 | 7.15e-07 | 138 |
| hsa0516338 | Esophagus | ESCC | Human cytomegalovirus infection | 148/4205 | 225/8465 | 5.73e-07 | 4.00e-06 | 2.05e-06 | 148 |
| hsa04520114 | Esophagus | ESCC | Adherens junction | 69/4205 | 93/8465 | 1.08e-06 | 6.83e-06 | 3.50e-06 | 69 |
| hsa0407117 | Esophagus | ESCC | Sphingolipid signaling pathway | 85/4205 | 121/8465 | 3.04e-06 | 1.73e-05 | 8.84e-06 | 85 |
| hsa04510111 | Esophagus | ESCC | Focal adhesion | 127/4205 | 203/8465 | 1.25e-04 | 4.99e-04 | 2.56e-04 | 127 |
| Page: 1 2 3 4 5 6 7 8 9 10 11 12 13 14 15 |
Top |
Cell-cell communication analysis |
| Identification of potential cell-cell interactions between two cell types and their ligand-receptor pairs for different disease states |
| Ligand | Receptor | LRpair | Pathway | Tissue | Disease Stage |
| Page: 1 |
Top |
Single-cell gene regulatory network inference analysis |
| Find out the significant the regulons (TFs) and the target genes of each regulon across cell types for different disease states |
| TF | Cell Type | Tissue | Disease Stage | Target Gene | RSS | Regulon Activity |
| ∗The dot plots of a searched regulon are shown for all cell subpopulations in each disease state of each tissue based on the regulon specific score inferred using pySCENIC and by calculating the average expression. |
| Page: 1 |
Top |
Somatic mutation of malignant transformation related genes |
| Annotation of somatic variants for genes involved in malignant transformation |
| Hugo Symbol | Variant Class | Variant Classification | dbSNP RS | HGVSc | HGVSp | HGVSp Short | SWISSPROT | BIOTYPE | SIFT | PolyPhen | Tumor Sample Barcode | Tissue | Histology | Sex | Age | Stage | Therapy Types | Drugs | Outcome |
| ROCK1 | SNV | Missense_Mutation | c.1741C>G | p.Leu581Val | p.L581V | Q13464 | protein_coding | tolerated(0.29) | benign(0.01) | TCGA-A2-A25E-01 | Breast | breast invasive carcinoma | Female | <65 | III/IV | Chemotherapy | cytoxan | PD | |
| ROCK1 | SNV | Missense_Mutation | c.3607N>A | p.Glu1203Lys | p.E1203K | Q13464 | protein_coding | deleterious(0) | probably_damaging(0.986) | TCGA-A7-A26G-01 | Breast | breast invasive carcinoma | Female | <65 | I/II | Chemotherapy | taxotere | SD | |
| ROCK1 | SNV | Missense_Mutation | c.3989N>A | p.Arg1330Gln | p.R1330Q | Q13464 | protein_coding | deleterious(0.02) | benign(0.227) | TCGA-AN-A046-01 | Breast | breast invasive carcinoma | Female | >=65 | I/II | Unknown | Unknown | SD | |
| ROCK1 | SNV | Missense_Mutation | c.808N>A | p.Glu270Lys | p.E270K | Q13464 | protein_coding | deleterious(0.01) | possibly_damaging(0.805) | TCGA-AN-A046-01 | Breast | breast invasive carcinoma | Female | >=65 | I/II | Unknown | Unknown | SD | |
| ROCK1 | SNV | Missense_Mutation | c.509N>C | p.Val170Ala | p.V170A | Q13464 | protein_coding | deleterious(0) | probably_damaging(0.972) | TCGA-AN-A0AK-01 | Breast | breast invasive carcinoma | Female | >=65 | I/II | Unknown | Unknown | SD | |
| ROCK1 | SNV | Missense_Mutation | c.3490N>T | p.Pro1164Ser | p.P1164S | Q13464 | protein_coding | deleterious(0) | probably_damaging(0.998) | TCGA-EW-A1IZ-01 | Breast | breast invasive carcinoma | Female | <65 | III/IV | Chemotherapy | taxotere | SD | |
| ROCK1 | SNV | Missense_Mutation | rs761438534 | c.3146N>G | p.Asn1049Ser | p.N1049S | Q13464 | protein_coding | tolerated(0.17) | benign(0.024) | TCGA-LD-A66U-01 | Breast | breast invasive carcinoma | Female | <65 | I/II | Chemotherapy | adriamycin | SD |
| ROCK1 | insertion | Frame_Shift_Ins | novel | c.290_291insT | p.Thr98HisfsTer14 | p.T98Hfs*14 | Q13464 | protein_coding | TCGA-AO-A0J4-01 | Breast | breast invasive carcinoma | Female | <65 | I/II | Chemotherapy | doxorubicin | SD | ||
| ROCK1 | insertion | Frame_Shift_Ins | novel | c.289_290insACAGAAGATATAGAAAACTTAAT | p.Ser97TyrfsTer16 | p.S97Yfs*16 | Q13464 | protein_coding | TCGA-AO-A0J4-01 | Breast | breast invasive carcinoma | Female | <65 | I/II | Chemotherapy | doxorubicin | SD | ||
| ROCK1 | insertion | Frame_Shift_Ins | novel | c.3011_3012insAC | p.Asn1004LysfsTer7 | p.N1004Kfs*7 | Q13464 | protein_coding | TCGA-AR-A0TU-01 | Breast | breast invasive carcinoma | Female | <65 | I/II | Unspecific | Doxorubicin | SD |
| Page: 1 2 3 4 5 6 7 8 9 10 11 12 13 14 15 16 17 18 19 |
Top |
Related drugs of malignant transformation related genes |
| Identification of chemicals and drugs interact with genes involved in malignant transfromation |
| (DGIdb 4.0) |
| Entrez ID | Symbol | Category | Interaction Types | Drug Claim Name | Drug Name | PMIDs |
| 6093 | ROCK1 | KINASE, DRUGGABLE GENOME, ENZYME, SERINE THREONINE KINASE | inhibitor | 336446944 | ||
| 6093 | ROCK1 | KINASE, DRUGGABLE GENOME, ENZYME, SERINE THREONINE KINASE | inhibitor | CHEMBL3545065 | VEROSUDIL | |
| 6093 | ROCK1 | KINASE, DRUGGABLE GENOME, ENZYME, SERINE THREONINE KINASE | Rhopressa | NETARSUDIL DIMESYLATE | ||
| 6093 | ROCK1 | KINASE, DRUGGABLE GENOME, ENZYME, SERINE THREONINE KINASE | BAY-613606 | CHEMBL541400 | ||
| 6093 | ROCK1 | KINASE, DRUGGABLE GENOME, ENZYME, SERINE THREONINE KINASE | inhibitor | 310264692 | VEROSUDIL | |
| 6093 | ROCK1 | KINASE, DRUGGABLE GENOME, ENZYME, SERINE THREONINE KINASE | PMID28048944-Compound-7 | |||
| 6093 | ROCK1 | KINASE, DRUGGABLE GENOME, ENZYME, SERINE THREONINE KINASE | DNDI1417467 | CHEMBL1997335 | ||
| 6093 | ROCK1 | KINASE, DRUGGABLE GENOME, ENZYME, SERINE THREONINE KINASE | FASUDIL | FASUDIL | ||
| 6093 | ROCK1 | KINASE, DRUGGABLE GENOME, ENZYME, SERINE THREONINE KINASE | PMID28048944-Compound-6 | |||
| 6093 | ROCK1 | KINASE, DRUGGABLE GENOME, ENZYME, SERINE THREONINE KINASE | SP-600125 | SP-600125 |
| Page: 1 2 3 4 5 6 7 8 |

Copyright 2023-Present -The University of Texas Health Science Center at Houston |