
|
|||||
|
 | |
| |
| |
| |
| |
| |
|
Gene: RNF185 |
Gene summary for RNF185 |
| Gene information | Species | Human | Gene symbol | RNF185 | Gene ID | 91445 |
| Gene name | ring finger protein 185 | |
| Gene Alias | RNF185 | |
| Cytomap | 22q12.2 | |
| Gene Type | protein-coding | GO ID | GO:0006464 | UniProtAcc | A0A024R1H4 |
Top |
Malignant transformation analysis |
| Identification of the aberrant gene expression in precancerous and cancerous lesions by comparing the gene expression of stem-like cells in diseased tissues with normal stem cells |
| Entrez ID | Symbol | Replicates | Species | Organ | Tissue | Adj P-value | Log2FC | Malignancy |
| 91445 | RNF185 | LZE4T | Human | Esophagus | ESCC | 3.38e-09 | 2.50e-01 | 0.0811 |
| 91445 | RNF185 | LZE24T | Human | Esophagus | ESCC | 1.67e-08 | 2.23e-01 | 0.0596 |
| 91445 | RNF185 | LZE21T | Human | Esophagus | ESCC | 8.53e-03 | 1.77e-01 | 0.0655 |
| 91445 | RNF185 | P1T-E | Human | Esophagus | ESCC | 1.23e-04 | 2.48e-01 | 0.0875 |
| 91445 | RNF185 | P2T-E | Human | Esophagus | ESCC | 1.90e-10 | 1.75e-01 | 0.1177 |
| 91445 | RNF185 | P4T-E | Human | Esophagus | ESCC | 1.78e-11 | 1.47e-01 | 0.1323 |
| 91445 | RNF185 | P5T-E | Human | Esophagus | ESCC | 5.00e-04 | 4.35e-02 | 0.1327 |
| 91445 | RNF185 | P8T-E | Human | Esophagus | ESCC | 1.97e-10 | 1.90e-01 | 0.0889 |
| 91445 | RNF185 | P9T-E | Human | Esophagus | ESCC | 5.51e-07 | 1.33e-01 | 0.1131 |
| 91445 | RNF185 | P10T-E | Human | Esophagus | ESCC | 4.16e-22 | 3.39e-01 | 0.116 |
| 91445 | RNF185 | P11T-E | Human | Esophagus | ESCC | 5.80e-10 | 2.78e-01 | 0.1426 |
| 91445 | RNF185 | P12T-E | Human | Esophagus | ESCC | 4.16e-22 | 3.88e-01 | 0.1122 |
| 91445 | RNF185 | P15T-E | Human | Esophagus | ESCC | 1.42e-13 | 3.06e-01 | 0.1149 |
| 91445 | RNF185 | P16T-E | Human | Esophagus | ESCC | 8.08e-19 | 3.61e-01 | 0.1153 |
| 91445 | RNF185 | P17T-E | Human | Esophagus | ESCC | 4.89e-05 | 2.39e-01 | 0.1278 |
| 91445 | RNF185 | P20T-E | Human | Esophagus | ESCC | 5.79e-09 | 1.97e-01 | 0.1124 |
| 91445 | RNF185 | P21T-E | Human | Esophagus | ESCC | 2.05e-07 | 1.80e-01 | 0.1617 |
| 91445 | RNF185 | P22T-E | Human | Esophagus | ESCC | 2.25e-13 | 2.08e-01 | 0.1236 |
| 91445 | RNF185 | P23T-E | Human | Esophagus | ESCC | 5.64e-11 | 3.00e-01 | 0.108 |
| 91445 | RNF185 | P24T-E | Human | Esophagus | ESCC | 6.43e-07 | 8.29e-02 | 0.1287 |
| Page: 1 2 3 4 |
| Tissue | Expression Dynamics | Abbreviation |
| Esophagus |  | ESCC: Esophageal squamous cell carcinoma |
| HGIN: High-grade intraepithelial neoplasias | ||
| LGIN: Low-grade intraepithelial neoplasias | ||
| Liver | 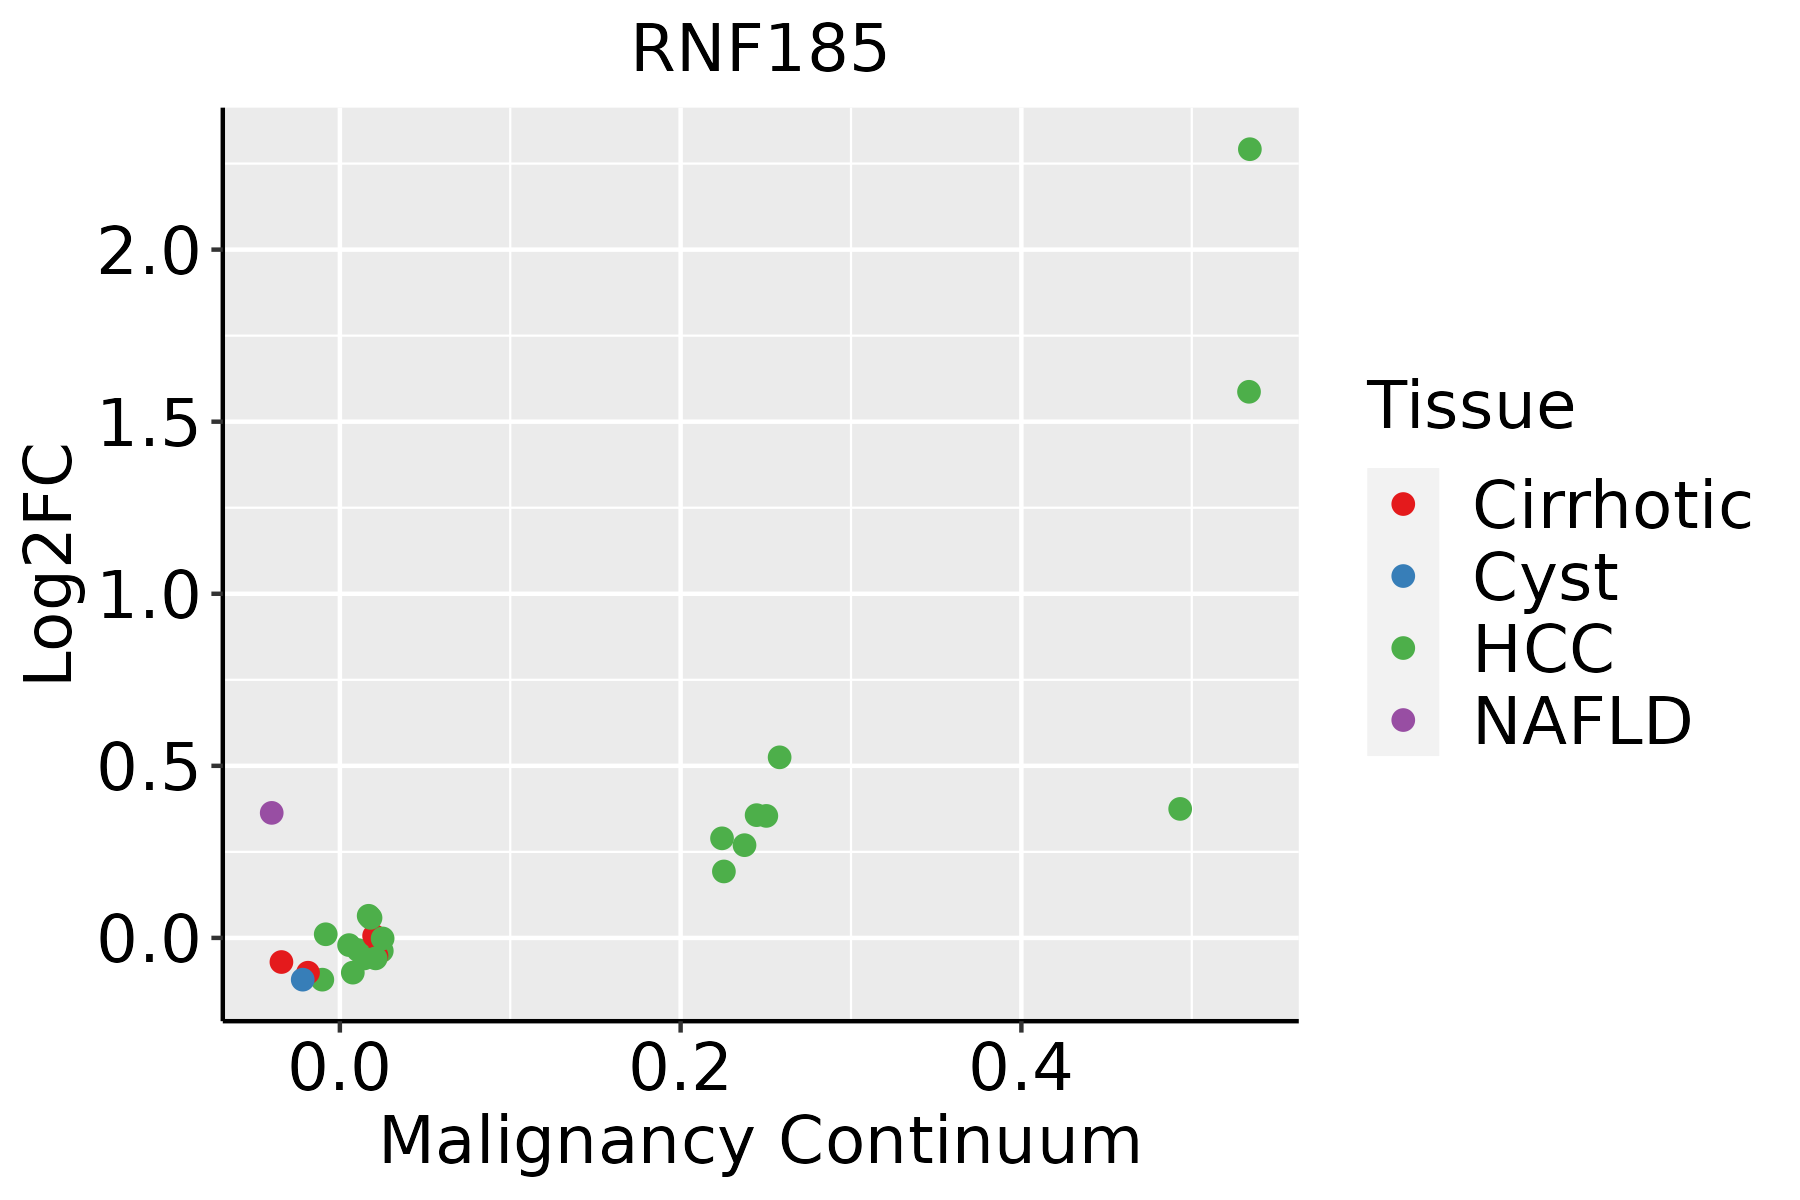 | HCC: Hepatocellular carcinoma |
| NAFLD: Non-alcoholic fatty liver disease |
| ∗log2FC in expression of this searched gene in stem-like cells from each diseased tissue sample relative to stem-like cells in normal samples in each tissue plotted against the malignancy continuum. Samples are colored based on if they are from different disease stage. |
Top |
Malignant transformation related pathway analysis |
| Find out the enriched GO biological processes and KEGG pathways involved in transition from healthy to precancer to cancer |
| Tissue | Disease Stage | Enriched GO biological Processes |
| Colorectum | AD |  |
| Colorectum | SER |  |
| Colorectum | MSS |  |
| Colorectum | MSI-H |  |
| Colorectum | FAP |  |
| ∗Top 15 enriched GO BP terms are showed in the bar plot of each disease state in each tissue. Each row represents a significant GO biological process which is colored according to the -log10(p.adjust). |
| Page: 1 2 3 4 5 6 7 8 9 |
| GO ID | Tissue | Disease Stage | Description | Gene Ratio | Bg Ratio | pvalue | p.adjust | Count |
| GO:00518654 | Liver | HCC | protein autoubiquitination | 42/7958 | 73/18723 | 6.78e-03 | 2.73e-02 | 42 |
| Page: 1 2 3 4 |
| Pathway ID | Tissue | Disease Stage | Description | Gene Ratio | Bg Ratio | pvalue | p.adjust | qvalue | Count |
| hsa04141211 | Esophagus | ESCC | Protein processing in endoplasmic reticulum | 147/4205 | 174/8465 | 3.29e-22 | 1.10e-19 | 5.64e-20 | 147 |
| hsa04141310 | Esophagus | ESCC | Protein processing in endoplasmic reticulum | 147/4205 | 174/8465 | 3.29e-22 | 1.10e-19 | 5.64e-20 | 147 |
| hsa0414122 | Liver | HCC | Protein processing in endoplasmic reticulum | 146/4020 | 174/8465 | 7.34e-24 | 2.46e-21 | 1.37e-21 | 146 |
| hsa0414132 | Liver | HCC | Protein processing in endoplasmic reticulum | 146/4020 | 174/8465 | 7.34e-24 | 2.46e-21 | 1.37e-21 | 146 |
| Page: 1 |
Top |
Cell-cell communication analysis |
| Identification of potential cell-cell interactions between two cell types and their ligand-receptor pairs for different disease states |
| Ligand | Receptor | LRpair | Pathway | Tissue | Disease Stage |
| Page: 1 |
Top |
Single-cell gene regulatory network inference analysis |
| Find out the significant the regulons (TFs) and the target genes of each regulon across cell types for different disease states |
| TF | Cell Type | Tissue | Disease Stage | Target Gene | RSS | Regulon Activity |
| ∗The dot plots of a searched regulon are shown for all cell subpopulations in each disease state of each tissue based on the regulon specific score inferred using pySCENIC and by calculating the average expression. |
| Page: 1 |
Top |
Somatic mutation of malignant transformation related genes |
| Annotation of somatic variants for genes involved in malignant transformation |
| Hugo Symbol | Variant Class | Variant Classification | dbSNP RS | HGVSc | HGVSp | HGVSp Short | SWISSPROT | BIOTYPE | SIFT | PolyPhen | Tumor Sample Barcode | Tissue | Histology | Sex | Age | Stage | Therapy Types | Drugs | Outcome |
| RNF185 | SNV | Missense_Mutation | novel | c.47G>A | p.Ser16Asn | p.S16N | Q96GF1 | protein_coding | tolerated(0.17) | benign(0.027) | TCGA-AC-A5EH-01 | Breast | breast invasive carcinoma | Female | >=65 | I/II | Unknown | Unknown | SD |
| RNF185 | SNV | Missense_Mutation | c.223N>T | p.Val75Leu | p.V75L | Q96GF1 | protein_coding | tolerated(0.41) | probably_damaging(0.935) | TCGA-AN-A0AR-01 | Breast | breast invasive carcinoma | Female | <65 | I/II | Unknown | Unknown | SD | |
| RNF185 | SNV | Missense_Mutation | c.339G>C | p.Gln113His | p.Q113H | Q96GF1 | protein_coding | tolerated(0.05) | probably_damaging(0.948) | TCGA-EK-A2H0-01 | Cervix | cervical & endocervical cancer | Female | <65 | I/II | Chemotherapy | cisplatin | CR | |
| RNF185 | SNV | Missense_Mutation | c.339N>C | p.Gln113His | p.Q113H | Q96GF1 | protein_coding | tolerated(0.05) | probably_damaging(0.948) | TCGA-ZJ-A8QQ-01 | Cervix | cervical & endocervical cancer | Female | <65 | I/II | Chemotherapy | cisplatin | SD | |
| RNF185 | SNV | Missense_Mutation | c.281G>T | p.Arg94Met | p.R94M | Q96GF1 | protein_coding | deleterious(0) | probably_damaging(0.962) | TCGA-AA-3710-01 | Colorectum | colon adenocarcinoma | Female | >=65 | I/II | Unknown | Unknown | SD | |
| RNF185 | SNV | Missense_Mutation | rs780610930 | c.458T>C | p.Ile153Thr | p.I153T | Q96GF1 | protein_coding | tolerated(0.28) | benign(0) | TCGA-EI-6917-01 | Colorectum | rectum adenocarcinoma | Male | <65 | III/IV | Chemotherapy | 5fluorouracil+oxaciplatina+l-folinian | SD |
| RNF185 | SNV | Missense_Mutation | rs763981355 | c.405N>A | p.Met135Ile | p.M135I | Q96GF1 | protein_coding | deleterious(0.02) | benign(0.38) | TCGA-A5-A0G1-01 | Endometrium | uterine corpus endometrioid carcinoma | Female | >=65 | I/II | Unknown | Unknown | SD |
| RNF185 | SNV | Missense_Mutation | novel | c.112G>A | p.Glu38Lys | p.E38K | Q96GF1 | protein_coding | deleterious(0) | probably_damaging(0.974) | TCGA-AJ-A3EL-01 | Endometrium | uterine corpus endometrioid carcinoma | Female | <65 | I/II | Unknown | Unknown | SD |
| RNF185 | SNV | Missense_Mutation | rs146844244 | c.148G>A | p.Val50Ile | p.V50I | Q96GF1 | protein_coding | deleterious(0) | probably_damaging(0.939) | TCGA-AP-A0LM-01 | Endometrium | uterine corpus endometrioid carcinoma | Female | <65 | III/IV | Chemotherapy | cisplatin | SD |
| RNF185 | SNV | Missense_Mutation | rs201108552 | c.20N>T | p.Ser7Leu | p.S7L | Q96GF1 | protein_coding | tolerated(0.08) | benign(0) | TCGA-AX-A1C4-01 | Endometrium | uterine corpus endometrioid carcinoma | Female | <65 | I/II | Unknown | Unknown | SD |
| Page: 1 2 |
Top |
Related drugs of malignant transformation related genes |
| Identification of chemicals and drugs interact with genes involved in malignant transfromation |
| (DGIdb 4.0) |
| Entrez ID | Symbol | Category | Interaction Types | Drug Claim Name | Drug Name | PMIDs |
| Page: 1 |

Copyright 2023-Present -The University of Texas Health Science Center at Houston |