
|
|||||
|
 | |
| |
| |
| |
| |
| |
|
Gene: RHOU |
Gene summary for RHOU |
| Gene information | Species | Human | Gene symbol | RHOU | Gene ID | 58480 |
| Gene name | ras homolog family member U | |
| Gene Alias | ARHU | |
| Cytomap | 1q42.13 | |
| Gene Type | protein-coding | GO ID | GO:0000902 | UniProtAcc | A0A024R3Q7 |
Top |
Malignant transformation analysis |
| Identification of the aberrant gene expression in precancerous and cancerous lesions by comparing the gene expression of stem-like cells in diseased tissues with normal stem cells |
| Entrez ID | Symbol | Replicates | Species | Organ | Tissue | Adj P-value | Log2FC | Malignancy |
| 58480 | RHOU | S43 | Human | Liver | Cirrhotic | 3.76e-02 | 4.03e-03 | -0.0187 |
| 58480 | RHOU | HCC1_Meng | Human | Liver | HCC | 7.65e-43 | -1.49e-02 | 0.0246 |
| 58480 | RHOU | HCC2_Meng | Human | Liver | HCC | 4.58e-07 | -5.96e-02 | 0.0107 |
| 58480 | RHOU | HCC1 | Human | Liver | HCC | 1.06e-10 | 3.95e+00 | 0.5336 |
| 58480 | RHOU | HCC2 | Human | Liver | HCC | 3.33e-03 | 2.71e+00 | 0.5341 |
| 58480 | RHOU | Pt13.b | Human | Liver | HCC | 6.03e-07 | 1.89e-01 | 0.0251 |
| 58480 | RHOU | S027 | Human | Liver | HCC | 6.86e-07 | 8.21e-01 | 0.2446 |
| 58480 | RHOU | S028 | Human | Liver | HCC | 8.11e-18 | 9.18e-01 | 0.2503 |
| 58480 | RHOU | S029 | Human | Liver | HCC | 1.28e-05 | 6.02e-01 | 0.2581 |
| 58480 | RHOU | male-WTA | Human | Thyroid | PTC | 3.43e-22 | 1.85e-01 | 0.1037 |
| 58480 | RHOU | PTC01 | Human | Thyroid | PTC | 2.77e-06 | 1.27e-01 | 0.1899 |
| 58480 | RHOU | PTC04 | Human | Thyroid | PTC | 1.92e-16 | 5.40e-01 | 0.1927 |
| 58480 | RHOU | PTC05 | Human | Thyroid | PTC | 1.11e-29 | 1.12e+00 | 0.2065 |
| 58480 | RHOU | PTC06 | Human | Thyroid | PTC | 3.30e-28 | 7.11e-01 | 0.2057 |
| 58480 | RHOU | PTC07 | Human | Thyroid | PTC | 1.47e-28 | 6.20e-01 | 0.2044 |
| 58480 | RHOU | ATC13 | Human | Thyroid | ATC | 2.78e-13 | 1.60e-01 | 0.34 |
| 58480 | RHOU | ATC5 | Human | Thyroid | ATC | 6.65e-11 | 1.81e-01 | 0.34 |
| Page: 1 |
| Tissue | Expression Dynamics | Abbreviation |
| Liver |  | HCC: Hepatocellular carcinoma |
| NAFLD: Non-alcoholic fatty liver disease | ||
| Prostate |  | BPH: Benign Prostatic Hyperplasia |
| Thyroid | 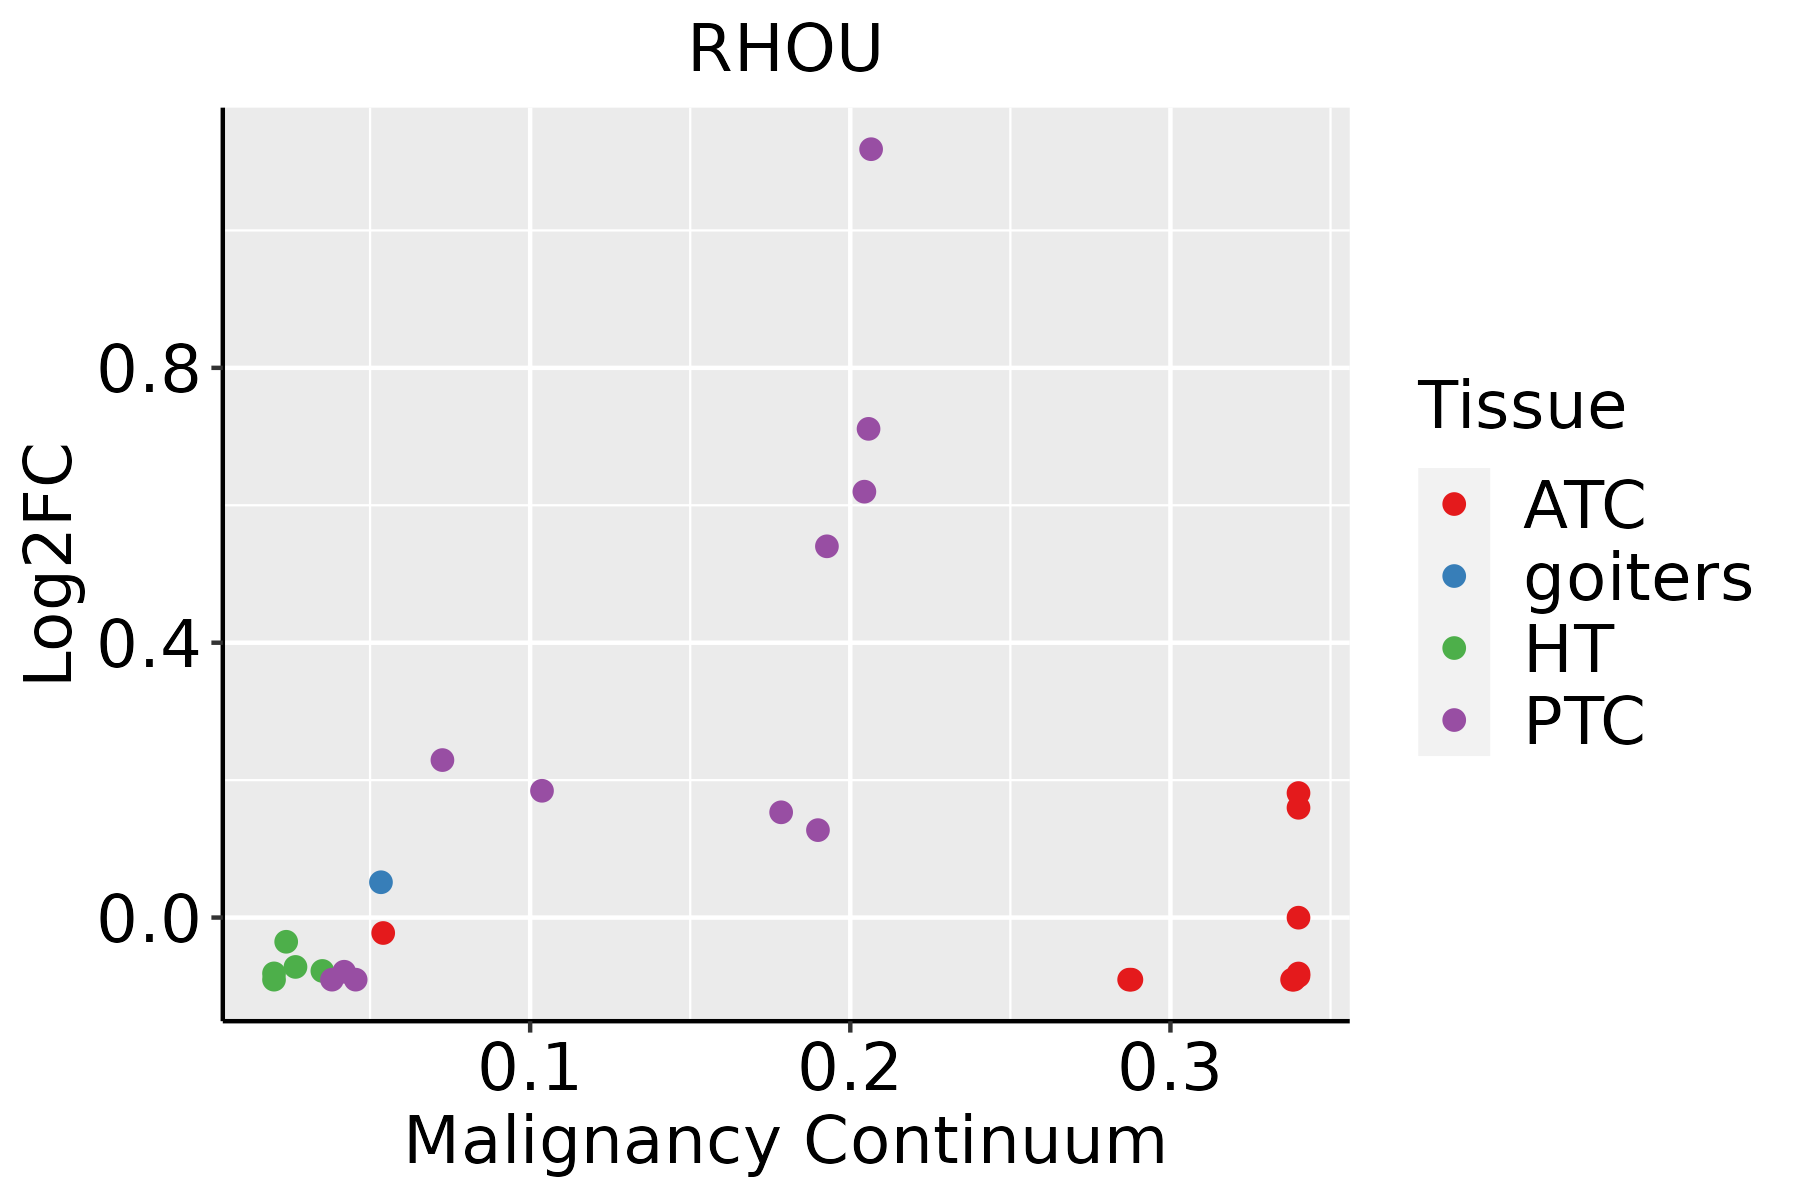 | ATC: Anaplastic thyroid cancer |
| HT: Hashimoto's thyroiditis | ||
| PTC: Papillary thyroid cancer |
| ∗log2FC in expression of this searched gene in stem-like cells from each diseased tissue sample relative to stem-like cells in normal samples in each tissue plotted against the malignancy continuum. Samples are colored based on if they are from different disease stage. |
Top |
Malignant transformation related pathway analysis |
| Find out the enriched GO biological processes and KEGG pathways involved in transition from healthy to precancer to cancer |
| Tissue | Disease Stage | Enriched GO biological Processes |
| Colorectum | AD |  |
| Colorectum | SER |  |
| Colorectum | MSS |  |
| Colorectum | MSI-H |  |
| Colorectum | FAP |  |
| ∗Top 15 enriched GO BP terms are showed in the bar plot of each disease state in each tissue. Each row represents a significant GO biological process which is colored according to the -log10(p.adjust). |
| Page: 1 2 3 4 5 6 7 8 9 |
| GO ID | Tissue | Disease Stage | Description | Gene Ratio | Bg Ratio | pvalue | p.adjust | Count |
| GO:000662617 | Prostate | Tumor | protein targeting to mitochondrion | 37/3246 | 100/18723 | 2.07e-06 | 3.56e-05 | 37 |
| GO:005105613 | Prostate | Tumor | regulation of small GTPase mediated signal transduction | 80/3246 | 302/18723 | 3.96e-05 | 4.57e-04 | 80 |
| GO:190374713 | Prostate | Tumor | regulation of establishment of protein localization to mitochondrion | 19/3246 | 50/18723 | 4.13e-04 | 3.16e-03 | 19 |
| GO:000726614 | Prostate | Tumor | Rho protein signal transduction | 39/3246 | 137/18723 | 8.18e-04 | 5.53e-03 | 39 |
| GO:190321413 | Prostate | Tumor | regulation of protein targeting to mitochondrion | 16/3246 | 44/18723 | 1.98e-03 | 1.15e-02 | 16 |
| GO:190353313 | Prostate | Tumor | regulation of protein targeting | 25/3246 | 81/18723 | 2.01e-03 | 1.16e-02 | 25 |
| GO:190374913 | Prostate | Tumor | positive regulation of establishment of protein localization to mitochondrion | 13/3246 | 36/18723 | 5.47e-03 | 2.60e-02 | 13 |
| GO:0072594112 | Thyroid | PTC | establishment of protein localization to organelle | 244/5968 | 422/18723 | 1.18e-28 | 4.97e-26 | 244 |
| GO:0032386111 | Thyroid | PTC | regulation of intracellular transport | 202/5968 | 337/18723 | 1.12e-26 | 3.93e-24 | 202 |
| GO:0033157112 | Thyroid | PTC | regulation of intracellular protein transport | 149/5968 | 229/18723 | 3.83e-25 | 1.15e-22 | 149 |
| GO:0032388112 | Thyroid | PTC | positive regulation of intracellular transport | 132/5968 | 202/18723 | 1.10e-22 | 2.57e-20 | 132 |
| GO:0090316110 | Thyroid | PTC | positive regulation of intracellular protein transport | 109/5968 | 160/18723 | 4.20e-21 | 7.79e-19 | 109 |
| GO:0006605113 | Thyroid | PTC | protein targeting | 180/5968 | 314/18723 | 6.81e-21 | 1.19e-18 | 180 |
| GO:1903829113 | Thyroid | PTC | positive regulation of cellular protein localization | 162/5968 | 276/18723 | 2.40e-20 | 3.52e-18 | 162 |
| GO:000683928 | Thyroid | PTC | mitochondrial transport | 150/5968 | 254/18723 | 2.76e-19 | 3.34e-17 | 150 |
| GO:1904951113 | Thyroid | PTC | positive regulation of establishment of protein localization | 175/5968 | 319/18723 | 1.10e-17 | 1.12e-15 | 175 |
| GO:0051222113 | Thyroid | PTC | positive regulation of protein transport | 163/5968 | 303/18723 | 1.58e-15 | 1.16e-13 | 163 |
| GO:0070585112 | Thyroid | PTC | protein localization to mitochondrion | 83/5968 | 125/18723 | 2.15e-15 | 1.56e-13 | 83 |
| GO:0022604112 | Thyroid | PTC | regulation of cell morphogenesis | 165/5968 | 309/18723 | 2.60e-15 | 1.82e-13 | 165 |
| GO:0072655112 | Thyroid | PTC | establishment of protein localization to mitochondrion | 80/5968 | 120/18723 | 4.87e-15 | 3.30e-13 | 80 |
| Page: 1 2 3 4 5 6 |
| Pathway ID | Tissue | Disease Stage | Description | Gene Ratio | Bg Ratio | pvalue | p.adjust | qvalue | Count |
| Page: 1 |
Top |
Cell-cell communication analysis |
| Identification of potential cell-cell interactions between two cell types and their ligand-receptor pairs for different disease states |
| Ligand | Receptor | LRpair | Pathway | Tissue | Disease Stage |
| Page: 1 |
Top |
Single-cell gene regulatory network inference analysis |
| Find out the significant the regulons (TFs) and the target genes of each regulon across cell types for different disease states |
| TF | Cell Type | Tissue | Disease Stage | Target Gene | RSS | Regulon Activity |
| ∗The dot plots of a searched regulon are shown for all cell subpopulations in each disease state of each tissue based on the regulon specific score inferred using pySCENIC and by calculating the average expression. |
| Page: 1 |
Top |
Somatic mutation of malignant transformation related genes |
| Annotation of somatic variants for genes involved in malignant transformation |
| Hugo Symbol | Variant Class | Variant Classification | dbSNP RS | HGVSc | HGVSp | HGVSp Short | SWISSPROT | BIOTYPE | SIFT | PolyPhen | Tumor Sample Barcode | Tissue | Histology | Sex | Age | Stage | Therapy Types | Drugs | Outcome |
| RHOU | insertion | Nonsense_Mutation | novel | c.772_773insCTGAAGTCAGACCCTGAGGATAAGATGGAAGTCAGGAAAA | p.Val258AlafsTer6 | p.V258Afs*6 | Q7L0Q8 | protein_coding | TCGA-B6-A0IK-01 | Breast | breast invasive carcinoma | Female | <65 | III/IV | Unknown | Unknown | PD | ||
| RHOU | SNV | Missense_Mutation | c.229N>A | p.Glu77Lys | p.E77K | Q7L0Q8 | protein_coding | tolerated(0.08) | benign(0.038) | TCGA-C5-A1BK-01 | Cervix | cervical & endocervical cancer | Female | <65 | I/II | Unknown | Unknown | SD | |
| RHOU | SNV | Missense_Mutation | rs780664653 | c.395N>A | p.Ser132Asn | p.S132N | Q7L0Q8 | protein_coding | tolerated(0.31) | benign(0.018) | TCGA-AA-3950-01 | Colorectum | colon adenocarcinoma | Female | >=65 | I/II | Unknown | Unknown | SD |
| RHOU | SNV | Missense_Mutation | rs764760417 | c.661G>A | p.Ala221Thr | p.A221T | Q7L0Q8 | protein_coding | deleterious(0.05) | benign(0.352) | TCGA-AD-6965-01 | Colorectum | colon adenocarcinoma | Male | <65 | III/IV | Chemotherapy | oxaliplatin | PD |
| RHOU | SNV | Missense_Mutation | novel | c.505N>A | p.Val169Ile | p.V169I | Q7L0Q8 | protein_coding | deleterious(0.04) | benign(0.162) | TCGA-AP-A059-01 | Endometrium | uterine corpus endometrioid carcinoma | Female | >=65 | I/II | Unknown | Unknown | SD |
| RHOU | SNV | Missense_Mutation | novel | c.530N>C | p.Lys177Thr | p.K177T | Q7L0Q8 | protein_coding | deleterious(0.01) | possibly_damaging(0.458) | TCGA-AP-A0LM-01 | Endometrium | uterine corpus endometrioid carcinoma | Female | <65 | III/IV | Chemotherapy | cisplatin | SD |
| RHOU | SNV | Missense_Mutation | c.289N>A | p.Val97Met | p.V97M | Q7L0Q8 | protein_coding | deleterious(0.01) | possibly_damaging(0.848) | TCGA-AP-A1DK-01 | Endometrium | uterine corpus endometrioid carcinoma | Female | <65 | I/II | Unknown | Unknown | SD | |
| RHOU | SNV | Missense_Mutation | c.617N>C | p.Leu206Ser | p.L206S | Q7L0Q8 | protein_coding | deleterious(0) | probably_damaging(0.998) | TCGA-AX-A063-01 | Endometrium | uterine corpus endometrioid carcinoma | Female | <65 | I/II | Unknown | Unknown | SD | |
| RHOU | SNV | Missense_Mutation | rs776181808 | c.658N>A | p.Val220Ile | p.V220I | Q7L0Q8 | protein_coding | tolerated(0.08) | benign(0.009) | TCGA-AX-A06F-01 | Endometrium | uterine corpus endometrioid carcinoma | Female | <65 | III/IV | Chemotherapy | carboplatin | SD |
| RHOU | SNV | Missense_Mutation | novel | c.343N>T | p.Pro115Ser | p.P115S | Q7L0Q8 | protein_coding | tolerated(0.18) | benign(0.289) | TCGA-B5-A3FA-01 | Endometrium | uterine corpus endometrioid carcinoma | Female | >=65 | I/II | Unknown | Unknown | SD |
| Page: 1 2 3 |
Top |
Related drugs of malignant transformation related genes |
| Identification of chemicals and drugs interact with genes involved in malignant transfromation |
| (DGIdb 4.0) |
| Entrez ID | Symbol | Category | Interaction Types | Drug Claim Name | Drug Name | PMIDs |
| Page: 1 |

Copyright 2023-Present -The University of Texas Health Science Center at Houston |