Schematic overview of the cellular and molecular mechanisms involved in the cancer progression, including the proposed cellular and molecular mechanisms in cancer cells trajectory. AT1: alveolar type 1 cells; AT2: alveolar type 2 cells; AAH: atypical adenomatous hyperplasia; AIS: adenocarcinoma in situ; MIA: minimally invasive adenocarcinoma; IA: invasive adenocarcinoma; EMT: epithelial-mesenchymal transition

Home

Download

Statistics

Help

Contact

Center for Computational Systems Medicine
leaf

Gene summary

leaf

Malignant transformation analysis

leaf

Malignant transformation related pathway analysis

leaf

Cell-cell communication analysis

leaf

Single-cell gene regulatory network inference analysis

leaf

Somatic mutation of malignant transformation related genes

leaf

Related drugs of malignant transformation related genes

Gene: RHOBTB3

Gene summary for RHOBTB3

check button Gene summary.

Gene informationSpeciesHuman
Gene symbol

RHOBTB3

Gene ID

22836

Gene nameRho related BTB domain containing 3
Gene AliasRHOBTB3
Cytomap5q15
Gene Typeprotein-coding
GO ID

GO:0000003

UniProtAcc

O94955


Top

Malignant transformation analysis

check button Identification of the aberrant gene expression in precancerous and cancerous lesions by comparing the gene expression of stem-like cells in diseased tissues with normal stem cells
check button Malignant transformation involving gene list.
Entrez IDSymbolReplicatesSpeciesOrganTissueAdj P-valueLog2FCMalignancy
22836RHOBTB3GSM4909281HumanBreastIDC4.57e-021.97e-010.21
22836RHOBTB3GSM4909285HumanBreastIDC4.60e-143.54e-010.21
22836RHOBTB3GSM4909286HumanBreastIDC1.55e-234.09e-010.1081
22836RHOBTB3GSM4909296HumanBreastIDC6.20e-05-1.88e-010.1524
22836RHOBTB3GSM4909297HumanBreastIDC3.79e-02-1.32e-010.1517
22836RHOBTB3GSM4909301HumanBreastIDC3.06e-338.02e-010.1577
22836RHOBTB3GSM4909307HumanBreastIDC3.81e-521.04e+000.1569
22836RHOBTB3GSM4909308HumanBreastIDC1.56e-1091.44e+000.158
22836RHOBTB3GSM4909311HumanBreastIDC3.84e-07-2.05e-010.1534
22836RHOBTB3GSM4909312HumanBreastIDC3.84e-07-2.05e-010.1552
22836RHOBTB3GSM4909319HumanBreastIDC8.25e-07-1.98e-010.1563
22836RHOBTB3DCIS2HumanBreastDCIS1.54e-04-1.88e-010.0085
22836RHOBTB3HTA11_99999970781_79442HumanColorectumMSS1.53e-06-3.37e-010.294
22836RHOBTB3HTA11_99999973899_84307HumanColorectumMSS1.96e-09-7.21e-010.2585
22836RHOBTB3HTA11_99999974143_84620HumanColorectumMSS1.59e-02-2.61e-010.3005
22836RHOBTB3A001-C-207HumanColorectumFAP4.54e-02-1.86e-010.1278
22836RHOBTB3A015-C-203HumanColorectumFAP3.10e-24-4.00e-01-0.1294
22836RHOBTB3A015-C-204HumanColorectumFAP5.24e-05-2.28e-01-0.0228
22836RHOBTB3A014-C-040HumanColorectumFAP1.41e-03-2.88e-01-0.1184
22836RHOBTB3A002-C-201HumanColorectumFAP1.83e-10-1.69e-010.0324
Page: 1 2 3 4 5 6 7 8 

check button Transcriptomic changes along malignancy continuum.
TissueExpression DynamicsAbbreviation
BreastThe image shows the transcriptomic changes along malignancy continuum.log2FC in expression of this searched gene in stem-like cells from each diseased tissue sample relative to stem-like cells in normal samples in each tissue plotted against the malignancy continuum. Samples are colored based on if they are from different disease stage.
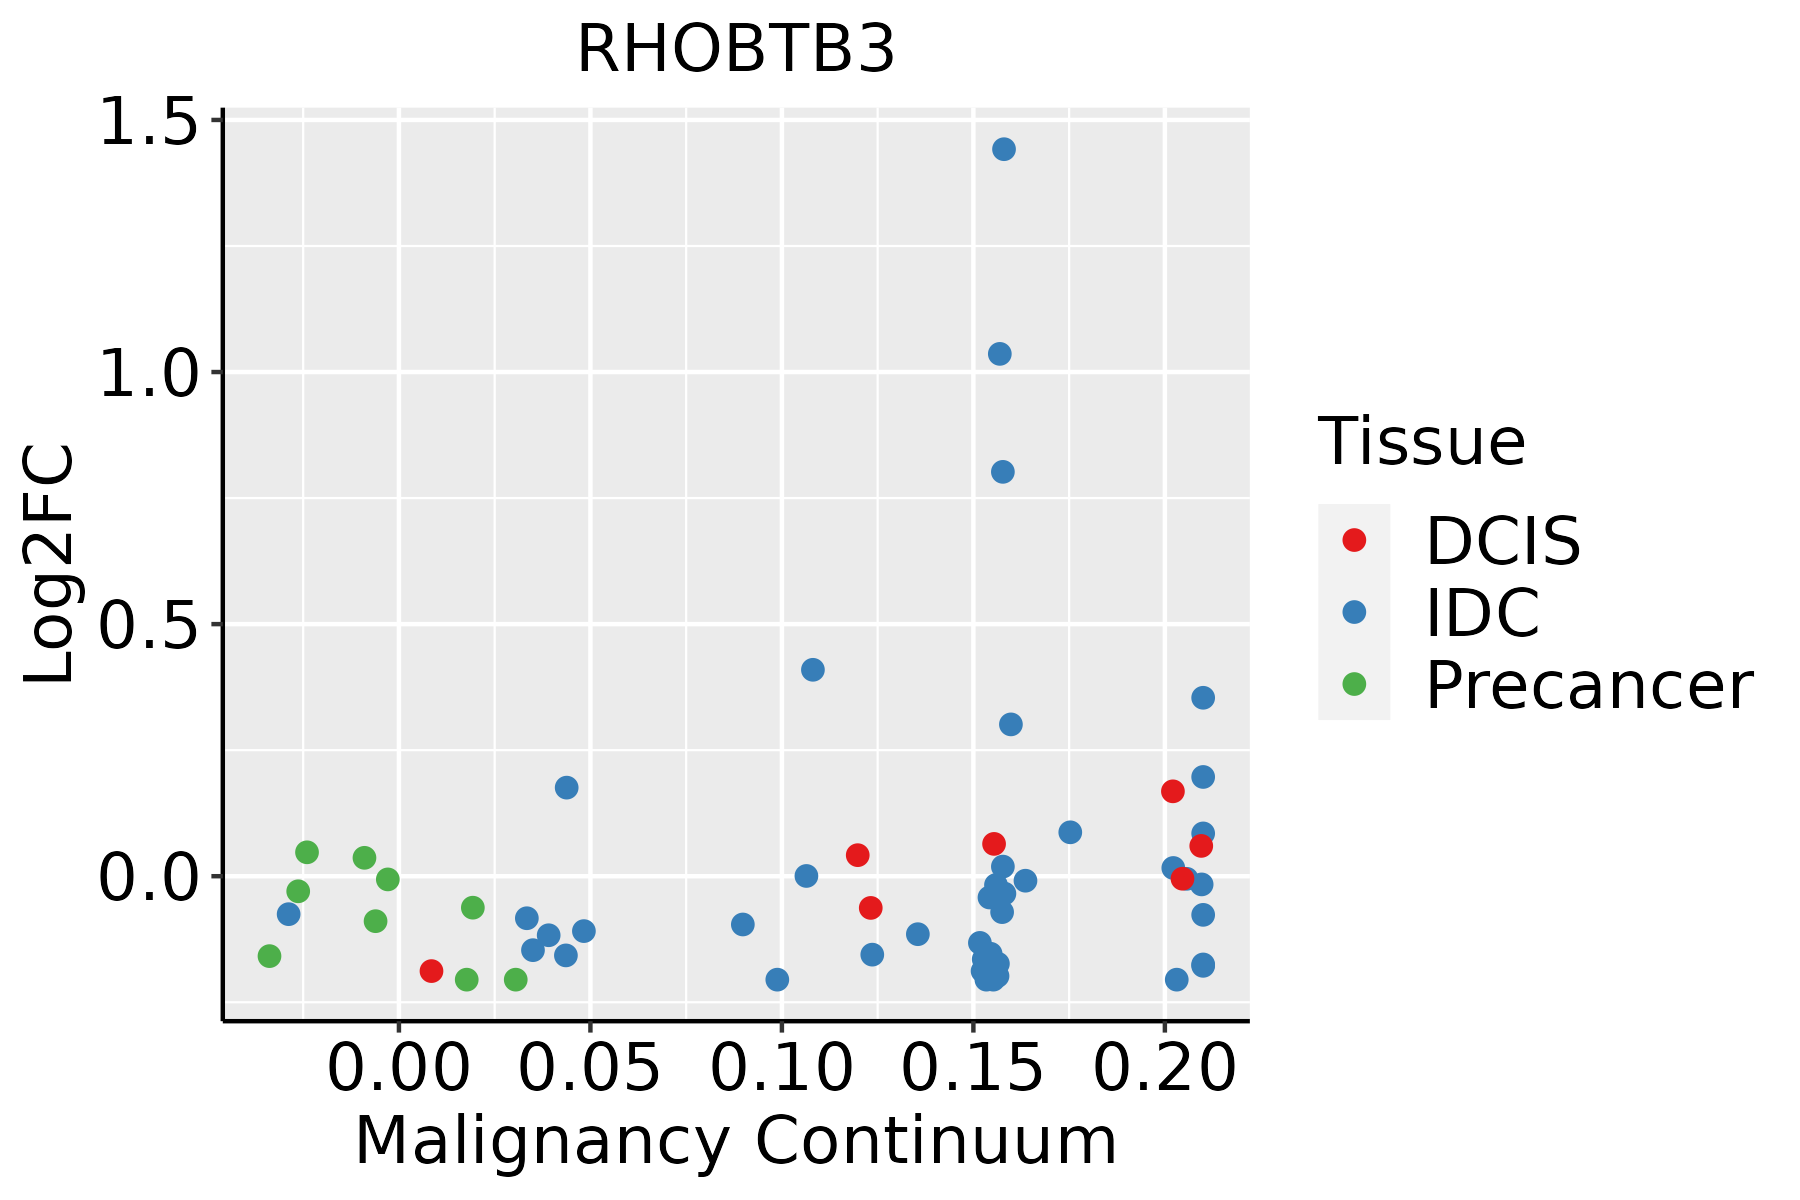
IDC: Invasive ductal carcinoma
DCIS: Ductal carcinoma in situ
Precancer(BRCA1-mut): Precancerous lesion from BRCA1 mutation carriers
Colorectum (GSE201348)The image shows the transcriptomic changes along malignancy continuum.log2FC in expression of this searched gene in stem-like cells from each diseased tissue sample relative to stem-like cells in normal samples in each tissue plotted against the malignancy continuum. Samples are colored based on if they are from different disease stage.FAP: Familial adenomatous polyposis
CRC: Colorectal cancer
Colorectum (HTA11)The image shows the transcriptomic changes along malignancy continuum.log2FC in expression of this searched gene in stem-like cells from each diseased tissue sample relative to stem-like cells in normal samples in each tissue plotted against the malignancy continuum. Samples are colored based on if they are from different disease stage.AD: Adenomas
SER: Sessile serrated lesions
MSI-H: Microsatellite-high colorectal cancer
MSS: Microsatellite stable colorectal cancer
EsophagusThe image shows the transcriptomic changes along malignancy continuum.log2FC in expression of this searched gene in stem-like cells from each diseased tissue sample relative to stem-like cells in normal samples in each tissue plotted against the malignancy continuum. Samples are colored based on if they are from different disease stage.
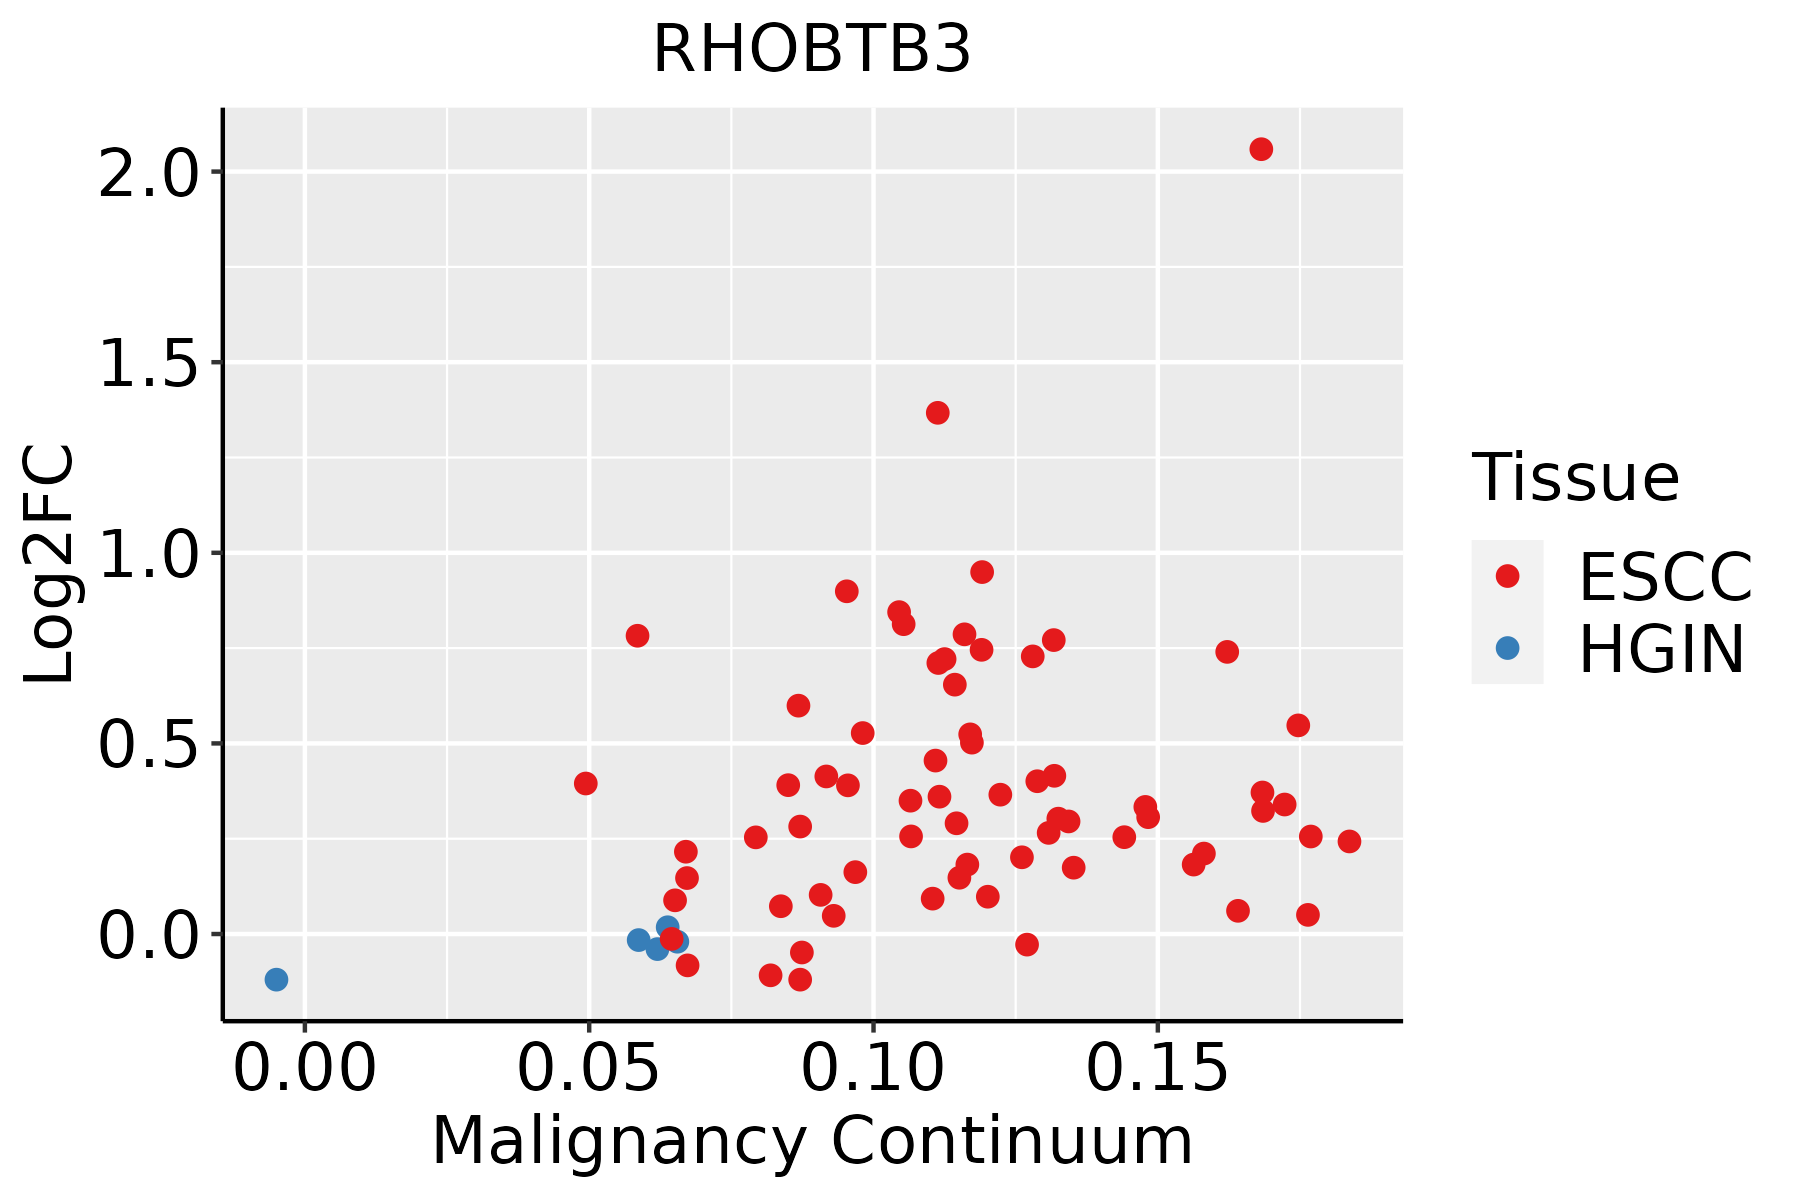
ESCC: Esophageal squamous cell carcinoma
HGIN: High-grade intraepithelial neoplasias
LGIN: Low-grade intraepithelial neoplasias
LiverThe image shows the transcriptomic changes along malignancy continuum.log2FC in expression of this searched gene in stem-like cells from each diseased tissue sample relative to stem-like cells in normal samples in each tissue plotted against the malignancy continuum. Samples are colored based on if they are from different disease stage.
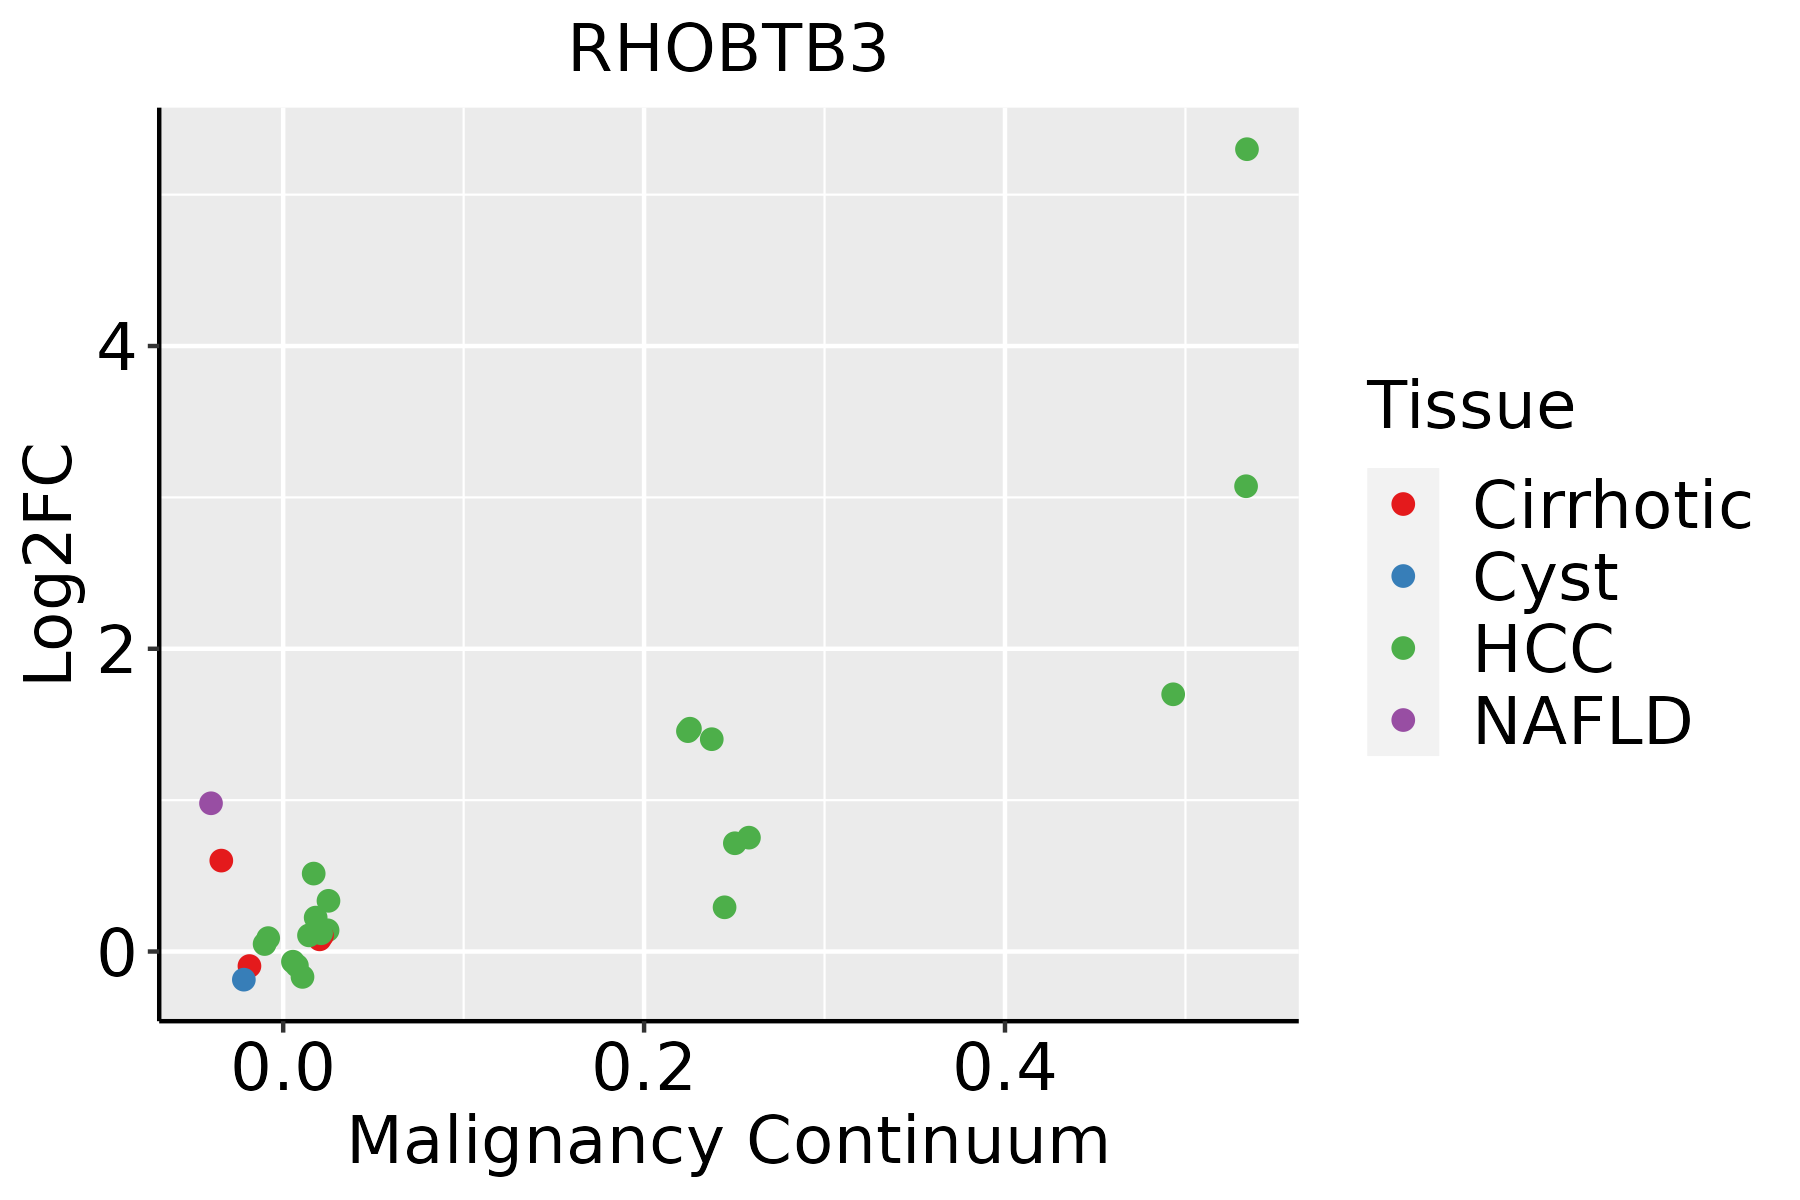
HCC: Hepatocellular carcinoma
NAFLD: Non-alcoholic fatty liver disease
LungThe image shows the transcriptomic changes along malignancy continuum.log2FC in expression of this searched gene in stem-like cells from each diseased tissue sample relative to stem-like cells in normal samples in each tissue plotted against the malignancy continuum. Samples are colored based on if they are from different disease stage.AAH: Atypical adenomatous hyperplasia
AIS: Adenocarcinoma in situ
IAC: Invasive lung adenocarcinoma
MIA: Minimally invasive adenocarcinoma
Oral CavityThe image shows the transcriptomic changes along malignancy continuum.log2FC in expression of this searched gene in stem-like cells from each diseased tissue sample relative to stem-like cells in normal samples in each tissue plotted against the malignancy continuum. Samples are colored based on if they are from different disease stage.
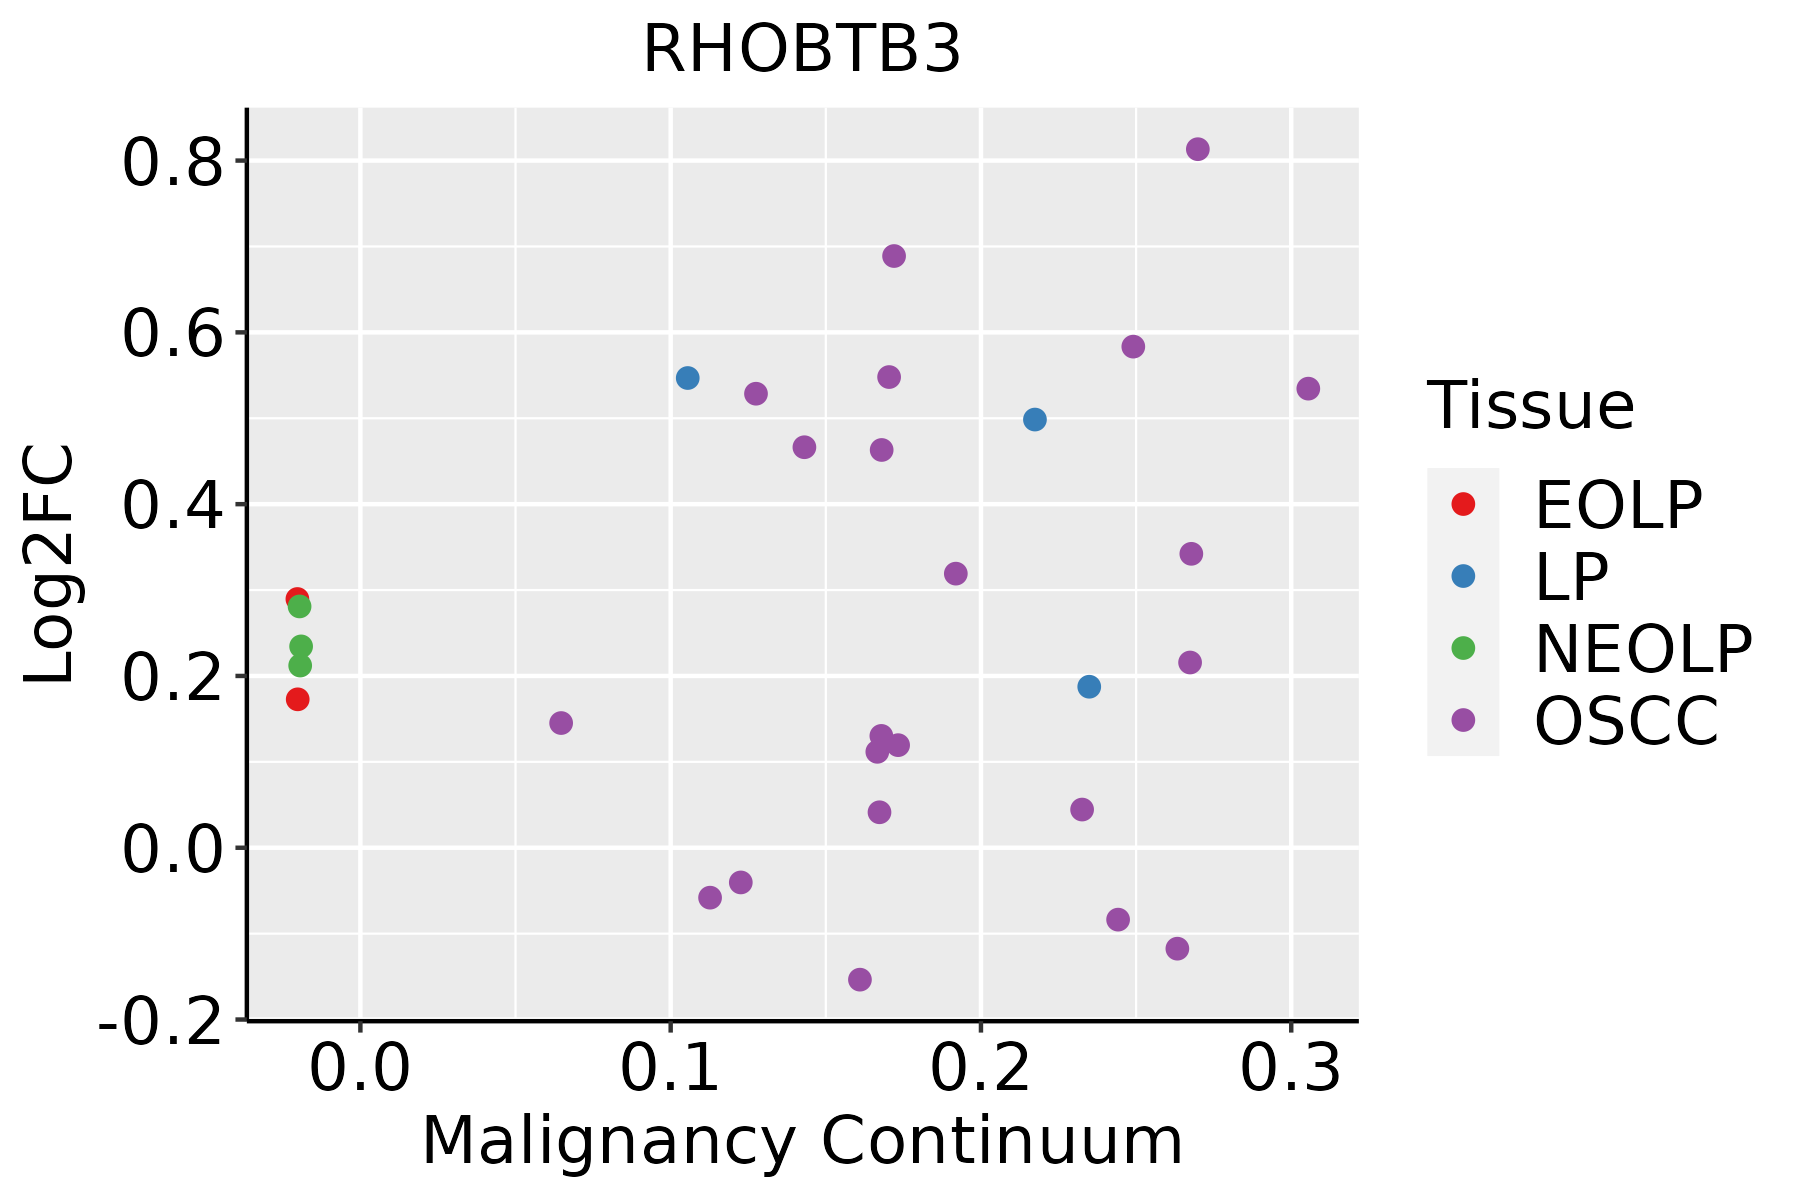
EOLP: Erosive Oral lichen planus
LP: leukoplakia
NEOLP: Non-erosive oral lichen planus
OSCC: Oral squamous cell carcinoma
ProstateThe image shows the transcriptomic changes along malignancy continuum.log2FC in expression of this searched gene in stem-like cells from each diseased tissue sample relative to stem-like cells in normal samples in each tissue plotted against the malignancy continuum. Samples are colored based on if they are from different disease stage.
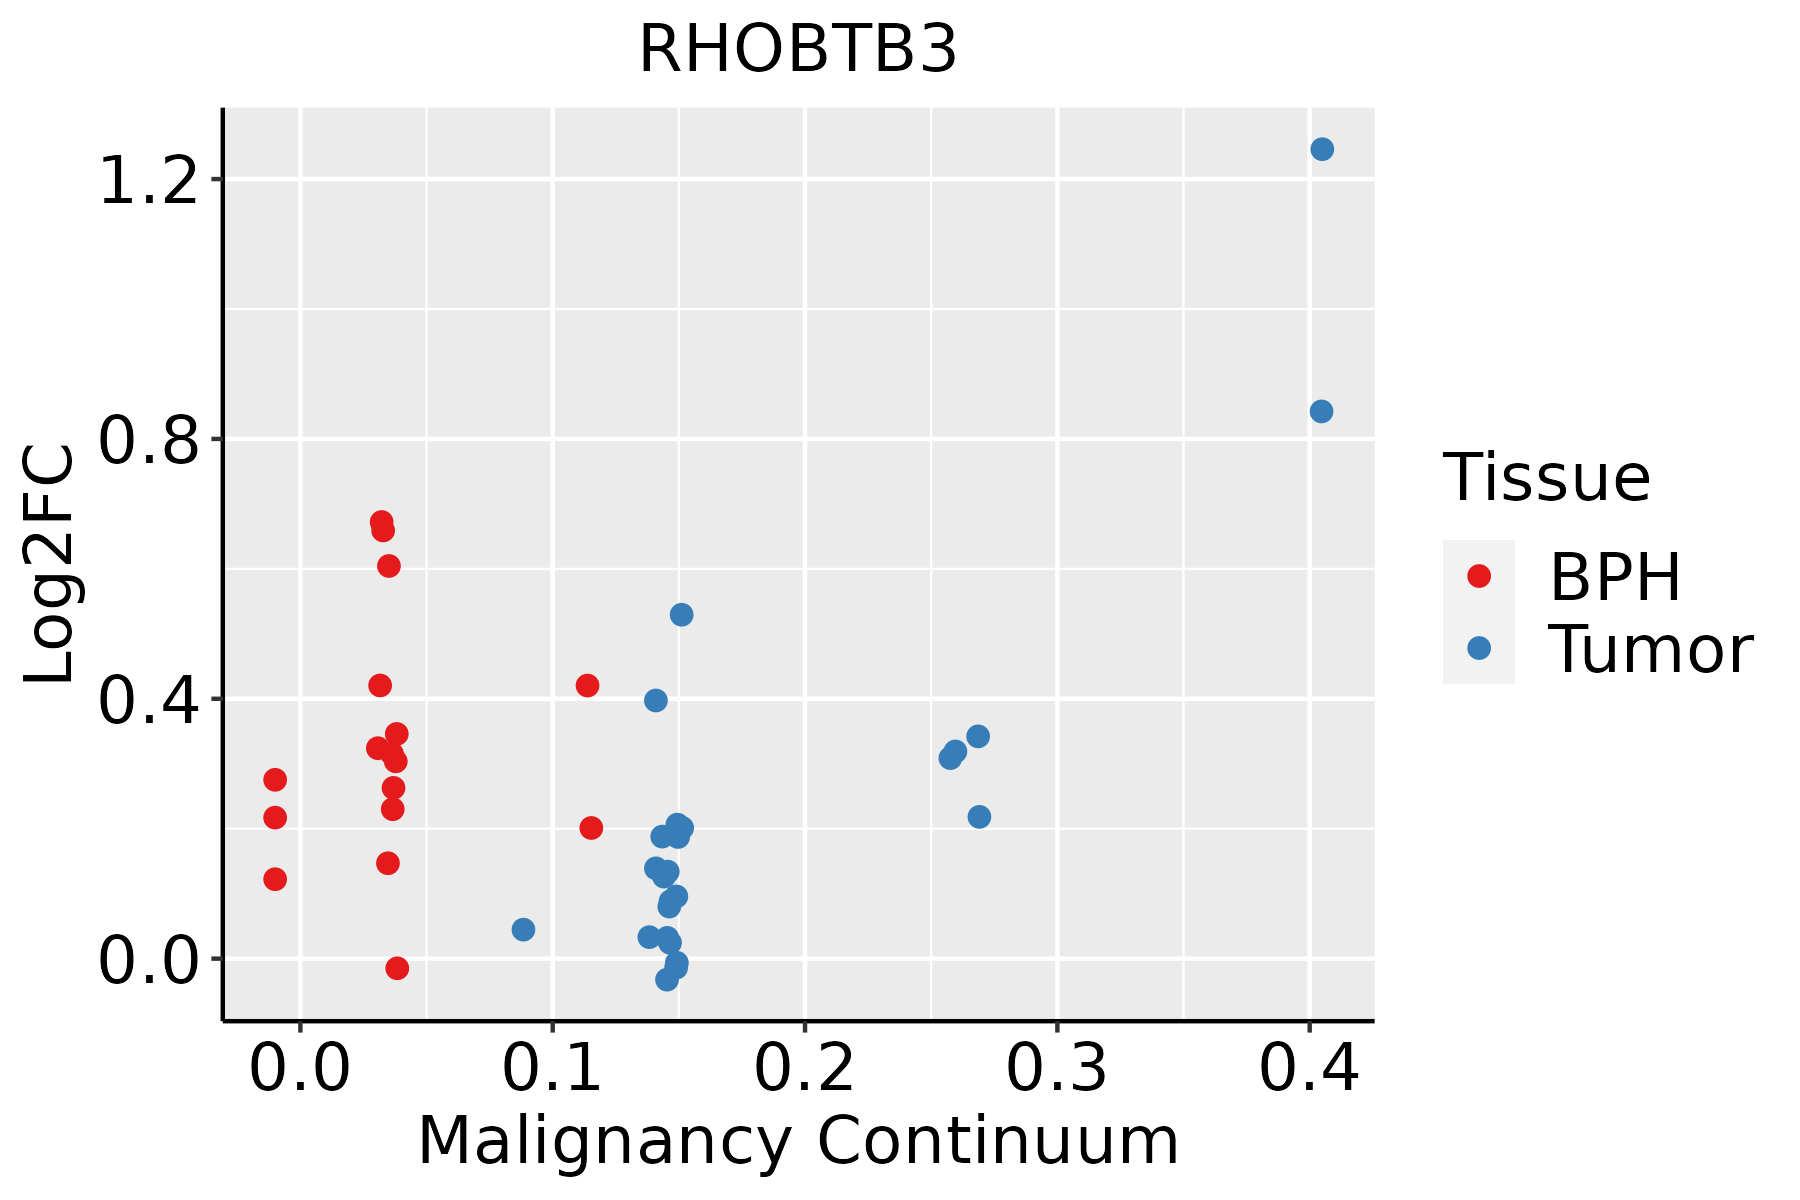
BPH: Benign Prostatic Hyperplasia
ThyroidThe image shows the transcriptomic changes along malignancy continuum.log2FC in expression of this searched gene in stem-like cells from each diseased tissue sample relative to stem-like cells in normal samples in each tissue plotted against the malignancy continuum. Samples are colored based on if they are from different disease stage.ATC: Anaplastic thyroid cancer
HT: Hashimoto's thyroiditis
PTC: Papillary thyroid cancer
∗log2FC in expression of this searched gene in stem-like cells from each diseased tissue sample relative to stem-like cells in normal samples in each tissue plotted against the malignancy continuum. Samples are colored based on if they are from different disease stage.

Top

Malignant transformation related pathway analysis

check buttonFind out the enriched GO biological processes and KEGG pathways involved in transition from healthy to precancer to cancer
check button Figure of enriched GO biological processes.
TissueDisease StageEnriched GO biological Processes
ColorectumADGO analysis - Figure of enriched GO biological processes: Top 15 enriched GO BP terms are showed in the bar plot of each disease state in each tissue. Each row represents a significant GO biological process which is colored according to the -log10(p.adjust).
ColorectumSERGO analysis - Figure of enriched GO biological processes: Top 15 enriched GO BP terms are showed in the bar plot of each disease state in each tissue. Each row represents a significant GO biological process which is colored according to the -log10(p.adjust).
ColorectumMSSGO analysis - Figure of enriched GO biological processes: Top 15 enriched GO BP terms are showed in the bar plot of each disease state in each tissue. Each row represents a significant GO biological process which is colored according to the -log10(p.adjust).
ColorectumMSI-HGO analysis - Figure of enriched GO biological processes: Top 15 enriched GO BP terms are showed in the bar plot of each disease state in each tissue. Each row represents a significant GO biological process which is colored according to the -log10(p.adjust).
ColorectumFAPGO analysis - Figure of enriched GO biological processes: Top 15 enriched GO BP terms are showed in the bar plot of each disease state in each tissue. Each row represents a significant GO biological process which is colored according to the -log10(p.adjust).
∗Top 15 enriched GO BP terms are showed in the bar plot of each disease state in each tissue. Each row represents a significant GO biological process which is colored according to the -log10(p.adjust).
Page: 1 2 3 4 5 6 7 8 9 

check button Enriched GO biological processes.
GO IDTissueDisease StageDescriptionGene RatioBg Ratiopvaluep.adjustCount
GO:001648210EsophagusESCCcytosolic transport124/8552168/187239.69e-144.69e-12124
GO:000716320EsophagusESCCestablishment or maintenance of cell polarity143/8552218/187232.05e-094.65e-08143
GO:000701527EsophagusESCCactin filament organization259/8552442/187232.37e-084.50e-07259
GO:0061458110EsophagusESCCreproductive system development247/8552427/187232.24e-073.42e-06247
GO:004860818EsophagusESCCreproductive structure development245/8552424/187232.82e-074.14e-06245
GO:0032970111EsophagusESCCregulation of actin filament-based process231/8552397/187232.91e-074.20e-06231
GO:0032956111EsophagusESCCregulation of actin cytoskeleton organization210/8552358/187234.40e-076.00e-06210
GO:00421477EsophagusESCCretrograde transport, endosome to Golgi63/855291/187234.58e-064.87e-0563
GO:002260420EsophagusESCCregulation of cell morphogenesis180/8552309/187235.19e-065.45e-05180
GO:003086517EsophagusESCCcortical cytoskeleton organization44/855261/187232.50e-052.13e-0444
GO:000836018EsophagusESCCregulation of cell shape92/8552154/187233.00e-041.81e-0392
GO:00226047LiverNAFLDregulation of cell morphogenesis62/1882309/187238.35e-087.09e-0662
GO:00070157LiverNAFLDactin filament organization78/1882442/187235.44e-073.21e-0578
GO:00071636LiverNAFLDestablishment or maintenance of cell polarity46/1882218/187238.80e-074.60e-0546
GO:00329707LiverNAFLDregulation of actin filament-based process66/1882397/187232.92e-057.72e-0466
GO:00329567LiverNAFLDregulation of actin cytoskeleton organization60/1882358/187235.20e-051.20e-0360
GO:00164825LiverNAFLDcytosolic transport34/1882168/187235.52e-051.25e-0334
GO:00161975LiverNAFLDendosomal transport41/1882230/187232.02e-043.53e-0341
GO:00421474LiverNAFLDretrograde transport, endosome to Golgi19/188291/187231.55e-031.67e-0219
GO:00083606LiverNAFLDregulation of cell shape27/1882154/187232.92e-032.65e-0227
Page: 1 2 3 4 5 6 7 8 9 10 11 12 13 

check button Enriched KEGG pathways.
Pathway IDTissueDisease StageDescriptionGene RatioBg Ratiopvaluep.adjustqvalueCount
Page: 1 

Top

Cell-cell communication analysis

check buttonIdentification of potential cell-cell interactions between two cell types and their ligand-receptor pairs for different disease states
LigandReceptorLRpairPathwayTissueDisease Stage
Page: 1 

Top

Single-cell gene regulatory network inference analysis

check buttonFind out the significant the regulons (TFs) and the target genes of each regulon across cell types for different disease states
TFCell TypeTissueDisease StageTarget GeneRSSRegulon Activity
∗The dot plots of a searched regulon are shown for all cell subpopulations in each disease state of each tissue based on the regulon specific score inferred using pySCENIC and by calculating the average expression.
Page: 1 

Top

Somatic mutation of malignant transformation related genes

check buttonAnnotation of somatic variants for genes involved in malignant transformation
Hugo SymbolVariant ClassVariant ClassificationdbSNP RSHGVScHGVSpHGVSp ShortSWISSPROTBIOTYPESIFTPolyPhenTumor Sample BarcodeTissueHistologySexAgeStageTherapy TypesDrugsOutcome
RHOBTB3SNVMissense_Mutationc.1325N>Tp.Cys442Phep.C442FO94955protein_codingdeleterious(0.01)probably_damaging(0.995)TCGA-A2-A25A-01Breastbreast invasive carcinomaFemale<65I/IIUnspecificCytoxanSD
RHOBTB3SNVMissense_Mutationc.1099G>Cp.Asp367Hisp.D367HO94955protein_codingtolerated(0.07)benign(0.02)TCGA-A8-A06U-01Breastbreast invasive carcinomaFemale>=65I/IIUnknownUnknownSD
RHOBTB3SNVMissense_Mutationc.1726N>Cp.Glu576Glnp.E576QO94955protein_codingdeleterious(0.02)possibly_damaging(0.71)TCGA-AO-A0J9-01Breastbreast invasive carcinomaFemale<65III/IVChemotherapycyclophosphamidePD
RHOBTB3SNVMissense_Mutationc.1726N>Ap.Glu576Lysp.E576KO94955protein_codingdeleterious(0.02)possibly_damaging(0.535)TCGA-GM-A2D9-01Breastbreast invasive carcinomaFemale>=65I/IIHormone TherapyarimidexSD
RHOBTB3insertionNonsense_Mutationnovelc.457_458insCTCTGCTTGTTCCTGATTAAATGGTTAATp.Gly153AlafsTer7p.G153Afs*7O94955protein_codingTCGA-A2-A0EV-01Breastbreast invasive carcinomaFemale>=65I/IIUnknownUnknownSD
RHOBTB3insertionIn_Frame_Insnovelc.1033_1034insTTTACTTTTACCTTTp.Arg345delinsLeuTyrPheTyrLeuCysp.R345delinsLYFYLCO94955protein_codingTCGA-AR-A0U2-01Breastbreast invasive carcinomaFemale<65III/IVHormone TherapytamoxiphenPD
RHOBTB3deletionFrame_Shift_Delnovelc.48delNp.Gln17ArgfsTer28p.Q17Rfs*28O94955protein_codingTCGA-D8-A27V-01Breastbreast invasive carcinomaFemale<65I/IIHormone TherapytamoxiphenSD
RHOBTB3SNVMissense_Mutationnovelc.1371N>Cp.Lys457Asnp.K457NO94955protein_codingtolerated(0.6)benign(0.003)TCGA-C5-A8XJ-01Cervixcervical & endocervical cancerFemale>=65I/IIChemotherapycisplatinSD
RHOBTB3SNVMissense_Mutationrs148767115c.1784N>Tp.Ala595Valp.A595VO94955protein_codingdeleterious(0.02)possibly_damaging(0.46)TCGA-IR-A3LK-01Cervixcervical & endocervical cancerFemale>=65I/IIChemotherapycisplatinPD
RHOBTB3SNVMissense_Mutationc.1325G>Ap.Cys442Tyrp.C442YO94955protein_codingtolerated(0.06)probably_damaging(0.995)TCGA-3L-AA1B-01Colorectumcolon adenocarcinomaFemale<65I/IIUnknownUnknownSD
Page: 1 2 3 4 5 6 7 

Top

Related drugs of malignant transformation related genes

check buttonIdentification of chemicals and drugs interact with genes involved in malignant transfromation
(DGIdb 4.0)
Entrez IDSymbolCategoryInteraction TypesDrug Claim NameDrug NamePMIDs
Page: 1