
|
|||||
|
 | |
| |
| |
| |
| |
| |
|
Gene: RFWD3 |
Gene summary for RFWD3 |
| Gene information | Species | Human | Gene symbol | RFWD3 | Gene ID | 55159 |
| Gene name | ring finger and WD repeat domain 3 | |
| Gene Alias | FANCW | |
| Cytomap | 16q23.1 | |
| Gene Type | protein-coding | GO ID | GO:0000075 | UniProtAcc | Q6PCD5 |
Top |
Malignant transformation analysis |
| Identification of the aberrant gene expression in precancerous and cancerous lesions by comparing the gene expression of stem-like cells in diseased tissues with normal stem cells |
| Entrez ID | Symbol | Replicates | Species | Organ | Tissue | Adj P-value | Log2FC | Malignancy |
| 55159 | RFWD3 | CCI_1 | Human | Cervix | CC | 5.02e-03 | 4.53e-01 | 0.528 |
| 55159 | RFWD3 | CCI_2 | Human | Cervix | CC | 8.71e-07 | 7.09e-01 | 0.5249 |
| 55159 | RFWD3 | CCI_3 | Human | Cervix | CC | 7.70e-05 | 6.36e-01 | 0.516 |
| 55159 | RFWD3 | HCC1_Meng | Human | Liver | HCC | 6.44e-10 | 3.59e-04 | 0.0246 |
| 55159 | RFWD3 | HCC2_Meng | Human | Liver | HCC | 4.41e-05 | 3.11e-02 | 0.0107 |
| 55159 | RFWD3 | HCC1 | Human | Liver | HCC | 2.15e-07 | 3.19e+00 | 0.5336 |
| 55159 | RFWD3 | HCC2 | Human | Liver | HCC | 1.80e-12 | 2.79e+00 | 0.5341 |
| 55159 | RFWD3 | S028 | Human | Liver | HCC | 9.68e-06 | 3.72e-01 | 0.2503 |
| 55159 | RFWD3 | C04 | Human | Oral cavity | OSCC | 2.03e-10 | 3.82e-01 | 0.2633 |
| 55159 | RFWD3 | C21 | Human | Oral cavity | OSCC | 3.61e-17 | 5.11e-01 | 0.2678 |
| 55159 | RFWD3 | C30 | Human | Oral cavity | OSCC | 3.08e-18 | 7.79e-01 | 0.3055 |
| 55159 | RFWD3 | C38 | Human | Oral cavity | OSCC | 1.30e-04 | 2.43e-01 | 0.172 |
| 55159 | RFWD3 | C43 | Human | Oral cavity | OSCC | 1.08e-05 | 1.75e-01 | 0.1704 |
| 55159 | RFWD3 | C46 | Human | Oral cavity | OSCC | 6.05e-12 | 2.18e-01 | 0.1673 |
| 55159 | RFWD3 | C57 | Human | Oral cavity | OSCC | 3.31e-06 | 2.26e-01 | 0.1679 |
| 55159 | RFWD3 | C08 | Human | Oral cavity | OSCC | 5.46e-04 | 1.47e-01 | 0.1919 |
| 55159 | RFWD3 | LN22 | Human | Oral cavity | OSCC | 2.93e-08 | 3.86e-01 | 0.1733 |
| 55159 | RFWD3 | LN46 | Human | Oral cavity | OSCC | 4.98e-08 | 2.69e-01 | 0.1666 |
| 55159 | RFWD3 | LP15 | Human | Oral cavity | LP | 3.77e-02 | 2.23e-01 | 0.2174 |
| 55159 | RFWD3 | LP17 | Human | Oral cavity | LP | 8.02e-06 | 3.50e-01 | 0.2349 |
| Page: 1 2 |
| Tissue | Expression Dynamics | Abbreviation |
| Cervix |  | CC: Cervix cancer |
| HSIL_HPV: HPV-infected high-grade squamous intraepithelial lesions | ||
| N_HPV: HPV-infected normal cervix | ||
| Liver | 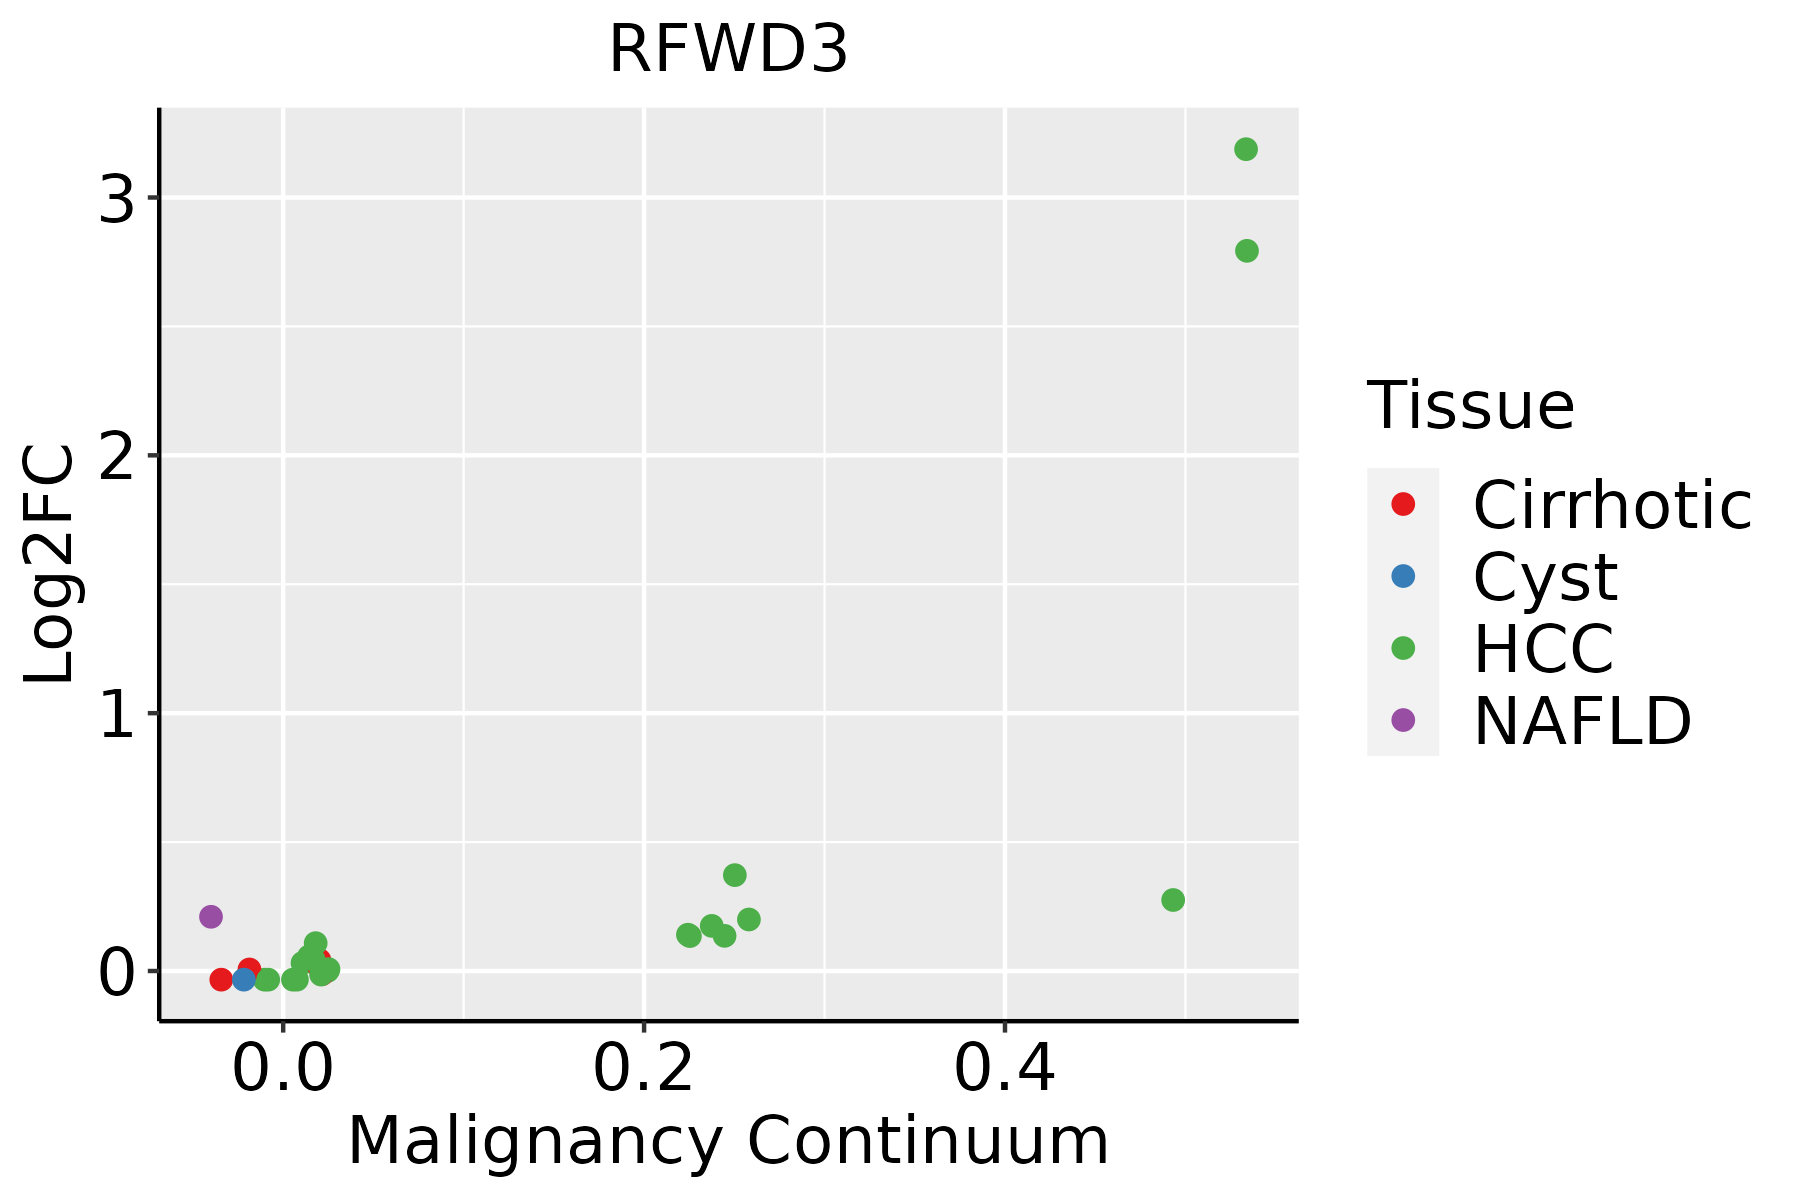 | HCC: Hepatocellular carcinoma |
| NAFLD: Non-alcoholic fatty liver disease | ||
| Oral Cavity | 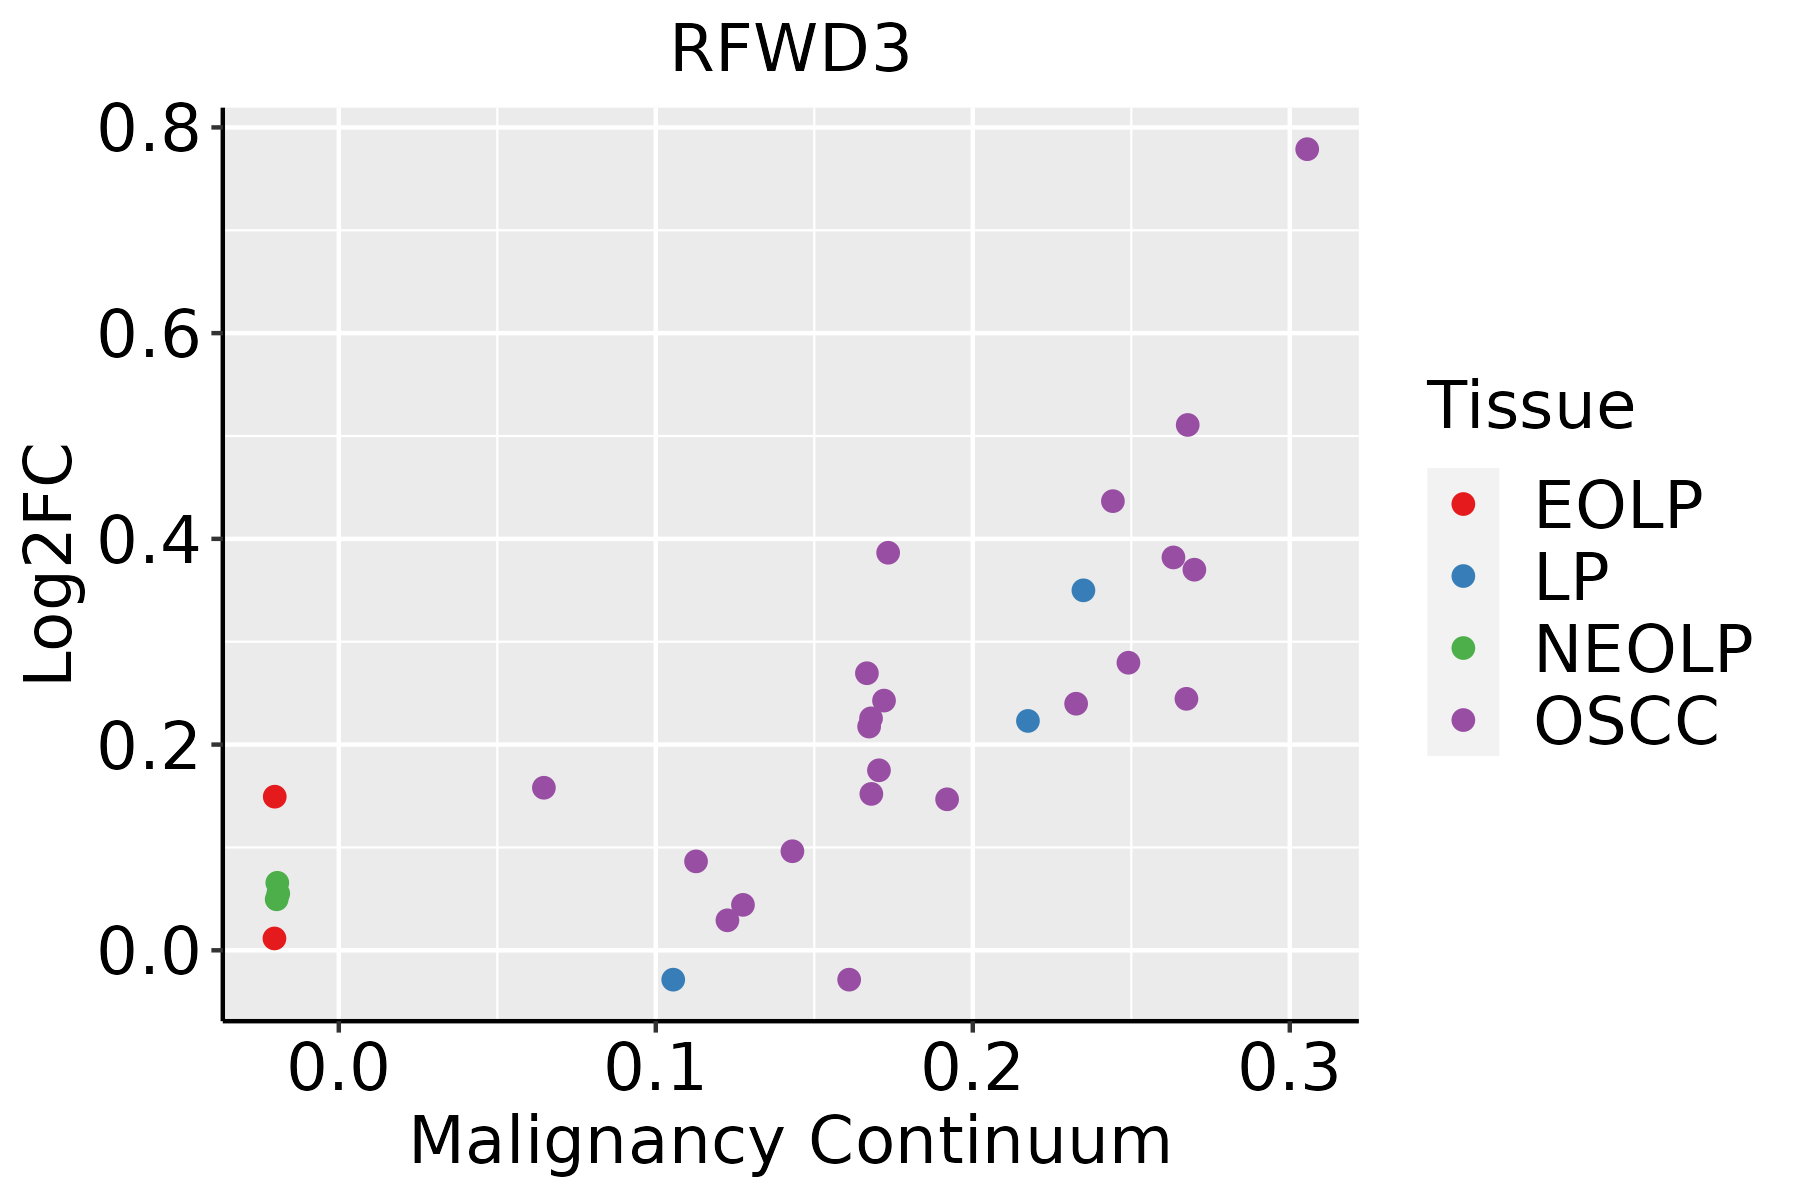 | EOLP: Erosive Oral lichen planus |
| LP: leukoplakia | ||
| NEOLP: Non-erosive oral lichen planus | ||
| OSCC: Oral squamous cell carcinoma |
| ∗log2FC in expression of this searched gene in stem-like cells from each diseased tissue sample relative to stem-like cells in normal samples in each tissue plotted against the malignancy continuum. Samples are colored based on if they are from different disease stage. |
Top |
Malignant transformation related pathway analysis |
| Find out the enriched GO biological processes and KEGG pathways involved in transition from healthy to precancer to cancer |
| Tissue | Disease Stage | Enriched GO biological Processes |
| Colorectum | AD |  |
| Colorectum | SER |  |
| Colorectum | MSS |  |
| Colorectum | MSI-H |  |
| Colorectum | FAP |  |
| ∗Top 15 enriched GO BP terms are showed in the bar plot of each disease state in each tissue. Each row represents a significant GO biological process which is colored according to the -log10(p.adjust). |
| Page: 1 2 3 4 5 6 7 8 9 |
| GO ID | Tissue | Disease Stage | Description | Gene Ratio | Bg Ratio | pvalue | p.adjust | Count |
| GO:00070933 | Oral cavity | OSCC | mitotic cell cycle checkpoint | 81/7305 | 129/18723 | 3.75e-08 | 7.06e-07 | 81 |
| GO:00427707 | Oral cavity | OSCC | signal transduction in response to DNA damage | 102/7305 | 172/18723 | 5.27e-08 | 9.68e-07 | 102 |
| GO:00459304 | Oral cavity | OSCC | negative regulation of mitotic cell cycle | 132/7305 | 235/18723 | 6.51e-08 | 1.16e-06 | 132 |
| GO:19019914 | Oral cavity | OSCC | negative regulation of mitotic cell cycle phase transition | 104/7305 | 179/18723 | 1.67e-07 | 2.73e-06 | 104 |
| GO:00000826 | Oral cavity | OSCC | G1/S transition of mitotic cell cycle | 120/7305 | 214/18723 | 2.86e-07 | 4.40e-06 | 120 |
| GO:19019882 | Oral cavity | OSCC | negative regulation of cell cycle phase transition | 136/7305 | 249/18723 | 3.81e-07 | 5.70e-06 | 136 |
| GO:00448436 | Oral cavity | OSCC | cell cycle G1/S phase transition | 131/7305 | 241/18723 | 8.77e-07 | 1.20e-05 | 131 |
| GO:00109483 | Oral cavity | OSCC | negative regulation of cell cycle process | 155/7305 | 294/18723 | 1.11e-06 | 1.48e-05 | 155 |
| GO:00063023 | Oral cavity | OSCC | double-strand break repair | 132/7305 | 251/18723 | 7.93e-06 | 8.52e-05 | 132 |
| GO:00315704 | Oral cavity | OSCC | DNA integrity checkpoint | 72/7305 | 123/18723 | 8.77e-06 | 9.31e-05 | 72 |
| GO:00000774 | Oral cavity | OSCC | DNA damage checkpoint | 67/7305 | 115/18723 | 2.20e-05 | 2.08e-04 | 67 |
| GO:00062611 | Oral cavity | OSCC | DNA-dependent DNA replication | 84/7305 | 151/18723 | 2.46e-05 | 2.30e-04 | 84 |
| GO:00447744 | Oral cavity | OSCC | mitotic DNA integrity checkpoint | 52/7305 | 85/18723 | 2.86e-05 | 2.64e-04 | 52 |
| GO:00447734 | Oral cavity | OSCC | mitotic DNA damage checkpoint | 50/7305 | 81/18723 | 2.87e-05 | 2.64e-04 | 50 |
| GO:00315717 | Oral cavity | OSCC | mitotic G1 DNA damage checkpoint | 22/7305 | 30/18723 | 1.43e-04 | 1.01e-03 | 22 |
| GO:00448197 | Oral cavity | OSCC | mitotic G1/S transition checkpoint | 22/7305 | 31/18723 | 3.11e-04 | 1.94e-03 | 22 |
| GO:0006310 | Oral cavity | OSCC | DNA recombination | 147/7305 | 305/18723 | 6.33e-04 | 3.56e-03 | 147 |
| GO:20000455 | Oral cavity | OSCC | regulation of G1/S transition of mitotic cell cycle | 74/7305 | 142/18723 | 1.01e-03 | 5.24e-03 | 74 |
| GO:19028064 | Oral cavity | OSCC | regulation of cell cycle G1/S phase transition | 84/7305 | 168/18723 | 2.38e-03 | 1.05e-02 | 84 |
| GO:0000725 | Oral cavity | OSCC | recombinational repair | 70/7305 | 140/18723 | 5.22e-03 | 2.03e-02 | 70 |
| Page: 1 2 3 4 5 6 |
| Pathway ID | Tissue | Disease Stage | Description | Gene Ratio | Bg Ratio | pvalue | p.adjust | qvalue | Count |
| Page: 1 |
Top |
Cell-cell communication analysis |
| Identification of potential cell-cell interactions between two cell types and their ligand-receptor pairs for different disease states |
| Ligand | Receptor | LRpair | Pathway | Tissue | Disease Stage |
| Page: 1 |
Top |
Single-cell gene regulatory network inference analysis |
| Find out the significant the regulons (TFs) and the target genes of each regulon across cell types for different disease states |
| TF | Cell Type | Tissue | Disease Stage | Target Gene | RSS | Regulon Activity |
| ∗The dot plots of a searched regulon are shown for all cell subpopulations in each disease state of each tissue based on the regulon specific score inferred using pySCENIC and by calculating the average expression. |
| Page: 1 |
Top |
Somatic mutation of malignant transformation related genes |
| Annotation of somatic variants for genes involved in malignant transformation |
| Hugo Symbol | Variant Class | Variant Classification | dbSNP RS | HGVSc | HGVSp | HGVSp Short | SWISSPROT | BIOTYPE | SIFT | PolyPhen | Tumor Sample Barcode | Tissue | Histology | Sex | Age | Stage | Therapy Types | Drugs | Outcome |
| RFWD3 | SNV | Missense_Mutation | c.2204N>T | p.Ser735Leu | p.S735L | Q6PCD5 | protein_coding | tolerated(0.06) | benign(0.01) | TCGA-A8-A09Z-01 | Breast | breast invasive carcinoma | Female | >=65 | I/II | Unknown | Unknown | SD | |
| RFWD3 | SNV | Missense_Mutation | c.1334N>G | p.Ser445Cys | p.S445C | Q6PCD5 | protein_coding | deleterious(0) | probably_damaging(0.987) | TCGA-AC-A23H-01 | Breast | breast invasive carcinoma | Female | >=65 | I/II | Unknown | Unknown | PD | |
| RFWD3 | SNV | Missense_Mutation | c.244N>C | p.Glu82Gln | p.E82Q | Q6PCD5 | protein_coding | deleterious_low_confidence(0.05) | probably_damaging(0.996) | TCGA-C8-A26Y-01 | Breast | breast invasive carcinoma | Female | >=65 | I/II | Unknown | Unknown | SD | |
| RFWD3 | SNV | Missense_Mutation | c.1219N>G | p.Gln407Glu | p.Q407E | Q6PCD5 | protein_coding | tolerated(0.48) | benign(0.021) | TCGA-D8-A1J9-01 | Breast | breast invasive carcinoma | Female | <65 | I/II | Unknown | Unknown | SD | |
| RFWD3 | SNV | Missense_Mutation | rs747018311 | c.1211N>T | p.Thr404Met | p.T404M | Q6PCD5 | protein_coding | tolerated(0.39) | benign(0) | TCGA-E2-A1B6-01 | Breast | breast invasive carcinoma | Female | <65 | I/II | Unspecific | Adriamycin | SD |
| RFWD3 | insertion | Frame_Shift_Ins | novel | c.178_179insACAGACAGTGCCAGGTAAATAAATATATGGATAAGTCTGTGATCAT | p.Val60AspfsTer35 | p.V60Dfs*35 | Q6PCD5 | protein_coding | TCGA-AO-A0J9-01 | Breast | breast invasive carcinoma | Female | <65 | III/IV | Chemotherapy | cyclophosphamide | PD | ||
| RFWD3 | insertion | Frame_Shift_Ins | novel | c.1227_1228insTA | p.Asn410Ter | p.N410* | Q6PCD5 | protein_coding | TCGA-BH-A0E2-01 | Breast | breast invasive carcinoma | Female | <65 | III/IV | Chemotherapy | doxorubicin | SD | ||
| RFWD3 | SNV | Missense_Mutation | novel | c.356N>T | p.Ser119Leu | p.S119L | Q6PCD5 | protein_coding | deleterious_low_confidence(0) | probably_damaging(0.994) | TCGA-C5-A1MH-01 | Cervix | cervical & endocervical cancer | Female | >=65 | III/IV | Chemotherapy | cisplatin | PD |
| RFWD3 | SNV | Missense_Mutation | novel | c.2198G>A | p.Ser733Asn | p.S733N | Q6PCD5 | protein_coding | tolerated(0.07) | benign(0.037) | TCGA-C5-A8XK-01 | Cervix | cervical & endocervical cancer | Female | <65 | I/II | Chemotherapy | cisplatin | SD |
| RFWD3 | insertion | Nonsense_Mutation | novel | c.532_533insAAGCTTCA | p.Leu178Ter | p.L178* | Q6PCD5 | protein_coding | TCGA-DS-A1OB-01 | Cervix | cervical & endocervical cancer | Female | <65 | I/II | Chemotherapy | carboplatin | PD |
| Page: 1 2 3 4 5 6 7 |
Top |
Related drugs of malignant transformation related genes |
| Identification of chemicals and drugs interact with genes involved in malignant transfromation |
| (DGIdb 4.0) |
| Entrez ID | Symbol | Category | Interaction Types | Drug Claim Name | Drug Name | PMIDs |
| Page: 1 |

Copyright 2023-Present -The University of Texas Health Science Center at Houston |