
|
|||||
|
 | |
| |
| |
| |
| |
| |
|
Gene: RAMP2 |
Gene summary for RAMP2 |
| Gene information | Species | Human | Gene symbol | RAMP2 | Gene ID | 10266 |
| Gene name | receptor activity modifying protein 2 | |
| Gene Alias | RAMP2 | |
| Cytomap | 17q21.2 | |
| Gene Type | protein-coding | GO ID | GO:0000003 | UniProtAcc | A0A024R1Z2 |
Top |
Malignant transformation analysis |
| Identification of the aberrant gene expression in precancerous and cancerous lesions by comparing the gene expression of stem-like cells in diseased tissues with normal stem cells |
| Entrez ID | Symbol | Replicates | Species | Organ | Tissue | Adj P-value | Log2FC | Malignancy |
| 10266 | RAMP2 | LZE4T | Human | Esophagus | ESCC | 5.33e-04 | 6.73e-02 | 0.0811 |
| 10266 | RAMP2 | LZE24T | Human | Esophagus | ESCC | 6.56e-11 | 4.15e-01 | 0.0596 |
| 10266 | RAMP2 | P2T-E | Human | Esophagus | ESCC | 2.42e-07 | 1.05e-01 | 0.1177 |
| 10266 | RAMP2 | P4T-E | Human | Esophagus | ESCC | 2.40e-10 | 5.41e-01 | 0.1323 |
| 10266 | RAMP2 | P8T-E | Human | Esophagus | ESCC | 7.25e-19 | 5.37e-01 | 0.0889 |
| 10266 | RAMP2 | P10T-E | Human | Esophagus | ESCC | 3.32e-09 | 2.22e-01 | 0.116 |
| 10266 | RAMP2 | P16T-E | Human | Esophagus | ESCC | 2.19e-48 | 9.42e-01 | 0.1153 |
| 10266 | RAMP2 | P20T-E | Human | Esophagus | ESCC | 3.85e-27 | 7.65e-01 | 0.1124 |
| 10266 | RAMP2 | P22T-E | Human | Esophagus | ESCC | 2.14e-36 | 5.74e-01 | 0.1236 |
| 10266 | RAMP2 | P23T-E | Human | Esophagus | ESCC | 1.80e-14 | 1.11e+00 | 0.108 |
| 10266 | RAMP2 | P24T-E | Human | Esophagus | ESCC | 5.00e-02 | 4.56e-01 | 0.1287 |
| 10266 | RAMP2 | P26T-E | Human | Esophagus | ESCC | 4.37e-37 | 6.70e-01 | 0.1276 |
| 10266 | RAMP2 | P27T-E | Human | Esophagus | ESCC | 4.91e-10 | 2.95e-01 | 0.1055 |
| 10266 | RAMP2 | P36T-E | Human | Esophagus | ESCC | 5.18e-06 | 8.26e-01 | 0.1187 |
| 10266 | RAMP2 | P38T-E | Human | Esophagus | ESCC | 1.30e-06 | 4.69e-01 | 0.127 |
| 10266 | RAMP2 | P47T-E | Human | Esophagus | ESCC | 6.33e-03 | 1.52e-01 | 0.1067 |
| 10266 | RAMP2 | P54T-E | Human | Esophagus | ESCC | 6.80e-05 | 3.30e-01 | 0.0975 |
| 10266 | RAMP2 | P56T-E | Human | Esophagus | ESCC | 1.38e-05 | 4.29e-01 | 0.1613 |
| 10266 | RAMP2 | P57T-E | Human | Esophagus | ESCC | 3.22e-02 | 1.72e-01 | 0.0926 |
| 10266 | RAMP2 | P61T-E | Human | Esophagus | ESCC | 1.64e-05 | 1.91e-01 | 0.099 |
| Page: 1 2 3 |
| Tissue | Expression Dynamics | Abbreviation |
| Esophagus | 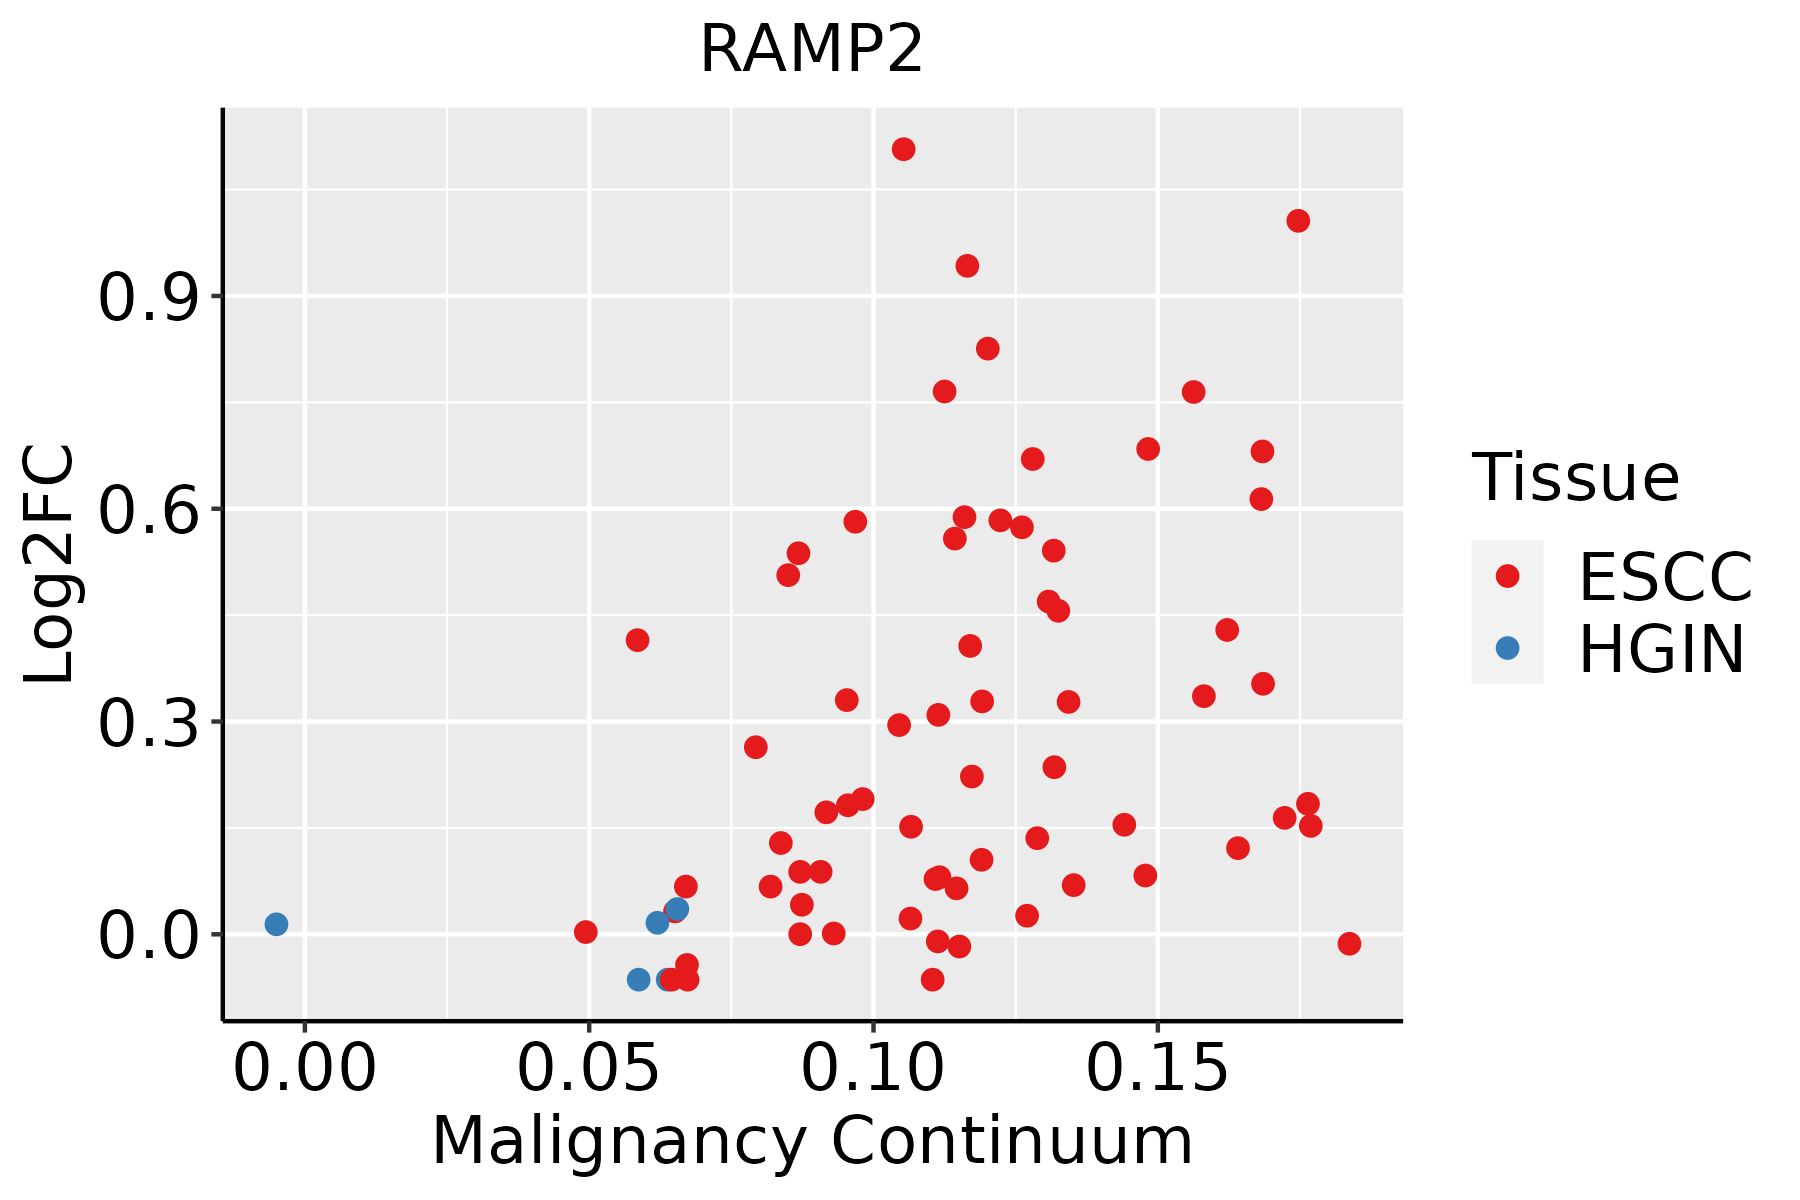 | ESCC: Esophageal squamous cell carcinoma |
| HGIN: High-grade intraepithelial neoplasias | ||
| LGIN: Low-grade intraepithelial neoplasias | ||
| Liver |  | HCC: Hepatocellular carcinoma |
| NAFLD: Non-alcoholic fatty liver disease | ||
| Oral Cavity | 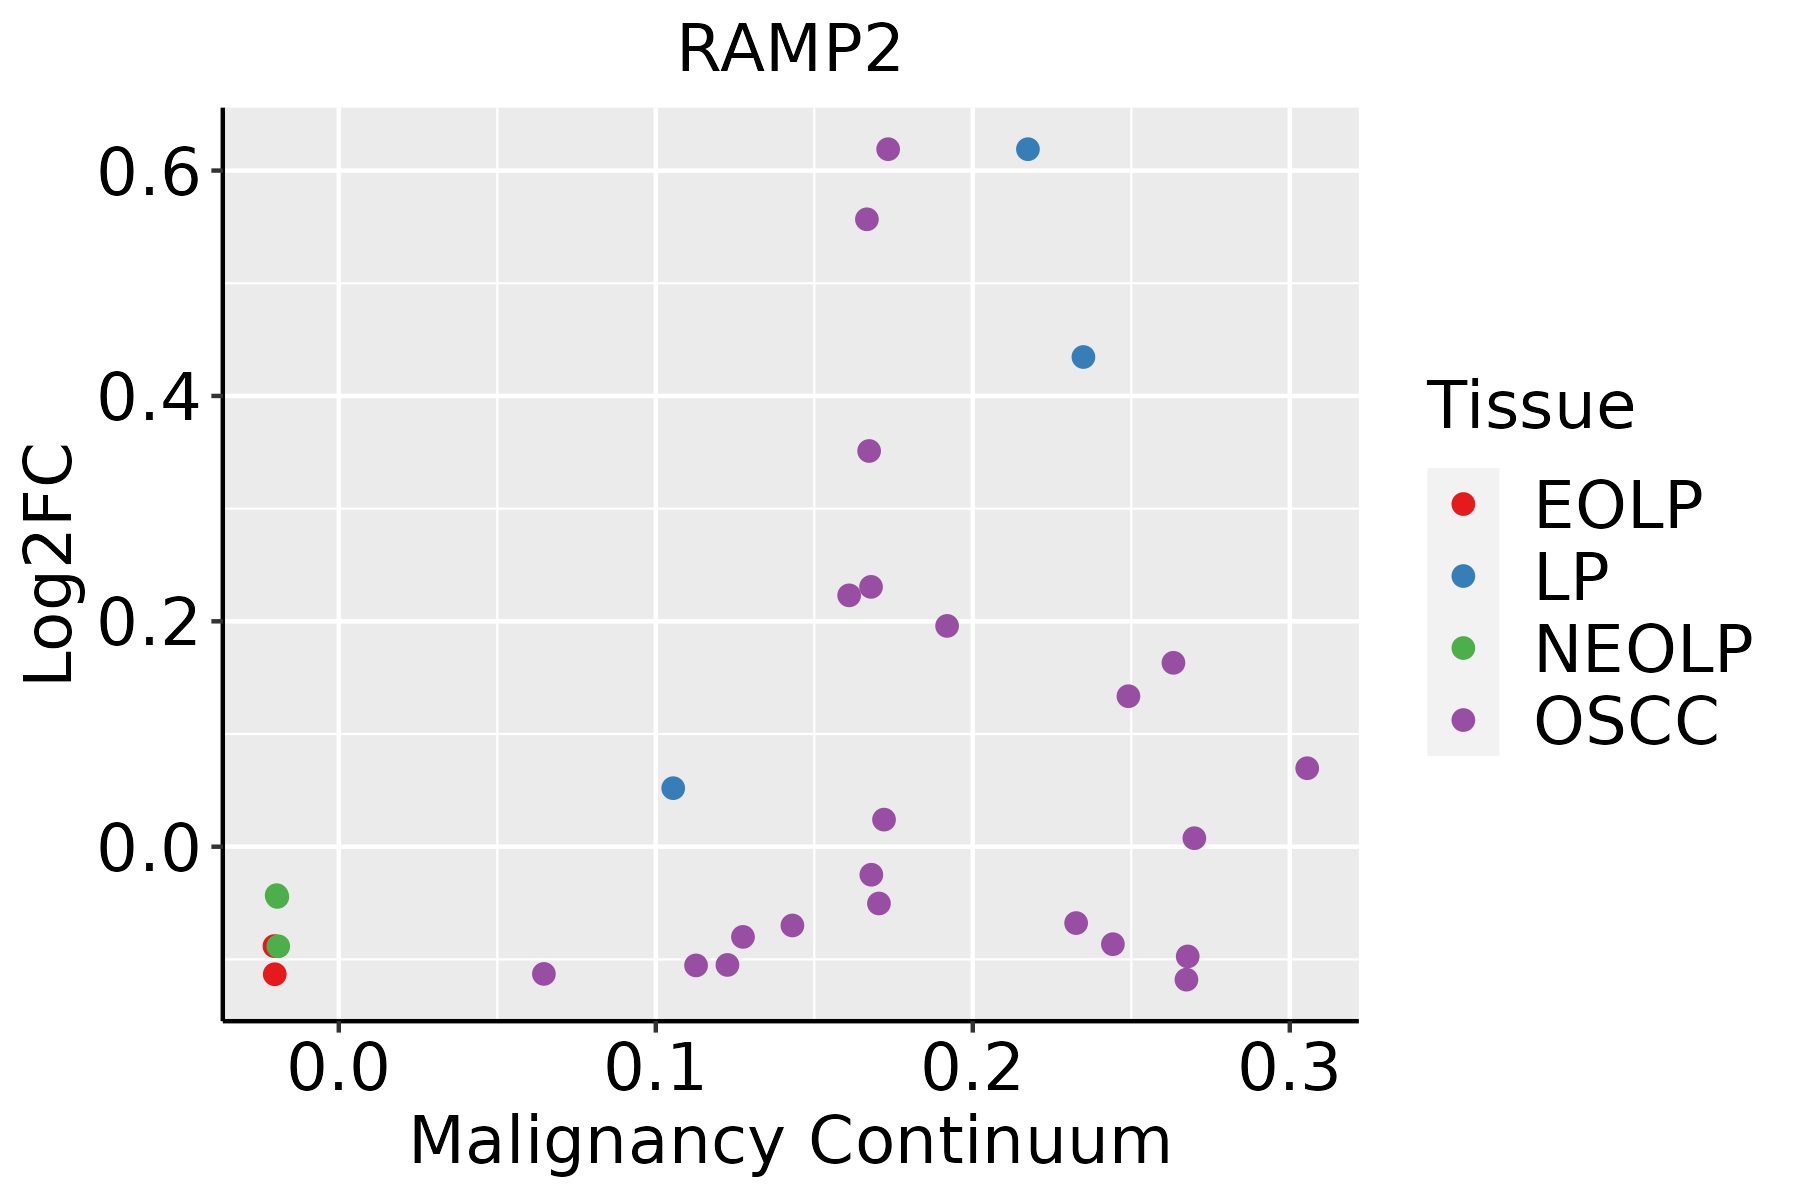 | EOLP: Erosive Oral lichen planus |
| LP: leukoplakia | ||
| NEOLP: Non-erosive oral lichen planus | ||
| OSCC: Oral squamous cell carcinoma | ||
| Thyroid | 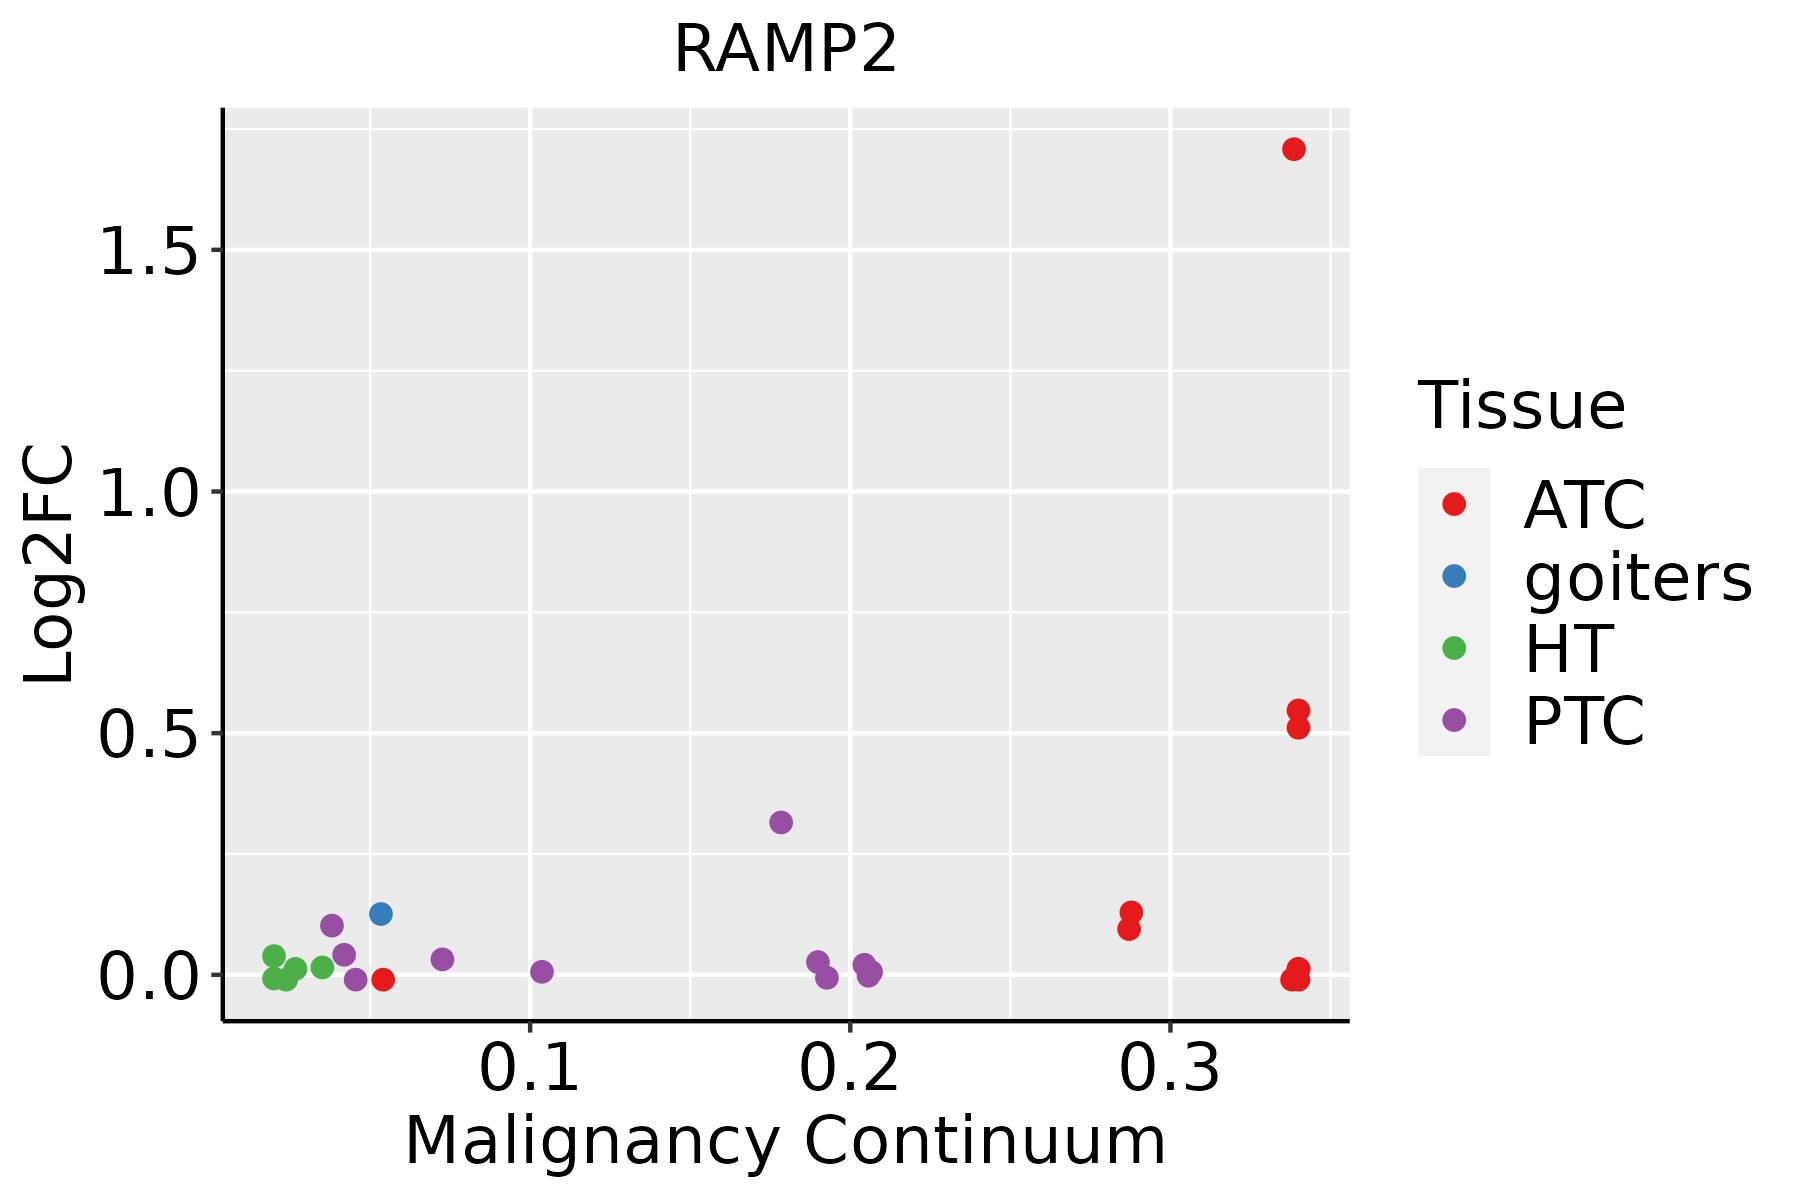 | ATC: Anaplastic thyroid cancer |
| HT: Hashimoto's thyroiditis | ||
| PTC: Papillary thyroid cancer |
| ∗log2FC in expression of this searched gene in stem-like cells from each diseased tissue sample relative to stem-like cells in normal samples in each tissue plotted against the malignancy continuum. Samples are colored based on if they are from different disease stage. |
Top |
Malignant transformation related pathway analysis |
| Find out the enriched GO biological processes and KEGG pathways involved in transition from healthy to precancer to cancer |
| Tissue | Disease Stage | Enriched GO biological Processes |
| Colorectum | AD |  |
| Colorectum | SER |  |
| Colorectum | MSS |  |
| Colorectum | MSI-H |  |
| Colorectum | FAP |  |
| ∗Top 15 enriched GO BP terms are showed in the bar plot of each disease state in each tissue. Each row represents a significant GO biological process which is colored according to the -log10(p.adjust). |
| Page: 1 2 3 4 5 6 7 8 9 |
| GO ID | Tissue | Disease Stage | Description | Gene Ratio | Bg Ratio | pvalue | p.adjust | Count |
| GO:000689821 | Liver | HCC | receptor-mediated endocytosis | 134/7958 | 244/18723 | 5.73e-05 | 5.31e-04 | 134 |
| GO:00323552 | Liver | HCC | response to estradiol | 81/7958 | 141/18723 | 2.39e-04 | 1.79e-03 | 81 |
| GO:004521622 | Liver | HCC | cell-cell junction organization | 107/7958 | 200/18723 | 1.06e-03 | 6.11e-03 | 107 |
| GO:00325701 | Liver | HCC | response to progesterone | 25/7958 | 37/18723 | 1.82e-03 | 9.38e-03 | 25 |
| GO:004329712 | Liver | HCC | apical junction assembly | 45/7958 | 78/18723 | 4.83e-03 | 2.03e-02 | 45 |
| GO:003433211 | Liver | HCC | adherens junction organization | 30/7958 | 49/18723 | 6.31e-03 | 2.57e-02 | 30 |
| GO:00075651 | Liver | HCC | female pregnancy | 99/7958 | 193/18723 | 8.24e-03 | 3.23e-02 | 99 |
| GO:01201935 | Liver | HCC | tight junction organization | 45/7958 | 80/18723 | 9.02e-03 | 3.48e-02 | 45 |
| GO:01201925 | Liver | HCC | tight junction assembly | 42/7958 | 74/18723 | 9.32e-03 | 3.57e-02 | 42 |
| GO:000704312 | Liver | HCC | cell-cell junction assembly | 76/7958 | 146/18723 | 1.23e-02 | 4.47e-02 | 76 |
| GO:005109820 | Oral cavity | OSCC | regulation of binding | 212/7305 | 363/18723 | 3.88e-14 | 2.15e-12 | 212 |
| GO:007048219 | Oral cavity | OSCC | response to oxygen levels | 200/7305 | 347/18723 | 1.17e-12 | 5.13e-11 | 200 |
| GO:007265918 | Oral cavity | OSCC | protein localization to plasma membrane | 169/7305 | 284/18723 | 1.69e-12 | 7.21e-11 | 169 |
| GO:199077816 | Oral cavity | OSCC | protein localization to cell periphery | 190/7305 | 333/18723 | 1.46e-11 | 5.13e-10 | 190 |
| GO:000166619 | Oral cavity | OSCC | response to hypoxia | 177/7305 | 307/18723 | 2.21e-11 | 7.50e-10 | 177 |
| GO:004339318 | Oral cavity | OSCC | regulation of protein binding | 121/7305 | 196/18723 | 8.92e-11 | 2.73e-09 | 121 |
| GO:003629319 | Oral cavity | OSCC | response to decreased oxygen levels | 182/7305 | 322/18723 | 1.14e-10 | 3.41e-09 | 182 |
| GO:004854520 | Oral cavity | OSCC | response to steroid hormone | 186/7305 | 339/18723 | 1.86e-09 | 4.42e-08 | 186 |
| GO:005109920 | Oral cavity | OSCC | positive regulation of binding | 105/7305 | 173/18723 | 5.88e-09 | 1.26e-07 | 105 |
| GO:190165419 | Oral cavity | OSCC | response to ketone | 114/7305 | 194/18723 | 1.82e-08 | 3.60e-07 | 114 |
| Page: 1 2 3 4 5 6 7 8 |
| Pathway ID | Tissue | Disease Stage | Description | Gene Ratio | Bg Ratio | pvalue | p.adjust | qvalue | Count |
| Page: 1 |
Top |
Cell-cell communication analysis |
| Identification of potential cell-cell interactions between two cell types and their ligand-receptor pairs for different disease states |
| Ligand | Receptor | LRpair | Pathway | Tissue | Disease Stage |
| Page: 1 |
Top |
Single-cell gene regulatory network inference analysis |
| Find out the significant the regulons (TFs) and the target genes of each regulon across cell types for different disease states |
| TF | Cell Type | Tissue | Disease Stage | Target Gene | RSS | Regulon Activity |
| ∗The dot plots of a searched regulon are shown for all cell subpopulations in each disease state of each tissue based on the regulon specific score inferred using pySCENIC and by calculating the average expression. |
| Page: 1 |
Top |
Somatic mutation of malignant transformation related genes |
| Annotation of somatic variants for genes involved in malignant transformation |
| Hugo Symbol | Variant Class | Variant Classification | dbSNP RS | HGVSc | HGVSp | HGVSp Short | SWISSPROT | BIOTYPE | SIFT | PolyPhen | Tumor Sample Barcode | Tissue | Histology | Sex | Age | Stage | Therapy Types | Drugs | Outcome |
| RAMP2 | SNV | Missense_Mutation | rs369493002 | c.170C>T | p.Thr57Met | p.T57M | O60895 | protein_coding | tolerated(0.38) | benign(0.001) | TCGA-A6-5661-01 | Colorectum | colon adenocarcinoma | Female | >=65 | I/II | Unknown | Unknown | SD |
| RAMP2 | insertion | Frame_Shift_Ins | novel | c.454_455insC | p.Ile154HisfsTer16 | p.I154Hfs*16 | O60895 | protein_coding | TCGA-AA-3713-01 | Colorectum | colon adenocarcinoma | Male | >=65 | III/IV | Chemotherapy | 5-fluorouracil | PR | ||
| RAMP2 | SNV | Missense_Mutation | novel | c.243N>T | p.Lys81Asn | p.K81N | O60895 | protein_coding | deleterious(0.03) | possibly_damaging(0.76) | TCGA-AX-A2HD-01 | Endometrium | uterine corpus endometrioid carcinoma | Female | >=65 | III/IV | Unknown | Unknown | SD |
| RAMP2 | SNV | Missense_Mutation | novel | c.427N>A | p.Glu143Lys | p.E143K | O60895 | protein_coding | deleterious(0) | probably_damaging(0.999) | TCGA-DF-A2KN-01 | Endometrium | uterine corpus endometrioid carcinoma | Female | Unknown | I/II | Unknown | Unknown | SD |
| RAMP2 | SNV | Missense_Mutation | novel | c.151C>T | p.Pro51Ser | p.P51S | O60895 | protein_coding | tolerated(0.44) | benign(0) | TCGA-EO-A22U-01 | Endometrium | uterine corpus endometrioid carcinoma | Female | >=65 | I/II | Unknown | Unknown | SD |
| RAMP2 | SNV | Missense_Mutation | novel | c.200N>G | p.Phe67Cys | p.F67C | O60895 | protein_coding | tolerated(0.18) | possibly_damaging(0.455) | TCGA-EO-A22X-01 | Endometrium | uterine corpus endometrioid carcinoma | Female | <65 | III/IV | Unspecific | Carboplatin | Complete Response |
| RAMP2 | SNV | Missense_Mutation | rs373990860 | c.238N>A | p.Glu80Lys | p.E80K | O60895 | protein_coding | tolerated(0.65) | benign(0) | TCGA-QS-A5YQ-01 | Endometrium | uterine corpus endometrioid carcinoma | Female | <65 | III/IV | Chemotherapy | cisplatin | CR |
| RAMP2 | SNV | Missense_Mutation | novel | c.103C>A | p.Leu35Met | p.L35M | O60895 | protein_coding | deleterious(0.03) | probably_damaging(0.919) | TCGA-55-6979-01 | Lung | lung adenocarcinoma | Female | <65 | I/II | Chemotherapy | carboplatin | PD |
| RAMP2 | SNV | Missense_Mutation | c.170N>A | p.Thr57Lys | p.T57K | O60895 | protein_coding | tolerated(1) | benign(0.001) | TCGA-55-7907-01 | Lung | lung adenocarcinoma | Male | >=65 | I/II | Unknown | Unknown | PD | |
| RAMP2 | SNV | Missense_Mutation | novel | c.271N>G | p.Arg91Gly | p.R91G | O60895 | protein_coding | deleterious(0.01) | possibly_damaging(0.666) | TCGA-55-8089-01 | Lung | lung adenocarcinoma | Male | <65 | I/II | Unknown | Unknown | SD |
| Page: 1 2 |
Top |
Related drugs of malignant transformation related genes |
| Identification of chemicals and drugs interact with genes involved in malignant transfromation |
| (DGIdb 4.0) |
| Entrez ID | Symbol | Category | Interaction Types | Drug Claim Name | Drug Name | PMIDs |
| 10266 | RAMP2 | DRUGGABLE GENOME, CELL SURFACE | agonist | CHEMBL3833353 | PRAMLINTIDE ACETATE | |
| 10266 | RAMP2 | DRUGGABLE GENOME, CELL SURFACE | PRAMLINTIDE | PRAMLINTIDE | ||
| 10266 | RAMP2 | DRUGGABLE GENOME, CELL SURFACE | PRAMLINTIDE | PRAMLINTIDE |
| Page: 1 |

Copyright 2023-Present -The University of Texas Health Science Center at Houston |