| Tissue | Expression Dynamics | Abbreviation |
| Cervix | 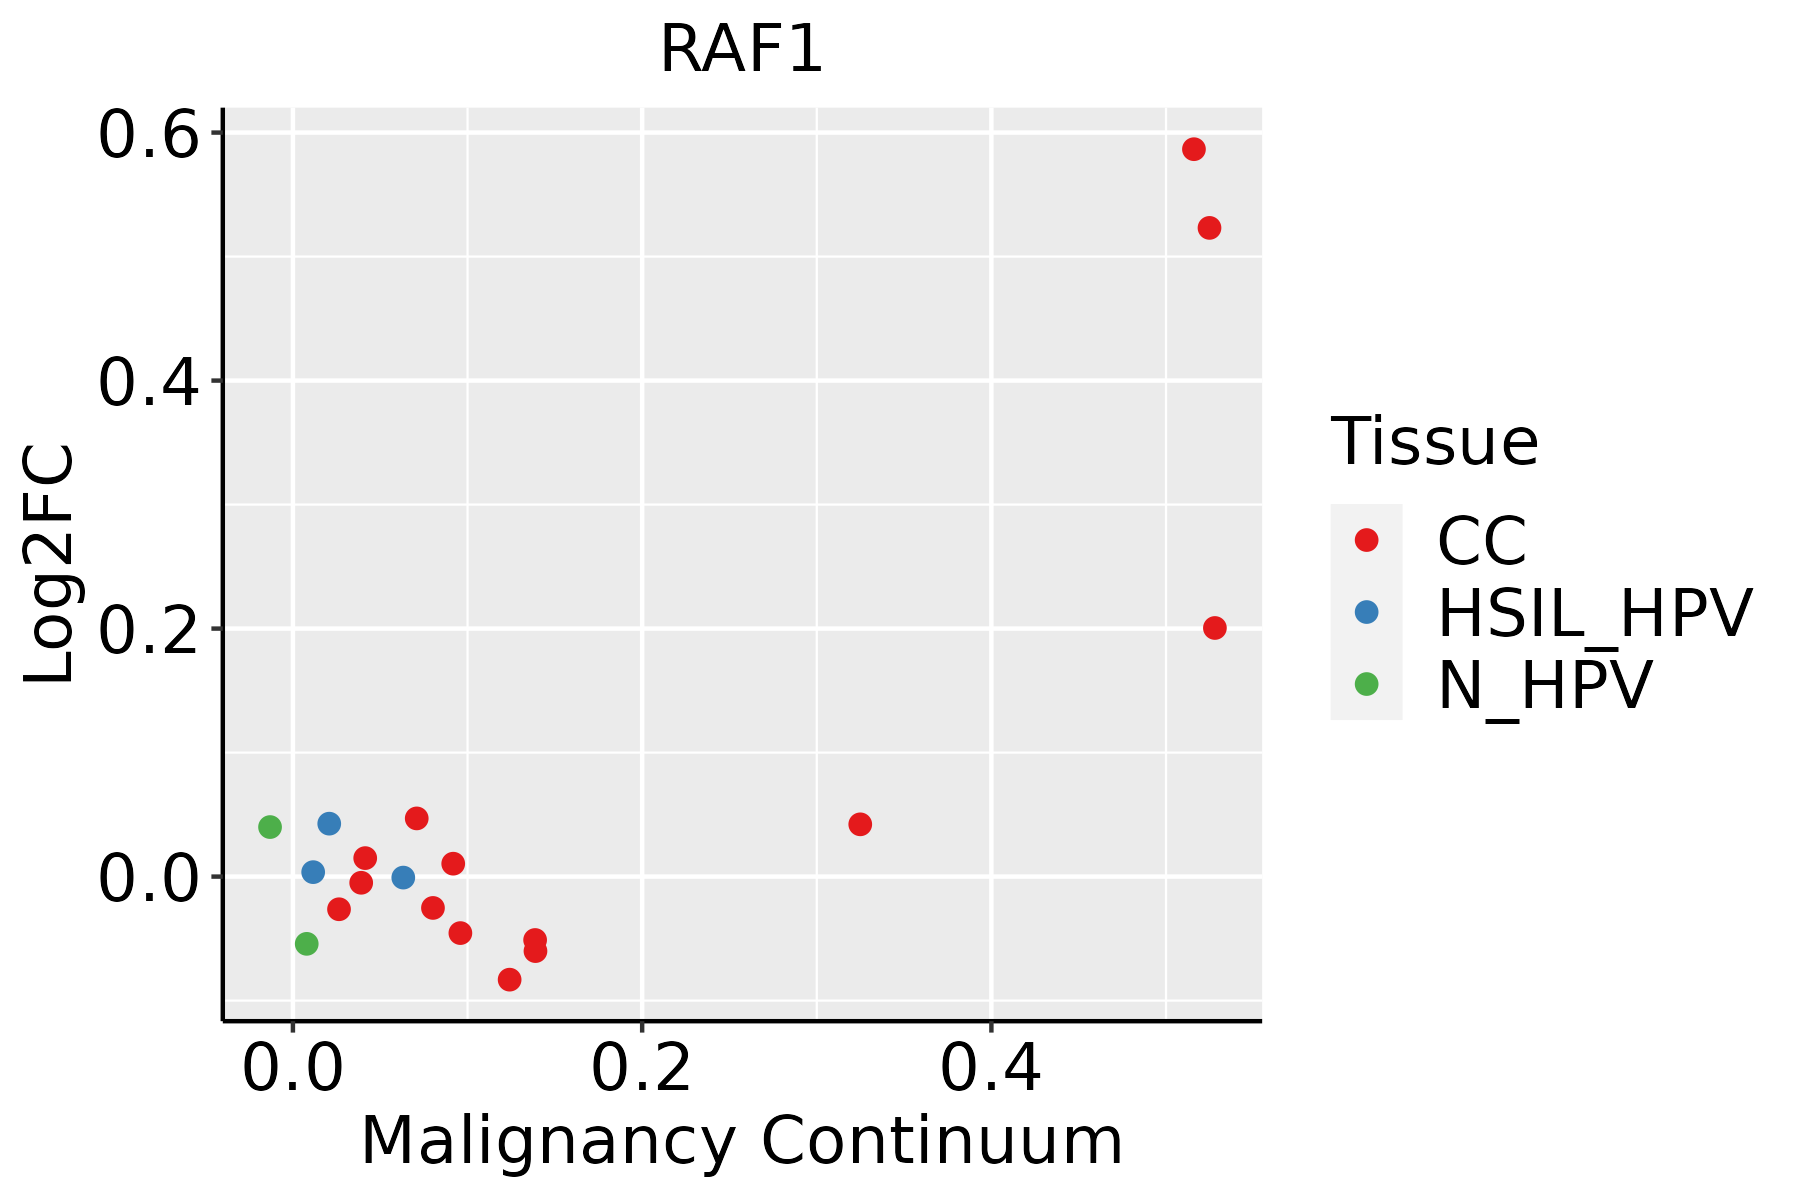 | CC: Cervix cancer |
| HSIL_HPV: HPV-infected high-grade squamous intraepithelial lesions |
| N_HPV: HPV-infected normal cervix |
| Esophagus | 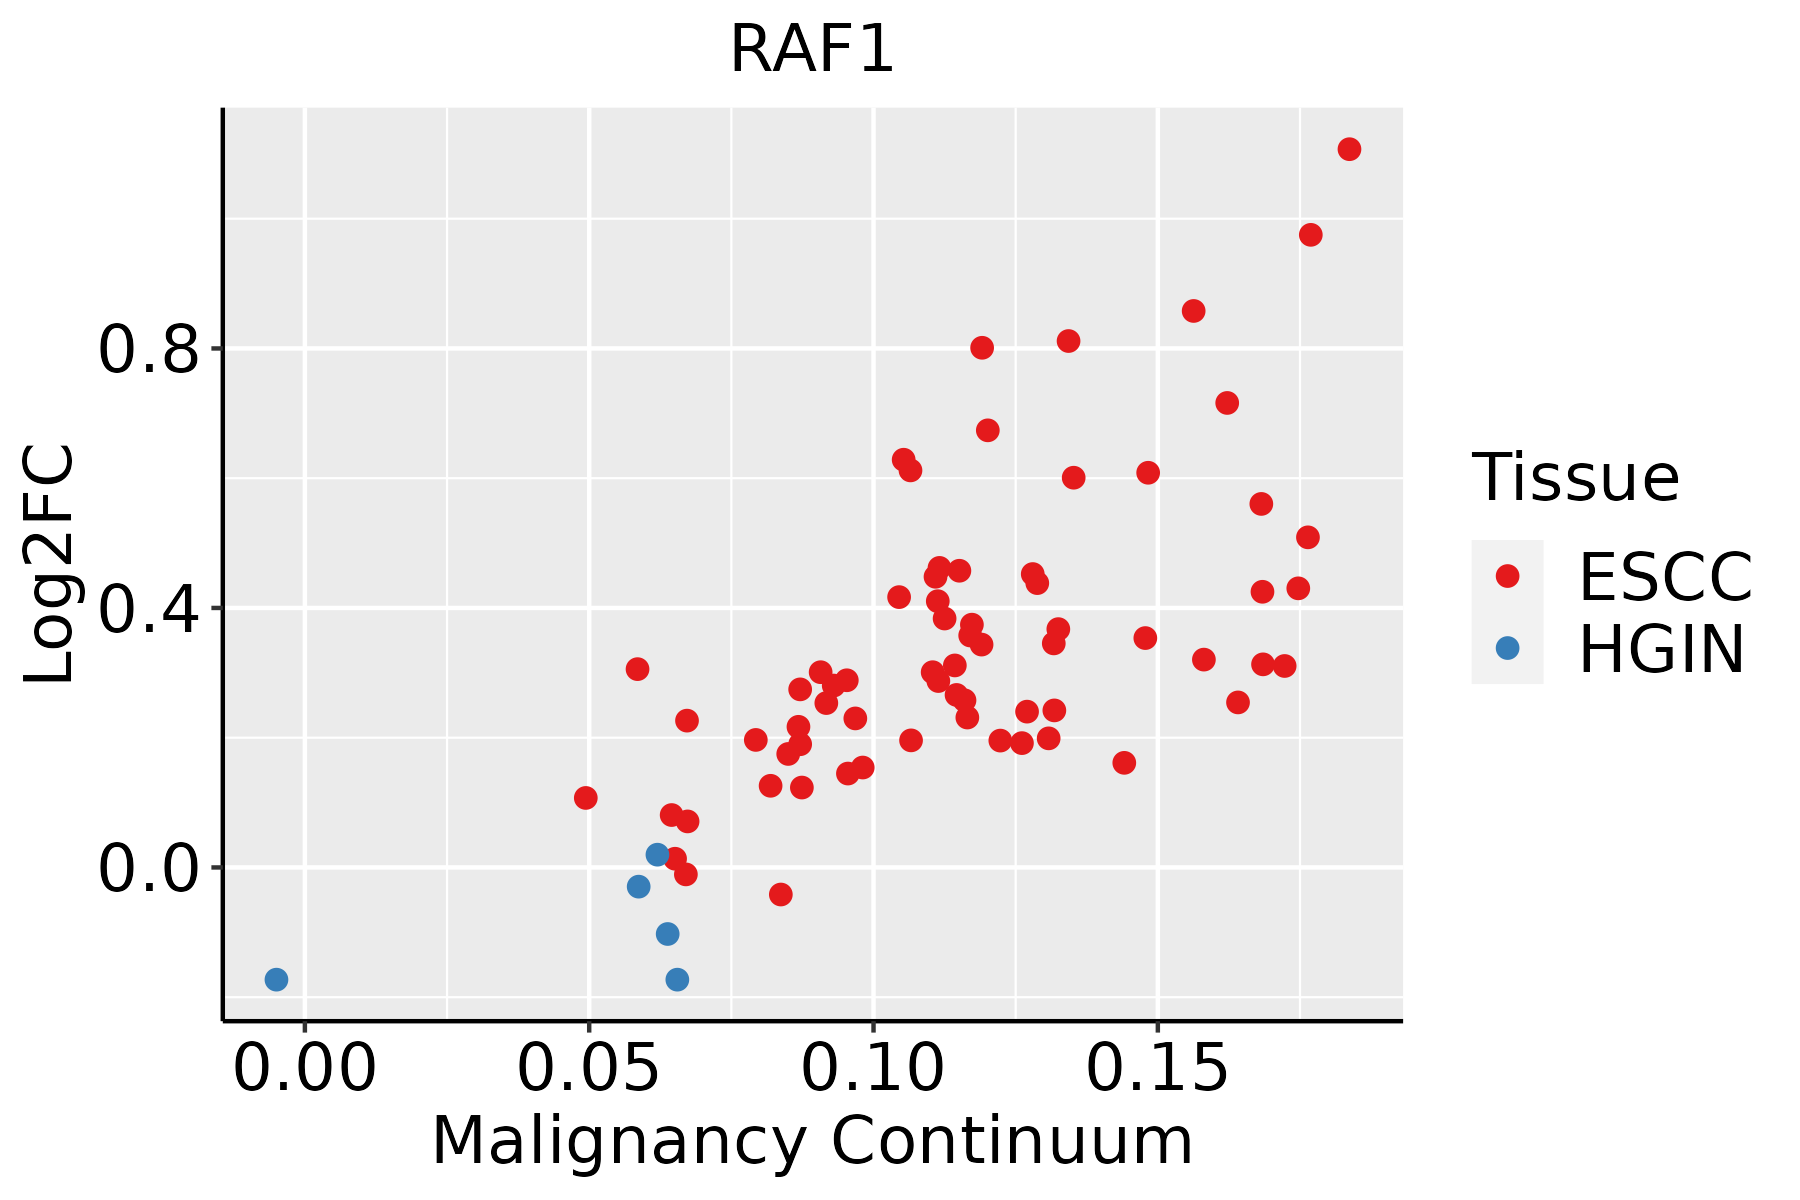 | ESCC: Esophageal squamous cell carcinoma |
| HGIN: High-grade intraepithelial neoplasias |
| LGIN: Low-grade intraepithelial neoplasias |
| Liver | 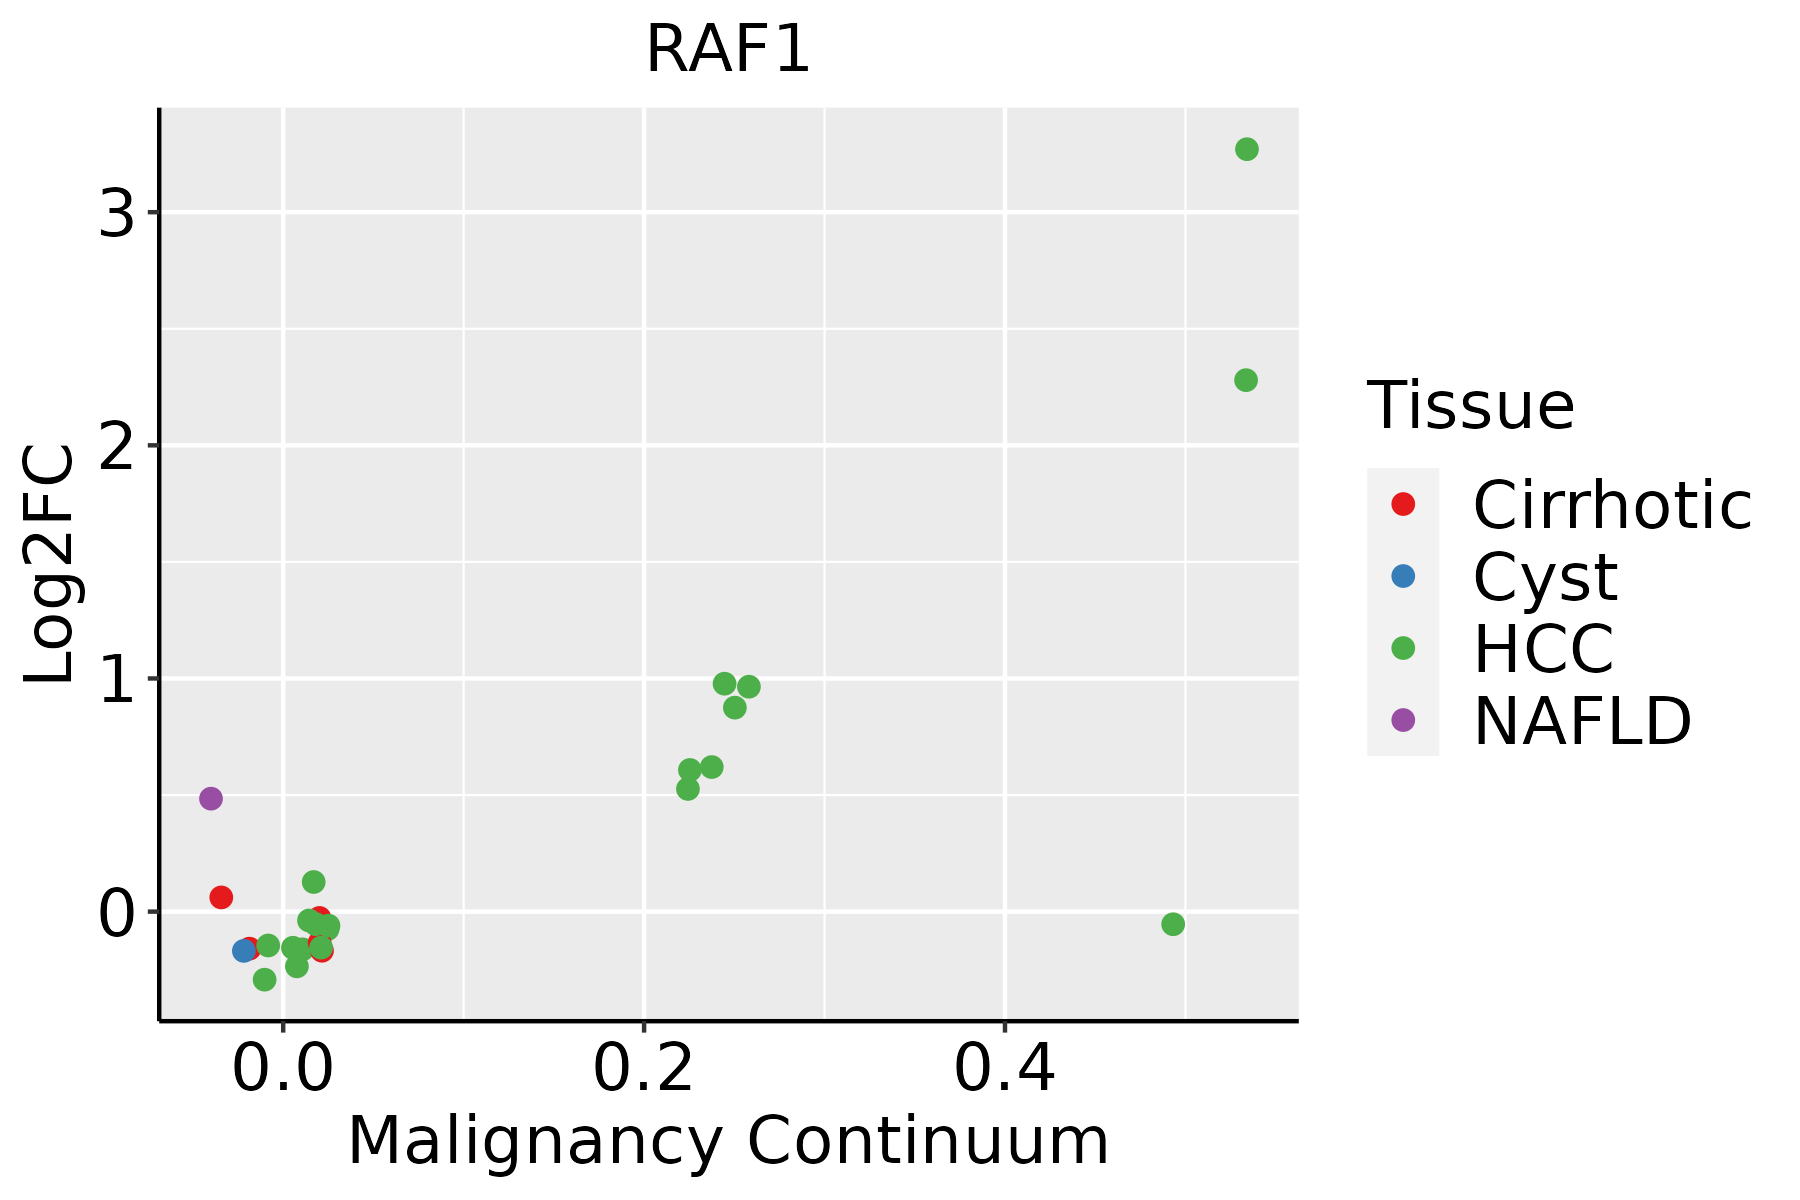 | HCC: Hepatocellular carcinoma |
| NAFLD: Non-alcoholic fatty liver disease |
| Oral Cavity |  | EOLP: Erosive Oral lichen planus |
| LP: leukoplakia |
| NEOLP: Non-erosive oral lichen planus |
| OSCC: Oral squamous cell carcinoma |
| Skin |  | AK: Actinic keratosis |
| cSCC: Cutaneous squamous cell carcinoma |
| SCCIS:squamous cell carcinoma in situ |
| Thyroid |  | ATC: Anaplastic thyroid cancer |
| HT: Hashimoto's thyroiditis |
| PTC: Papillary thyroid cancer |
| GO ID | Tissue | Disease Stage | Description | Gene Ratio | Bg Ratio | pvalue | p.adjust | Count |
| GO:0043281111 | Esophagus | ESCC | regulation of cysteine-type endopeptidase activity involved in apoptotic process | 143/8552 | 209/18723 | 2.12e-11 | 7.31e-10 | 143 |
| GO:000724919 | Esophagus | ESCC | I-kappaB kinase/NF-kappaB signaling | 183/8552 | 281/18723 | 3.02e-11 | 1.01e-09 | 183 |
| GO:0070482111 | Esophagus | ESCC | response to oxygen levels | 218/8552 | 347/18723 | 6.91e-11 | 2.17e-09 | 218 |
| GO:0052547111 | Esophagus | ESCC | regulation of peptidase activity | 275/8552 | 461/18723 | 7.54e-10 | 1.88e-08 | 275 |
| GO:0036293111 | Esophagus | ESCC | response to decreased oxygen levels | 201/8552 | 322/18723 | 8.37e-10 | 2.04e-08 | 201 |
| GO:0001666111 | Esophagus | ESCC | response to hypoxia | 192/8552 | 307/18723 | 1.59e-09 | 3.69e-08 | 192 |
| GO:0052548111 | Esophagus | ESCC | regulation of endopeptidase activity | 253/8552 | 432/18723 | 3.68e-08 | 6.78e-07 | 253 |
| GO:003109818 | Esophagus | ESCC | stress-activated protein kinase signaling cascade | 154/8552 | 247/18723 | 8.53e-08 | 1.44e-06 | 154 |
| GO:000726510 | Esophagus | ESCC | Ras protein signal transduction | 201/8552 | 337/18723 | 1.44e-07 | 2.30e-06 | 201 |
| GO:2000117110 | Esophagus | ESCC | negative regulation of cysteine-type endopeptidase activity | 63/8552 | 86/18723 | 1.84e-07 | 2.88e-06 | 63 |
| GO:0043154110 | Esophagus | ESCC | negative regulation of cysteine-type endopeptidase activity involved in apoptotic process | 58/8552 | 78/18723 | 2.38e-07 | 3.61e-06 | 58 |
| GO:2001237111 | Esophagus | ESCC | negative regulation of extrinsic apoptotic signaling pathway | 69/8552 | 97/18723 | 3.23e-07 | 4.55e-06 | 69 |
| GO:009872714 | Esophagus | ESCC | maintenance of cell number | 90/8552 | 134/18723 | 3.94e-07 | 5.43e-06 | 90 |
| GO:004206027 | Esophagus | ESCC | wound healing | 243/8552 | 422/18723 | 4.62e-07 | 6.25e-06 | 243 |
| GO:007053413 | Esophagus | ESCC | protein K63-linked ubiquitination | 44/8552 | 56/18723 | 4.84e-07 | 6.50e-06 | 44 |
| GO:00510908 | Esophagus | ESCC | regulation of DNA-binding transcription factor activity | 252/8552 | 440/18723 | 5.22e-07 | 6.97e-06 | 252 |
| GO:001982714 | Esophagus | ESCC | stem cell population maintenance | 88/8552 | 131/18723 | 5.23e-07 | 6.97e-06 | 88 |
| GO:005140318 | Esophagus | ESCC | stress-activated MAPK cascade | 147/8552 | 239/18723 | 5.43e-07 | 7.18e-06 | 147 |
| GO:000862519 | Esophagus | ESCC | extrinsic apoptotic signaling pathway via death domain receptors | 59/8552 | 82/18723 | 1.23e-06 | 1.52e-05 | 59 |
| GO:00182099 | Esophagus | ESCC | peptidyl-serine modification | 196/8552 | 338/18723 | 3.07e-06 | 3.47e-05 | 196 |
| Pathway ID | Tissue | Disease Stage | Description | Gene Ratio | Bg Ratio | pvalue | p.adjust | qvalue | Count |
| hsa0520820 | Cervix | CC | Chemical carcinogenesis - reactive oxygen species | 92/1267 | 223/8465 | 4.71e-22 | 5.09e-20 | 3.01e-20 | 92 |
| hsa0501018 | Cervix | CC | Alzheimer disease | 113/1267 | 384/8465 | 9.67e-14 | 3.92e-12 | 2.32e-12 | 113 |
| hsa0502218 | Cervix | CC | Pathways of neurodegeneration - multiple diseases | 128/1267 | 476/8465 | 2.87e-12 | 9.29e-11 | 5.50e-11 | 128 |
| hsa0513220 | Cervix | CC | Salmonella infection | 74/1267 | 249/8465 | 1.33e-09 | 2.54e-08 | 1.50e-08 | 74 |
| hsa0516720 | Cervix | CC | Kaposi sarcoma-associated herpesvirus infection | 60/1267 | 194/8465 | 9.74e-09 | 1.58e-07 | 9.33e-08 | 60 |
| hsa0516318 | Cervix | CC | Human cytomegalovirus infection | 65/1267 | 225/8465 | 4.59e-08 | 6.47e-07 | 3.83e-07 | 65 |
| hsa0520516 | Cervix | CC | Proteoglycans in cancer | 60/1267 | 205/8465 | 9.13e-08 | 1.18e-06 | 7.00e-07 | 60 |
| hsa0421810 | Cervix | CC | Cellular senescence | 49/1267 | 156/8465 | 1.30e-07 | 1.63e-06 | 9.61e-07 | 49 |
| hsa0451010 | Cervix | CC | Focal adhesion | 59/1267 | 203/8465 | 1.53e-07 | 1.84e-06 | 1.09e-06 | 59 |
| hsa0481016 | Cervix | CC | Regulation of actin cytoskeleton | 64/1267 | 229/8465 | 2.24e-07 | 2.59e-06 | 1.53e-06 | 64 |
| hsa0491520 | Cervix | CC | Estrogen signaling pathway | 44/1267 | 138/8465 | 3.55e-07 | 3.97e-06 | 2.35e-06 | 44 |
| hsa0401512 | Cervix | CC | Rap1 signaling pathway | 56/1267 | 210/8465 | 6.23e-06 | 5.61e-05 | 3.32e-05 | 56 |
| hsa0466612 | Cervix | CC | Fc gamma R-mediated phagocytosis | 31/1267 | 97/8465 | 1.78e-05 | 1.42e-04 | 8.40e-05 | 31 |
| hsa0517016 | Cervix | CC | Human immunodeficiency virus 1 infection | 55/1267 | 212/8465 | 1.80e-05 | 1.42e-04 | 8.40e-05 | 55 |
| hsa0401210 | Cervix | CC | ErbB signaling pathway | 28/1267 | 85/8465 | 2.40e-05 | 1.82e-04 | 1.08e-04 | 28 |
| hsa0407110 | Cervix | CC | Sphingolipid signaling pathway | 35/1267 | 121/8465 | 5.70e-05 | 3.93e-04 | 2.32e-04 | 35 |
| hsa043609 | Cervix | CC | Axon guidance | 47/1267 | 182/8465 | 8.13e-05 | 5.38e-04 | 3.18e-04 | 47 |
| hsa0521010 | Cervix | CC | Colorectal cancer | 27/1267 | 86/8465 | 8.60e-05 | 5.57e-04 | 3.30e-04 | 27 |
| hsa052197 | Cervix | CC | Bladder cancer | 16/1267 | 41/8465 | 1.45e-04 | 9.05e-04 | 5.35e-04 | 16 |
| hsa052148 | Cervix | CC | Glioma | 24/1267 | 75/8465 | 1.51e-04 | 9.20e-04 | 5.44e-04 | 24 |
| Hugo Symbol | Variant Class | Variant Classification | dbSNP RS | HGVSc | HGVSp | HGVSp Short | SWISSPROT | BIOTYPE | SIFT | PolyPhen | Tumor Sample Barcode | Tissue | Histology | Sex | Age | Stage | Therapy Types | Drugs | Outcome |
| RAF1 | SNV | Missense_Mutation | | c.677T>A | p.Val226Asp | p.V226D | P04049 | protein_coding | tolerated(0.59) | benign(0) | TCGA-A8-A09Z-01 | Breast | breast invasive carcinoma | Female | >=65 | I/II | Unknown | Unknown | SD |
| RAF1 | SNV | Missense_Mutation | rs730881004 | c.1814N>T | p.Ser605Phe | p.S605F | P04049 | protein_coding | deleterious(0) | probably_damaging(0.986) | TCGA-AC-A3W5-01 | Breast | breast invasive carcinoma | Female | >=65 | I/II | Chemotherapy | docetaxel | CR |
| RAF1 | SNV | Missense_Mutation | | c.364N>G | p.Ile122Val | p.I122V | P04049 | protein_coding | tolerated(0.3) | benign(0.001) | TCGA-BH-A18S-01 | Breast | breast invasive carcinoma | Female | >=65 | I/II | Unknown | Unknown | SD |
| RAF1 | SNV | Missense_Mutation | | c.1819N>C | p.Glu607Gln | p.E607Q | P04049 | protein_coding | deleterious(0.02) | probably_damaging(0.949) | TCGA-GM-A2DO-01 | Breast | breast invasive carcinoma | Female | <65 | I/II | Hormone Therapy | tamoxiphen | CR |
| RAF1 | SNV | Missense_Mutation | novel | c.1060N>T | p.Arg354Trp | p.R354W | P04049 | protein_coding | deleterious(0) | probably_damaging(0.982) | TCGA-OL-A5RW-01 | Breast | breast invasive carcinoma | Female | <65 | I/II | Chemotherapy | adriamycin | CR |
| RAF1 | insertion | Nonsense_Mutation | novel | c.1576_1577insAGGCTCAGGGCTGCTAGAATGTGATTAAAGC | p.Ser526LysfsTer6 | p.S526Kfs*6 | P04049 | protein_coding | | | TCGA-A2-A0D1-01 | Breast | breast invasive carcinoma | Female | >=65 | I/II | Chemotherapy | taxotere | SD |
| RAF1 | insertion | In_Frame_Ins | novel | c.1724_1725insAAAGCAGGGGCCCAGCCCCAGCTGTTG | p.Lys575_Asn576insLysGlnGlyProSerProSerCysTrp | p.K575_N576insKQGPSPSCW | P04049 | protein_coding | | | TCGA-A8-A08H-01 | Breast | breast invasive carcinoma | Female | >=65 | I/II | Unknown | Unknown | SD |
| RAF1 | insertion | Frame_Shift_Ins | novel | c.296_297insTGTTGAAGTGCAAATCTTTGAAG | p.Arg100ValfsTer21 | p.R100Vfs*21 | P04049 | protein_coding | | | TCGA-AO-A0JB-01 | Breast | breast invasive carcinoma | Female | <65 | III/IV | Chemotherapy | cyclophosphamide | SD |
| RAF1 | insertion | In_Frame_Ins | novel | c.1697_1698insTTTTAAAGTAAT | p.Ala566_Ser567insPheLysValIle | p.A566_S567insFKVI | P04049 | protein_coding | | | TCGA-BH-A0BA-01 | Breast | breast invasive carcinoma | Female | <65 | III/IV | Chemotherapy | cytoxan | SD |
| RAF1 | insertion | Frame_Shift_Ins | novel | c.1696_1697insTTACCTC | p.Ala566ValfsTer8 | p.A566Vfs*8 | P04049 | protein_coding | | | TCGA-BH-A0BA-01 | Breast | breast invasive carcinoma | Female | <65 | III/IV | Chemotherapy | cytoxan | SD |
| Entrez ID | Symbol | Category | Interaction Types | Drug Claim Name | Drug Name | PMIDs |
| 5894 | RAF1 | DRUGGABLE GENOME, KINASE, ENZYME, SERINE THREONINE KINASE, CLINICALLY ACTIONABLE | | SORAFENIB | SORAFENIB | |
| 5894 | RAF1 | DRUGGABLE GENOME, KINASE, ENZYME, SERINE THREONINE KINASE, CLINICALLY ACTIONABLE | | sorafenib | SORAFENIB | 20124951,28362716 |
| 5894 | RAF1 | DRUGGABLE GENOME, KINASE, ENZYME, SERINE THREONINE KINASE, CLINICALLY ACTIONABLE | inhibitor | REGORAFENIB | REGORAFENIB | |
| 5894 | RAF1 | DRUGGABLE GENOME, KINASE, ENZYME, SERINE THREONINE KINASE, CLINICALLY ACTIONABLE | inhibitor | 404859105 | | |
| 5894 | RAF1 | DRUGGABLE GENOME, KINASE, ENZYME, SERINE THREONINE KINASE, CLINICALLY ACTIONABLE | | TRAMETINIB | TRAMETINIB | 30835257 |
| 5894 | RAF1 | DRUGGABLE GENOME, KINASE, ENZYME, SERINE THREONINE KINASE, CLINICALLY ACTIONABLE | inhibitor | CHEMBL3545296 | ARQ-736 | |
| 5894 | RAF1 | DRUGGABLE GENOME, KINASE, ENZYME, SERINE THREONINE KINASE, CLINICALLY ACTIONABLE | inhibitor | CHEMBL1200485 | SORAFENIB TOSYLATE | |
| 5894 | RAF1 | DRUGGABLE GENOME, KINASE, ENZYME, SERINE THREONINE KINASE, CLINICALLY ACTIONABLE | inhibitor | SORAFENIB | SORAFENIB | |
| 5894 | RAF1 | DRUGGABLE GENOME, KINASE, ENZYME, SERINE THREONINE KINASE, CLINICALLY ACTIONABLE | inhibitor | 328083491 | SB590885 | |
| 5894 | RAF1 | DRUGGABLE GENOME, KINASE, ENZYME, SERINE THREONINE KINASE, CLINICALLY ACTIONABLE | | XL281 | | |


