
|
|||||
|
 | |
| |
| |
| |
| |
| |
|
Gene: RAB29 |
Gene summary for RAB29 |
| Gene information | Species | Human | Gene symbol | RAB29 | Gene ID | 8934 |
| Gene name | RAB29, member RAS oncogene family | |
| Gene Alias | RAB7L | |
| Cytomap | 1q32.1 | |
| Gene Type | protein-coding | GO ID | GO:0001775 | UniProtAcc | B2R7I9 |
Top |
Malignant transformation analysis |
| Identification of the aberrant gene expression in precancerous and cancerous lesions by comparing the gene expression of stem-like cells in diseased tissues with normal stem cells |
| Entrez ID | Symbol | Replicates | Species | Organ | Tissue | Adj P-value | Log2FC | Malignancy |
| 8934 | RAB29 | LZE4T | Human | Esophagus | ESCC | 2.76e-10 | 2.16e-01 | 0.0811 |
| 8934 | RAB29 | LZE7T | Human | Esophagus | ESCC | 7.42e-03 | 1.40e-01 | 0.0667 |
| 8934 | RAB29 | LZE8T | Human | Esophagus | ESCC | 3.30e-02 | 1.16e-01 | 0.067 |
| 8934 | RAB29 | LZE24T | Human | Esophagus | ESCC | 2.04e-13 | 3.77e-01 | 0.0596 |
| 8934 | RAB29 | LZE6T | Human | Esophagus | ESCC | 1.13e-04 | 2.37e-01 | 0.0845 |
| 8934 | RAB29 | P2T-E | Human | Esophagus | ESCC | 1.39e-08 | 1.41e-01 | 0.1177 |
| 8934 | RAB29 | P4T-E | Human | Esophagus | ESCC | 3.48e-21 | 4.08e-01 | 0.1323 |
| 8934 | RAB29 | P8T-E | Human | Esophagus | ESCC | 6.71e-13 | 1.38e-01 | 0.0889 |
| 8934 | RAB29 | P9T-E | Human | Esophagus | ESCC | 2.47e-09 | 1.92e-01 | 0.1131 |
| 8934 | RAB29 | P10T-E | Human | Esophagus | ESCC | 3.76e-11 | 3.00e-01 | 0.116 |
| 8934 | RAB29 | P11T-E | Human | Esophagus | ESCC | 3.97e-09 | 3.29e-01 | 0.1426 |
| 8934 | RAB29 | P12T-E | Human | Esophagus | ESCC | 1.35e-13 | 1.80e-01 | 0.1122 |
| 8934 | RAB29 | P15T-E | Human | Esophagus | ESCC | 1.15e-20 | 3.37e-01 | 0.1149 |
| 8934 | RAB29 | P16T-E | Human | Esophagus | ESCC | 2.87e-12 | 3.93e-01 | 0.1153 |
| 8934 | RAB29 | P19T-E | Human | Esophagus | ESCC | 4.82e-05 | 6.94e-01 | 0.1662 |
| 8934 | RAB29 | P20T-E | Human | Esophagus | ESCC | 5.88e-03 | 1.29e-01 | 0.1124 |
| 8934 | RAB29 | P21T-E | Human | Esophagus | ESCC | 2.36e-18 | 3.68e-01 | 0.1617 |
| 8934 | RAB29 | P22T-E | Human | Esophagus | ESCC | 3.55e-20 | 3.02e-01 | 0.1236 |
| 8934 | RAB29 | P23T-E | Human | Esophagus | ESCC | 2.01e-17 | 4.41e-01 | 0.108 |
| 8934 | RAB29 | P24T-E | Human | Esophagus | ESCC | 3.85e-04 | 1.69e-01 | 0.1287 |
| Page: 1 2 3 4 |
| Tissue | Expression Dynamics | Abbreviation |
| Esophagus |  | ESCC: Esophageal squamous cell carcinoma |
| HGIN: High-grade intraepithelial neoplasias | ||
| LGIN: Low-grade intraepithelial neoplasias | ||
| Liver | 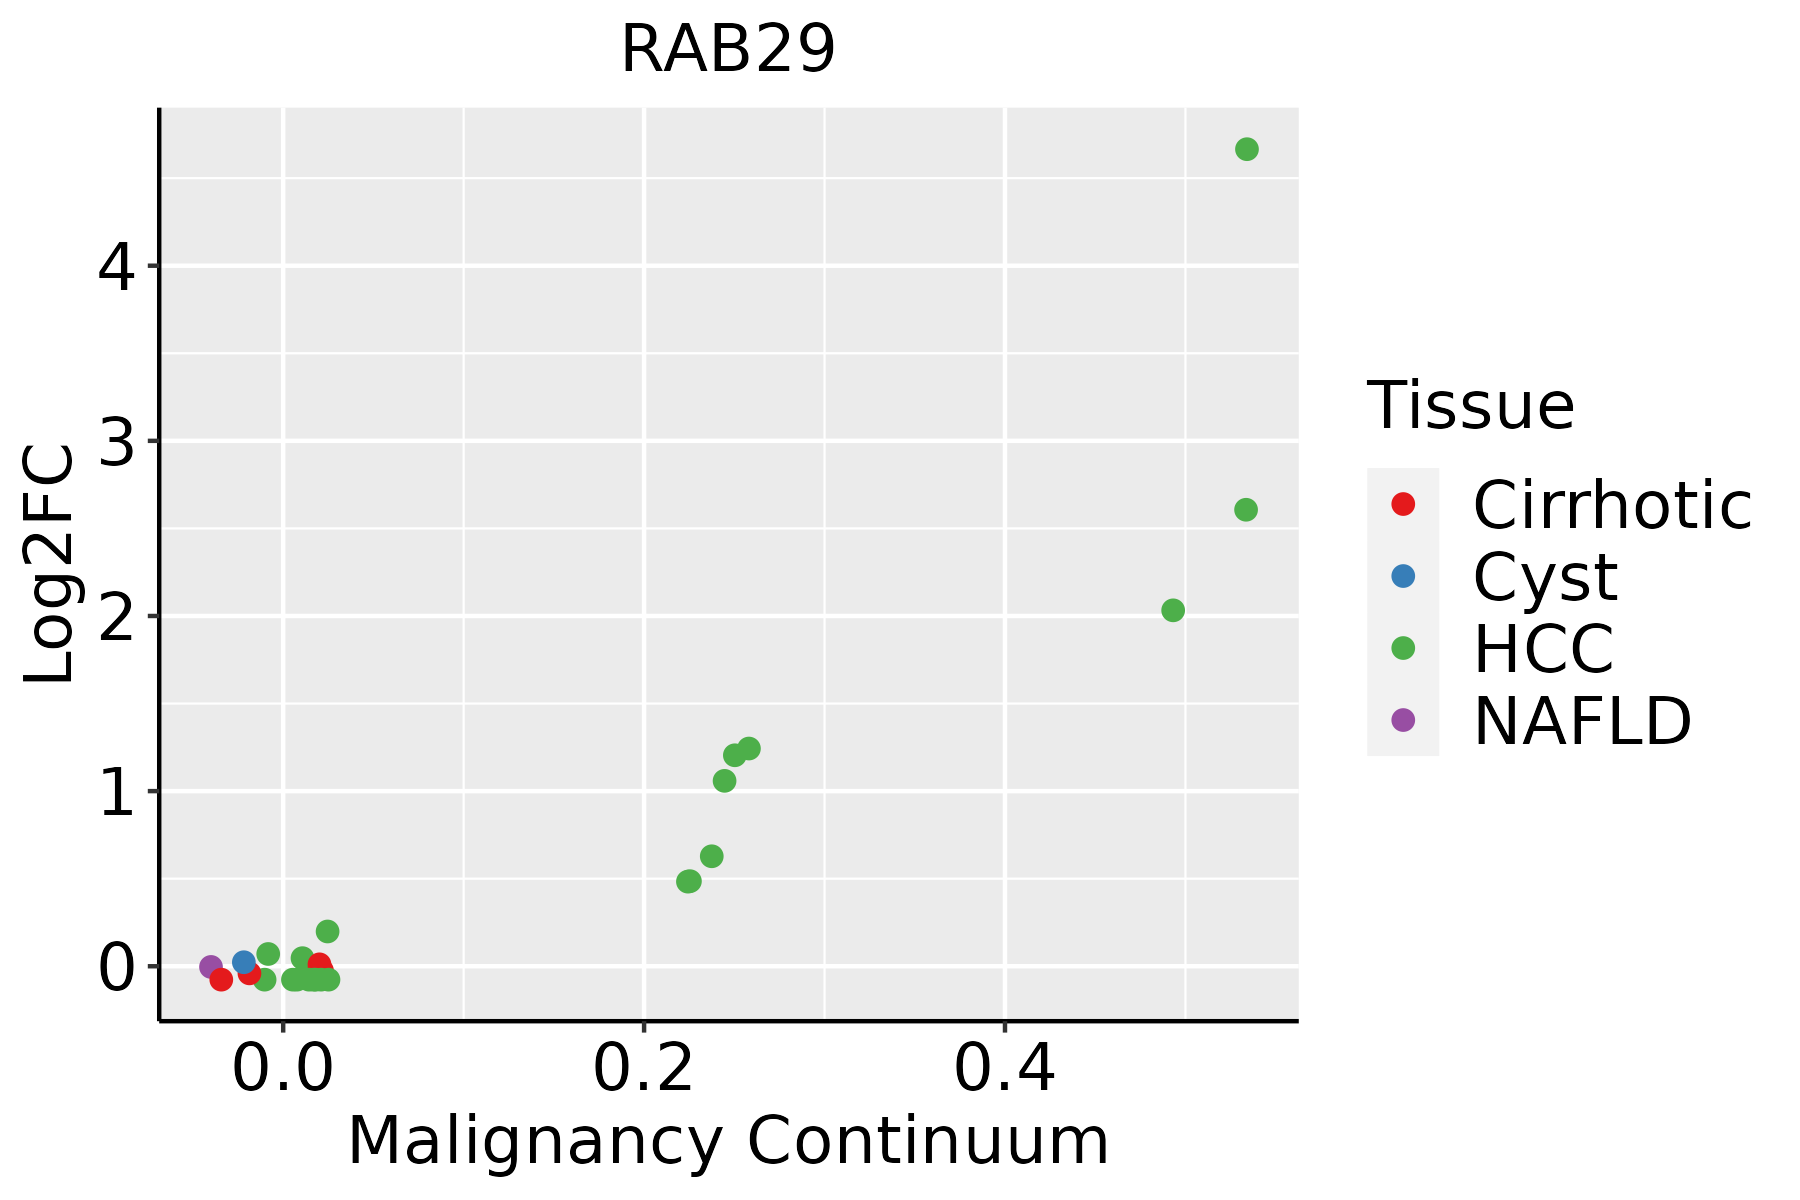 | HCC: Hepatocellular carcinoma |
| NAFLD: Non-alcoholic fatty liver disease | ||
| Oral Cavity | 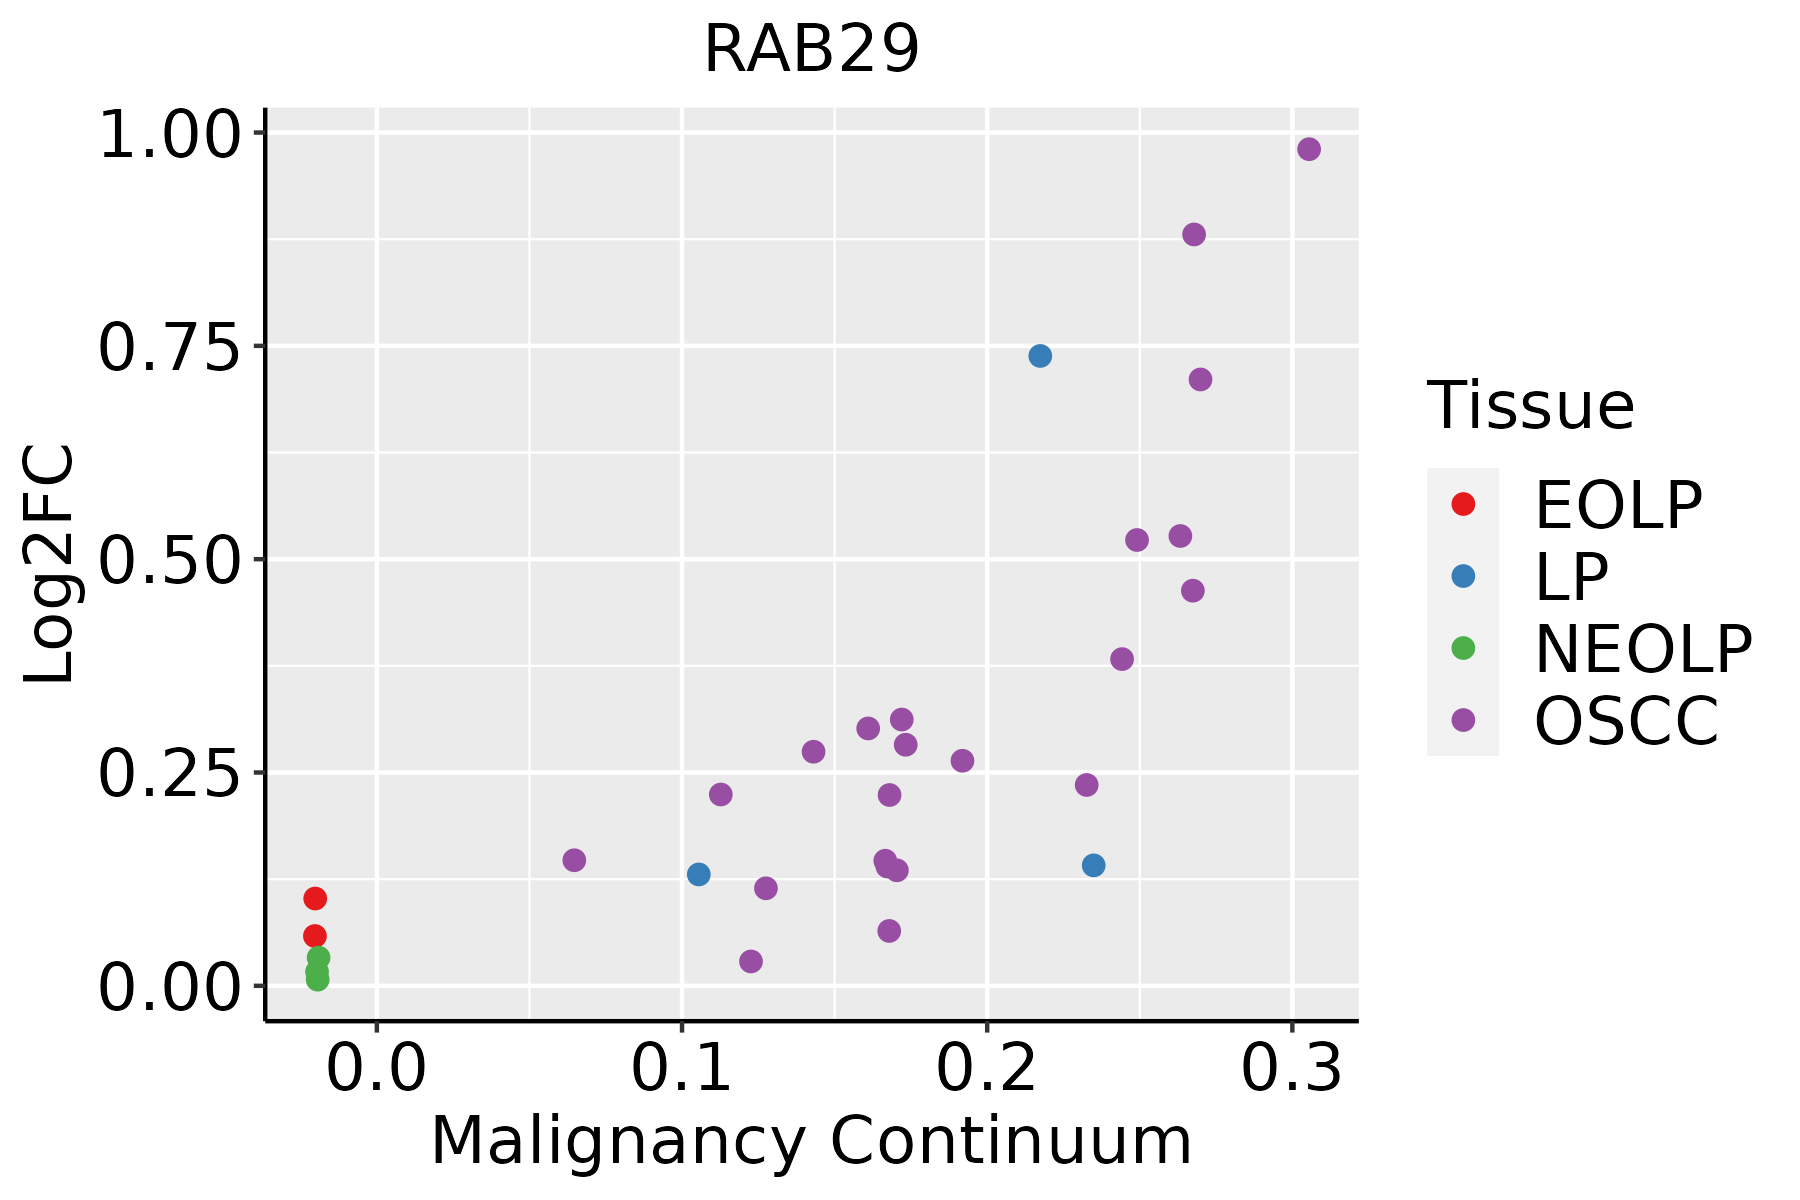 | EOLP: Erosive Oral lichen planus |
| LP: leukoplakia | ||
| NEOLP: Non-erosive oral lichen planus | ||
| OSCC: Oral squamous cell carcinoma |
| ∗log2FC in expression of this searched gene in stem-like cells from each diseased tissue sample relative to stem-like cells in normal samples in each tissue plotted against the malignancy continuum. Samples are colored based on if they are from different disease stage. |
Top |
Malignant transformation related pathway analysis |
| Find out the enriched GO biological processes and KEGG pathways involved in transition from healthy to precancer to cancer |
| Tissue | Disease Stage | Enriched GO biological Processes |
| Colorectum | AD |  |
| Colorectum | SER |  |
| Colorectum | MSS |  |
| Colorectum | MSI-H |  |
| Colorectum | FAP |  |
| ∗Top 15 enriched GO BP terms are showed in the bar plot of each disease state in each tissue. Each row represents a significant GO biological process which is colored according to the -log10(p.adjust). |
| Page: 1 2 3 4 5 6 7 8 9 |
| GO ID | Tissue | Disease Stage | Description | Gene Ratio | Bg Ratio | pvalue | p.adjust | Count |
| GO:005122219 | Oral cavity | OSCC | positive regulation of protein transport | 187/7305 | 303/18723 | 7.37e-16 | 5.49e-14 | 187 |
| GO:003238818 | Oral cavity | OSCC | positive regulation of intracellular transport | 134/7305 | 202/18723 | 2.82e-15 | 1.88e-13 | 134 |
| GO:001907920 | Oral cavity | OSCC | viral genome replication | 95/7305 | 131/18723 | 6.35e-15 | 4.02e-13 | 95 |
| GO:009031610 | Oral cavity | OSCC | positive regulation of intracellular protein transport | 110/7305 | 160/18723 | 2.10e-14 | 1.19e-12 | 110 |
| GO:00161979 | Oral cavity | OSCC | endosomal transport | 141/7305 | 230/18723 | 5.40e-12 | 2.06e-10 | 141 |
| GO:199077816 | Oral cavity | OSCC | protein localization to cell periphery | 190/7305 | 333/18723 | 1.46e-11 | 5.13e-10 | 190 |
| GO:007099720 | Oral cavity | OSCC | neuron death | 202/7305 | 361/18723 | 3.75e-11 | 1.23e-09 | 202 |
| GO:00164829 | Oral cavity | OSCC | cytosolic transport | 106/7305 | 168/18723 | 2.08e-10 | 5.90e-09 | 106 |
| GO:190121420 | Oral cavity | OSCC | regulation of neuron death | 174/7305 | 319/18723 | 1.09e-08 | 2.23e-07 | 174 |
| GO:004211016 | Oral cavity | OSCC | T cell activation | 245/7305 | 487/18723 | 2.00e-07 | 3.22e-06 | 245 |
| GO:00070307 | Oral cavity | OSCC | Golgi organization | 92/7305 | 157/18723 | 4.96e-07 | 7.27e-06 | 92 |
| GO:00421476 | Oral cavity | OSCC | retrograde transport, endosome to Golgi | 55/7305 | 91/18723 | 2.79e-05 | 2.59e-04 | 55 |
| GO:004311210 | Oral cavity | OSCC | receptor metabolic process | 88/7305 | 166/18723 | 1.68e-04 | 1.15e-03 | 88 |
| GO:00508527 | Oral cavity | OSCC | T cell receptor signaling pathway | 68/7305 | 123/18723 | 1.80e-04 | 1.22e-03 | 68 |
| GO:001097510 | Oral cavity | OSCC | regulation of neuron projection development | 210/7305 | 445/18723 | 2.35e-04 | 1.52e-03 | 210 |
| GO:0033059 | Oral cavity | OSCC | cellular pigmentation | 33/7305 | 53/18723 | 5.11e-04 | 2.98e-03 | 33 |
| GO:0048753 | Oral cavity | OSCC | pigment granule organization | 20/7305 | 29/18723 | 1.05e-03 | 5.39e-03 | 20 |
| GO:0032438 | Oral cavity | OSCC | melanosome organization | 19/7305 | 28/18723 | 1.88e-03 | 8.84e-03 | 19 |
| GO:19019986 | Oral cavity | OSCC | toxin transport | 25/7305 | 40/18723 | 2.22e-03 | 1.00e-02 | 25 |
| GO:00027646 | Oral cavity | OSCC | immune response-regulating signaling pathway | 212/7305 | 468/18723 | 2.93e-03 | 1.27e-02 | 212 |
| Page: 1 2 3 4 5 6 |
| Pathway ID | Tissue | Disease Stage | Description | Gene Ratio | Bg Ratio | pvalue | p.adjust | qvalue | Count |
| Page: 1 |
Top |
Cell-cell communication analysis |
| Identification of potential cell-cell interactions between two cell types and their ligand-receptor pairs for different disease states |
| Ligand | Receptor | LRpair | Pathway | Tissue | Disease Stage |
| Page: 1 |
Top |
Single-cell gene regulatory network inference analysis |
| Find out the significant the regulons (TFs) and the target genes of each regulon across cell types for different disease states |
| TF | Cell Type | Tissue | Disease Stage | Target Gene | RSS | Regulon Activity |
| ∗The dot plots of a searched regulon are shown for all cell subpopulations in each disease state of each tissue based on the regulon specific score inferred using pySCENIC and by calculating the average expression. |
| Page: 1 |
Top |
Somatic mutation of malignant transformation related genes |
| Annotation of somatic variants for genes involved in malignant transformation |
| Hugo Symbol | Variant Class | Variant Classification | dbSNP RS | HGVSc | HGVSp | HGVSp Short | SWISSPROT | BIOTYPE | SIFT | PolyPhen | Tumor Sample Barcode | Tissue | Histology | Sex | Age | Stage | Therapy Types | Drugs | Outcome |
| RAB29 | SNV | Missense_Mutation | c.235N>T | p.Arg79Trp | p.R79W | O14966 | protein_coding | deleterious(0) | probably_damaging(0.996) | TCGA-AA-3877-01 | Colorectum | colon adenocarcinoma | Female | >=65 | I/II | Unknown | Unknown | SD | |
| RAB29 | SNV | Missense_Mutation | rs766320142 | c.350N>T | p.Pro117Leu | p.P117L | O14966 | protein_coding | deleterious(0.04) | benign(0.26) | TCGA-AA-3952-01 | Colorectum | colon adenocarcinoma | Male | >=65 | III/IV | Unknown | Unknown | PD |
| RAB29 | SNV | Missense_Mutation | c.235C>T | p.Arg79Trp | p.R79W | O14966 | protein_coding | deleterious(0) | probably_damaging(0.996) | TCGA-AA-A00N-01 | Colorectum | colon adenocarcinoma | Male | >=65 | I/II | Unknown | Unknown | PD | |
| RAB29 | SNV | Missense_Mutation | c.77G>A | p.Arg26Gln | p.R26Q | O14966 | protein_coding | deleterious(0.02) | probably_damaging(0.972) | TCGA-CK-4951-01 | Colorectum | colon adenocarcinoma | Female | >=65 | I/II | Unknown | Unknown | PD | |
| RAB29 | SNV | Missense_Mutation | novel | c.283N>G | p.Thr95Ala | p.T95A | O14966 | protein_coding | deleterious(0) | possibly_damaging(0.841) | TCGA-AG-3883-01 | Colorectum | rectum adenocarcinoma | Male | >=65 | I/II | Unknown | Unknown | SD |
| RAB29 | SNV | Missense_Mutation | novel | c.113C>T | p.Ser38Phe | p.S38F | O14966 | protein_coding | deleterious(0) | possibly_damaging(0.579) | TCGA-F5-6814-01 | Colorectum | rectum adenocarcinoma | Male | <65 | I/II | Unknown | Unknown | SD |
| RAB29 | SNV | Missense_Mutation | novel | c.187N>T | p.Asp63Tyr | p.D63Y | O14966 | protein_coding | deleterious(0) | probably_damaging(1) | TCGA-A5-A0G2-01 | Endometrium | uterine corpus endometrioid carcinoma | Female | <65 | III/IV | Unknown | Unknown | SD |
| RAB29 | SNV | Missense_Mutation | rs766320142 | c.350N>T | p.Pro117Leu | p.P117L | O14966 | protein_coding | deleterious(0.04) | benign(0.26) | TCGA-AP-A05N-01 | Endometrium | uterine corpus endometrioid carcinoma | Female | <65 | I/II | Unknown | Unknown | SD |
| RAB29 | SNV | Missense_Mutation | novel | c.355N>T | p.Pro119Ser | p.P119S | O14966 | protein_coding | deleterious(0.04) | probably_damaging(0.99) | TCGA-AX-A06F-01 | Endometrium | uterine corpus endometrioid carcinoma | Female | <65 | III/IV | Chemotherapy | carboplatin | SD |
| RAB29 | SNV | Missense_Mutation | c.548N>A | p.Ser183Tyr | p.S183Y | O14966 | protein_coding | tolerated(0.08) | benign(0.057) | TCGA-BS-A0UF-01 | Endometrium | uterine corpus endometrioid carcinoma | Female | >=65 | I/II | Unknown | Unknown | SD |
| Page: 1 2 |
Top |
Related drugs of malignant transformation related genes |
| Identification of chemicals and drugs interact with genes involved in malignant transfromation |
| (DGIdb 4.0) |
| Entrez ID | Symbol | Category | Interaction Types | Drug Claim Name | Drug Name | PMIDs |
| Page: 1 |

Copyright 2023-Present -The University of Texas Health Science Center at Houston |