
|
|||||
|
 | |
| |
| |
| |
| |
| |
|
Gene: RAB27B |
Gene summary for RAB27B |
| Gene information | Species | Human | Gene symbol | RAB27B | Gene ID | 5874 |
| Gene name | RAB27B, member RAS oncogene family | |
| Gene Alias | C25KG | |
| Cytomap | 18q21.2 | |
| Gene Type | protein-coding | GO ID | GO:0006810 | UniProtAcc | O00194 |
Top |
Malignant transformation analysis |
| Identification of the aberrant gene expression in precancerous and cancerous lesions by comparing the gene expression of stem-like cells in diseased tissues with normal stem cells |
| Entrez ID | Symbol | Replicates | Species | Organ | Tissue | Adj P-value | Log2FC | Malignancy |
| 5874 | RAB27B | LZE5T | Human | Esophagus | ESCC | 3.84e-03 | 3.47e-01 | 0.0514 |
| 5874 | RAB27B | LZE22T | Human | Esophagus | ESCC | 1.63e-02 | 2.66e-01 | 0.068 |
| 5874 | RAB27B | LZE24T | Human | Esophagus | ESCC | 5.53e-25 | 8.93e-01 | 0.0596 |
| 5874 | RAB27B | P1T-E | Human | Esophagus | ESCC | 2.23e-11 | 6.95e-01 | 0.0875 |
| 5874 | RAB27B | P2T-E | Human | Esophagus | ESCC | 1.29e-07 | 2.52e-01 | 0.1177 |
| 5874 | RAB27B | P4T-E | Human | Esophagus | ESCC | 2.59e-07 | 2.37e-01 | 0.1323 |
| 5874 | RAB27B | P5T-E | Human | Esophagus | ESCC | 4.06e-05 | 9.77e-02 | 0.1327 |
| 5874 | RAB27B | P8T-E | Human | Esophagus | ESCC | 4.88e-29 | 8.33e-01 | 0.0889 |
| 5874 | RAB27B | P10T-E | Human | Esophagus | ESCC | 6.44e-12 | 1.24e-01 | 0.116 |
| 5874 | RAB27B | P11T-E | Human | Esophagus | ESCC | 2.74e-04 | 3.73e-01 | 0.1426 |
| 5874 | RAB27B | P17T-E | Human | Esophagus | ESCC | 1.83e-03 | 2.87e-01 | 0.1278 |
| 5874 | RAB27B | P20T-E | Human | Esophagus | ESCC | 2.32e-15 | 4.41e-01 | 0.1124 |
| 5874 | RAB27B | P21T-E | Human | Esophagus | ESCC | 1.11e-15 | 4.30e-01 | 0.1617 |
| 5874 | RAB27B | P22T-E | Human | Esophagus | ESCC | 1.05e-03 | 1.72e-01 | 0.1236 |
| 5874 | RAB27B | P23T-E | Human | Esophagus | ESCC | 1.54e-17 | 4.90e-01 | 0.108 |
| 5874 | RAB27B | P24T-E | Human | Esophagus | ESCC | 4.79e-11 | 3.42e-01 | 0.1287 |
| 5874 | RAB27B | P26T-E | Human | Esophagus | ESCC | 1.79e-04 | 1.84e-01 | 0.1276 |
| 5874 | RAB27B | P27T-E | Human | Esophagus | ESCC | 6.20e-07 | 1.23e-01 | 0.1055 |
| 5874 | RAB27B | P30T-E | Human | Esophagus | ESCC | 2.59e-08 | 4.74e-01 | 0.137 |
| 5874 | RAB27B | P31T-E | Human | Esophagus | ESCC | 9.22e-08 | 2.55e-01 | 0.1251 |
| Page: 1 2 3 4 |
| Tissue | Expression Dynamics | Abbreviation |
| Esophagus | 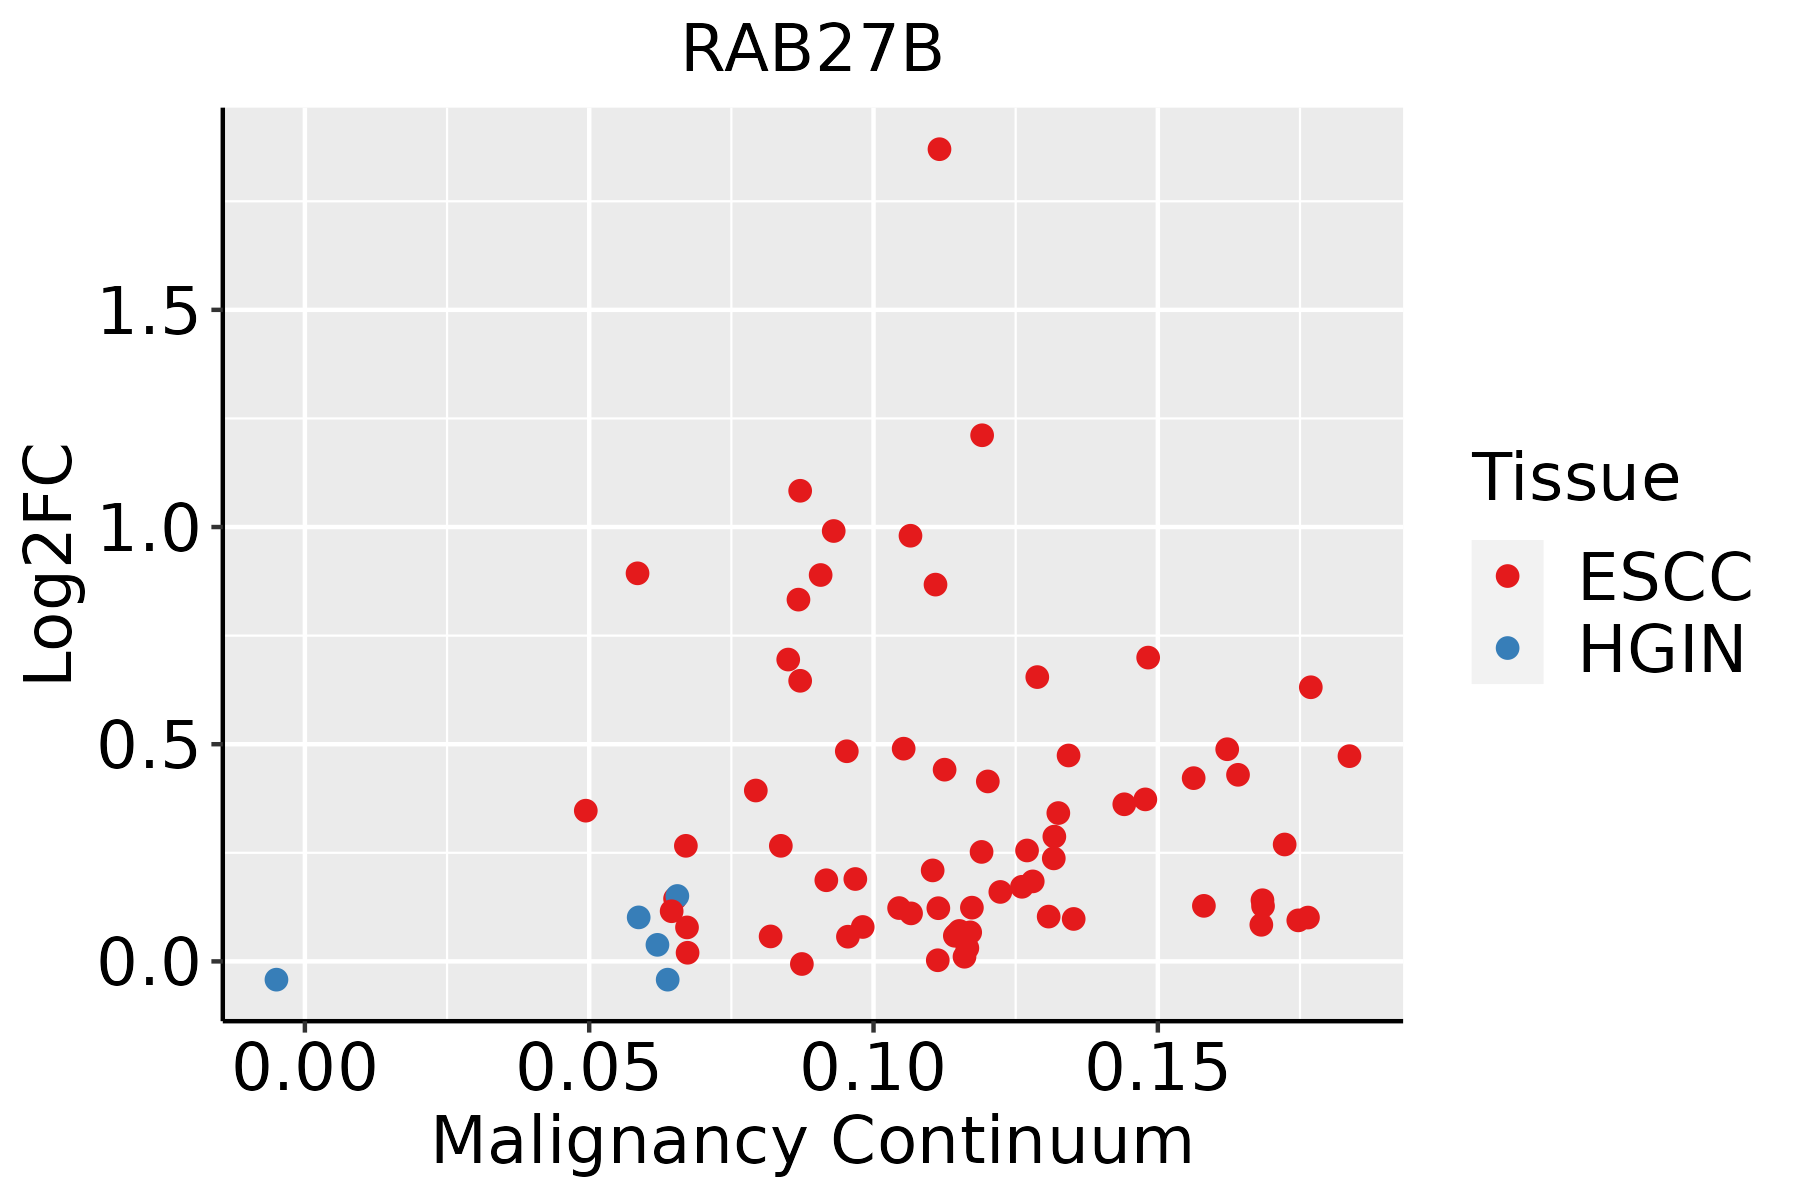 | ESCC: Esophageal squamous cell carcinoma |
| HGIN: High-grade intraepithelial neoplasias | ||
| LGIN: Low-grade intraepithelial neoplasias | ||
| Liver | 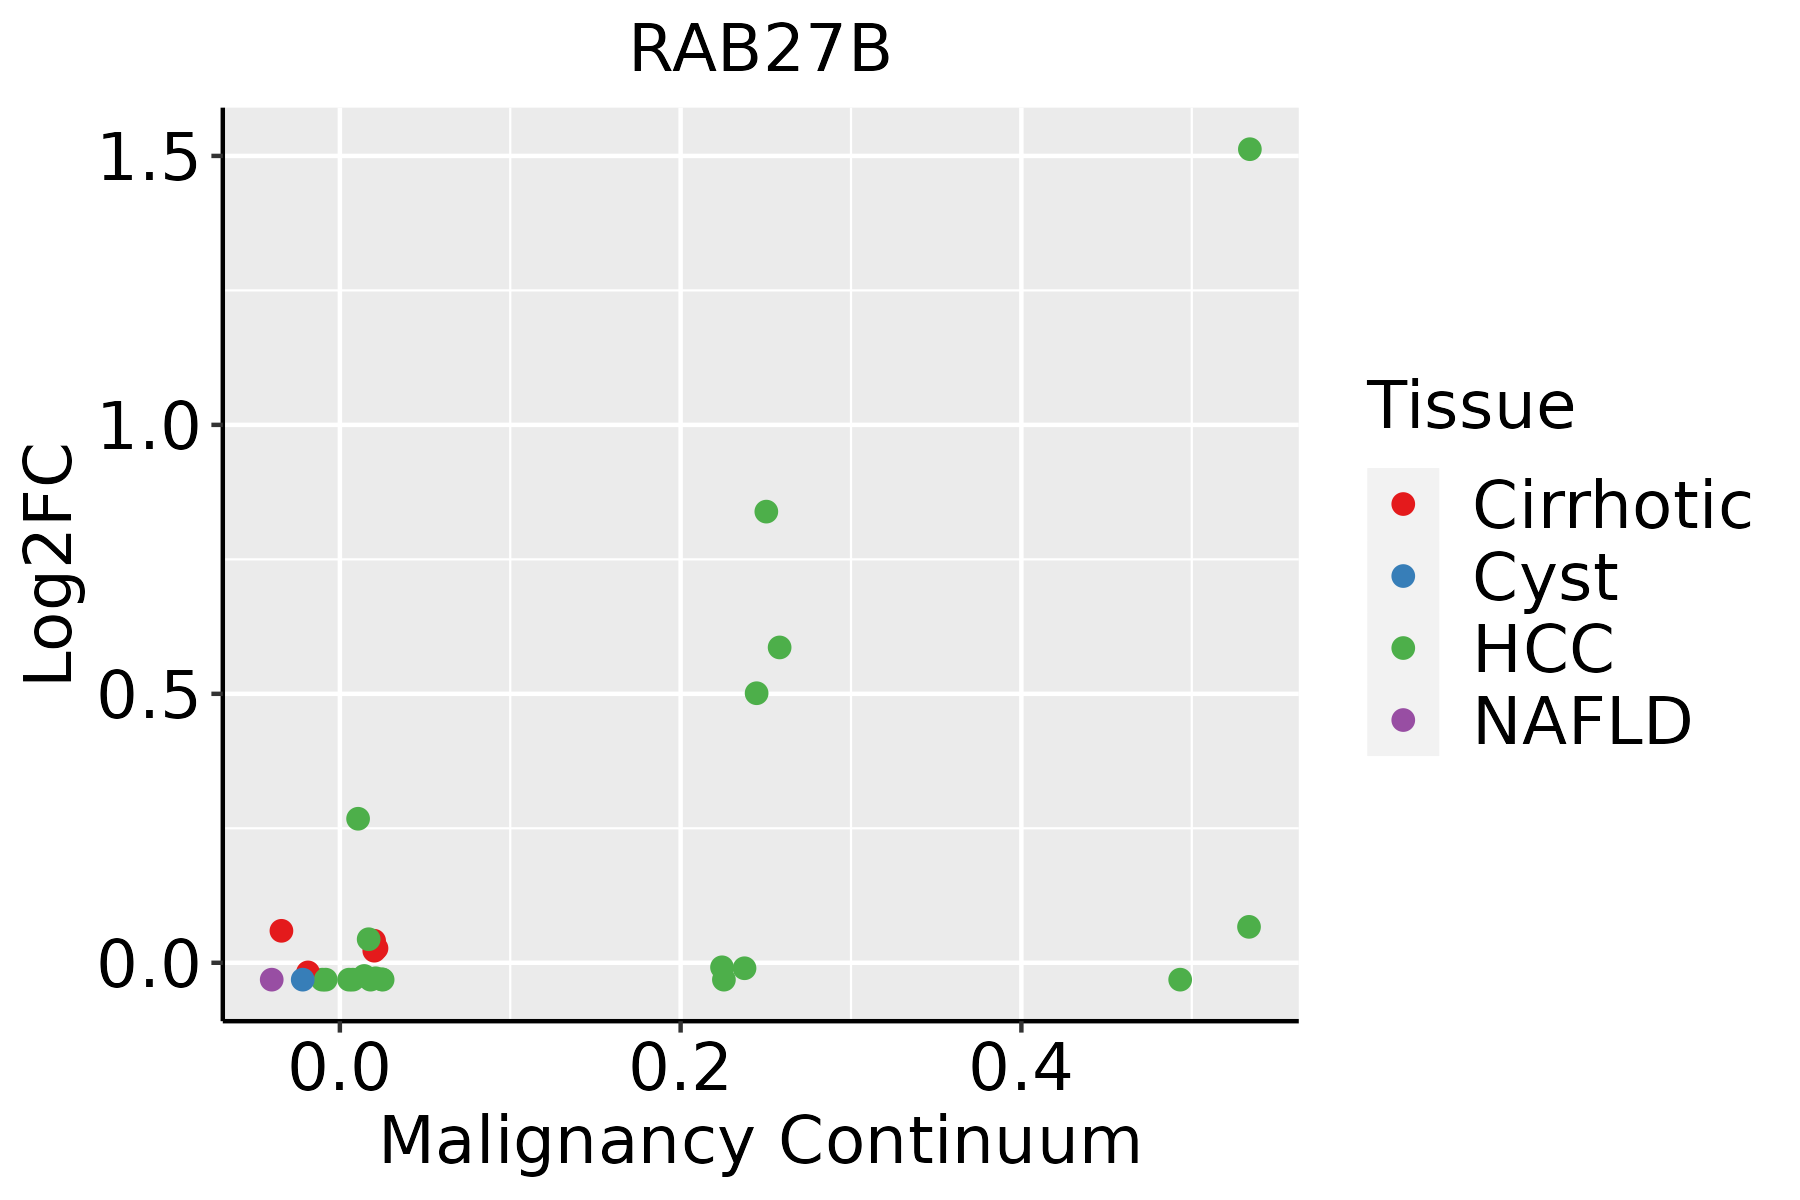 | HCC: Hepatocellular carcinoma |
| NAFLD: Non-alcoholic fatty liver disease | ||
| Lung | 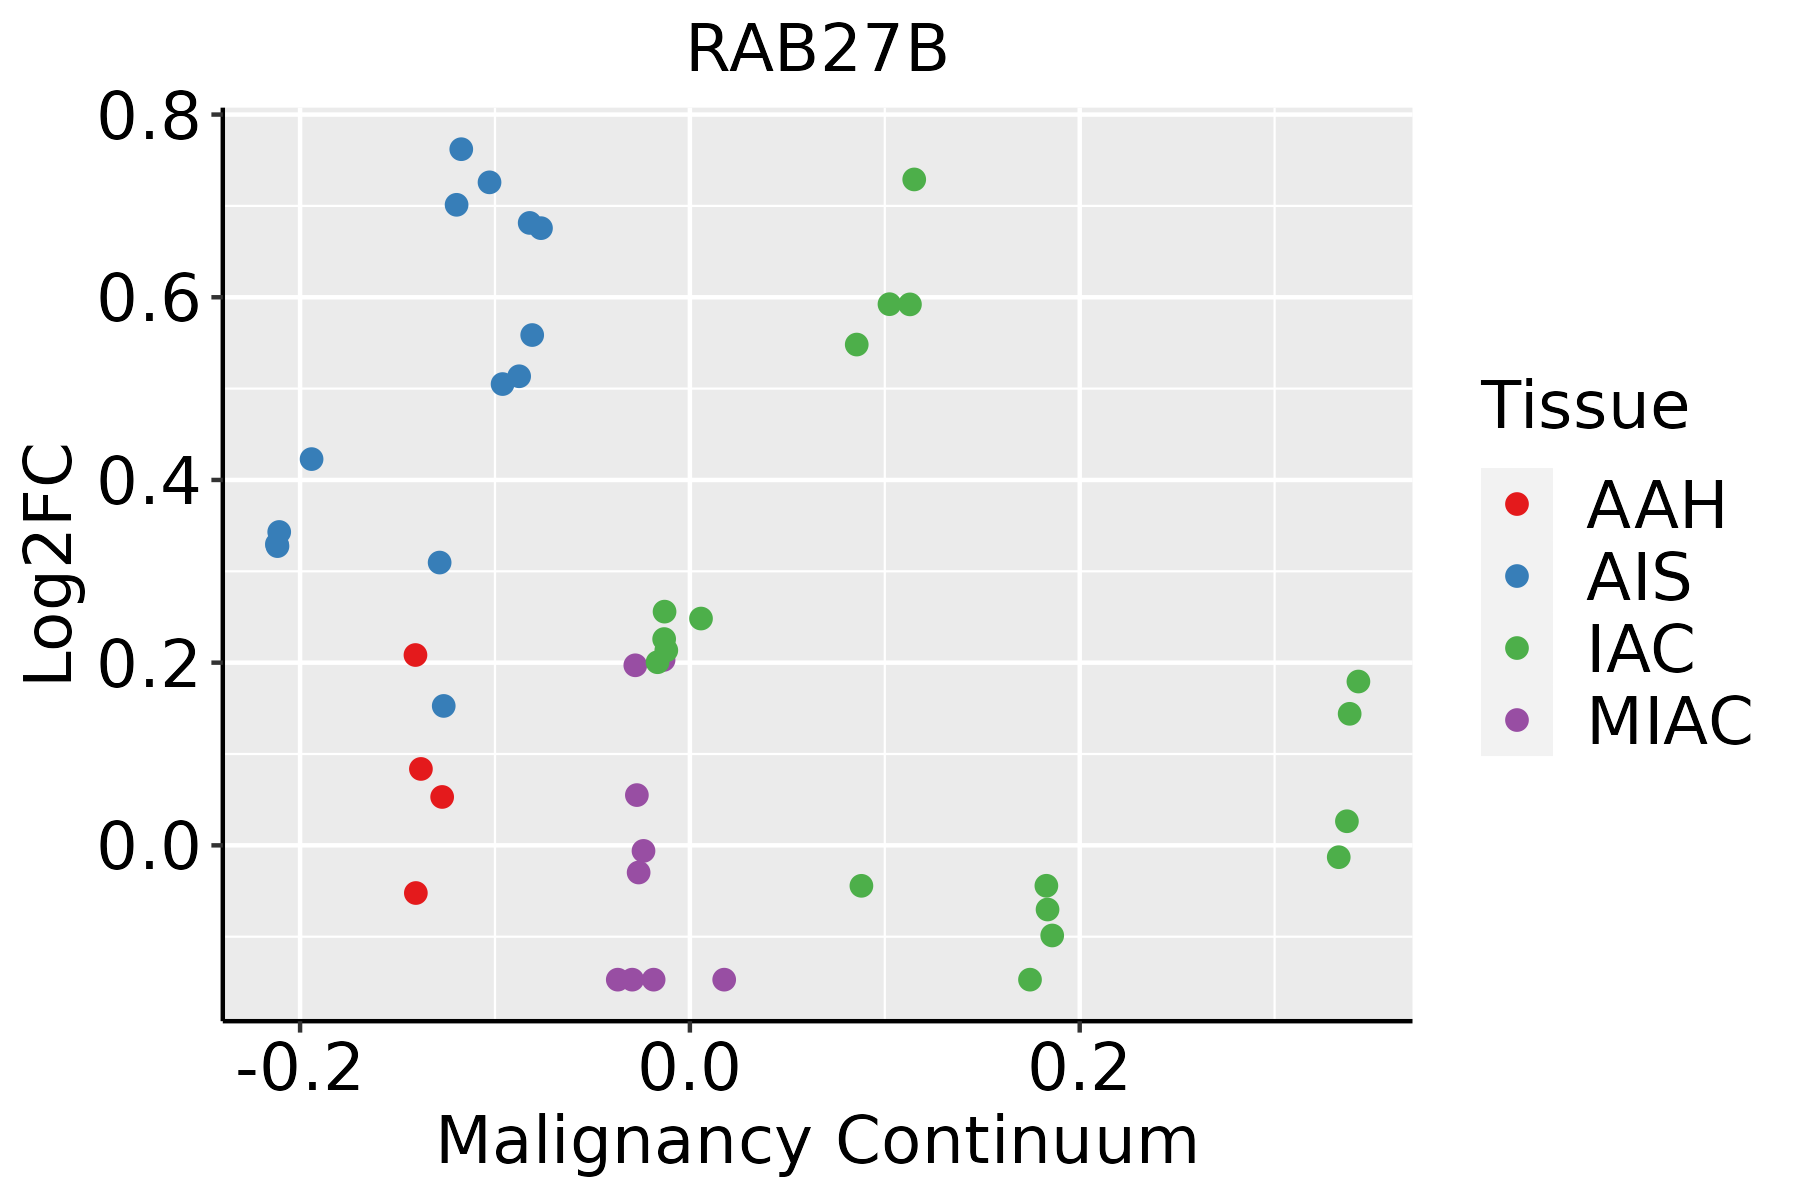 | AAH: Atypical adenomatous hyperplasia |
| AIS: Adenocarcinoma in situ | ||
| IAC: Invasive lung adenocarcinoma | ||
| MIA: Minimally invasive adenocarcinoma | ||
| Oral Cavity | 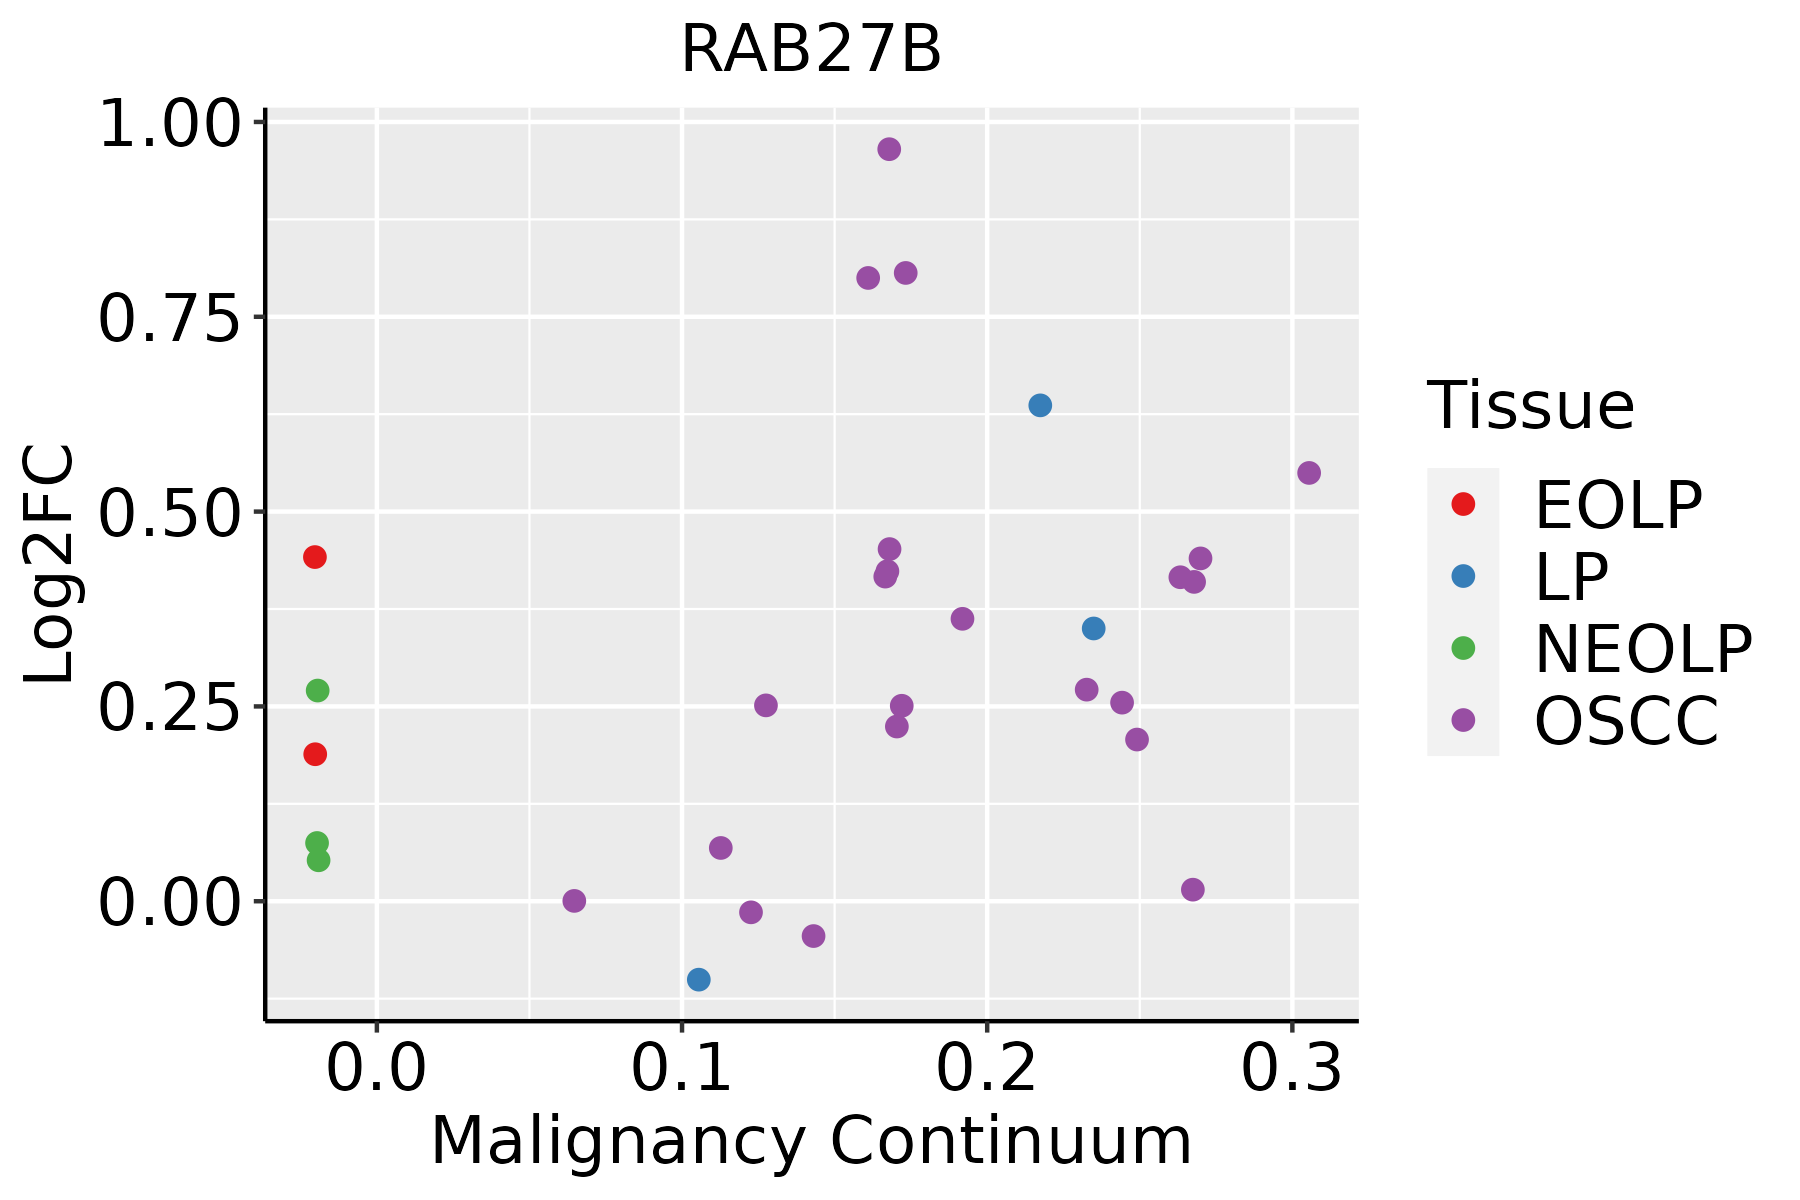 | EOLP: Erosive Oral lichen planus |
| LP: leukoplakia | ||
| NEOLP: Non-erosive oral lichen planus | ||
| OSCC: Oral squamous cell carcinoma | ||
| Prostate | 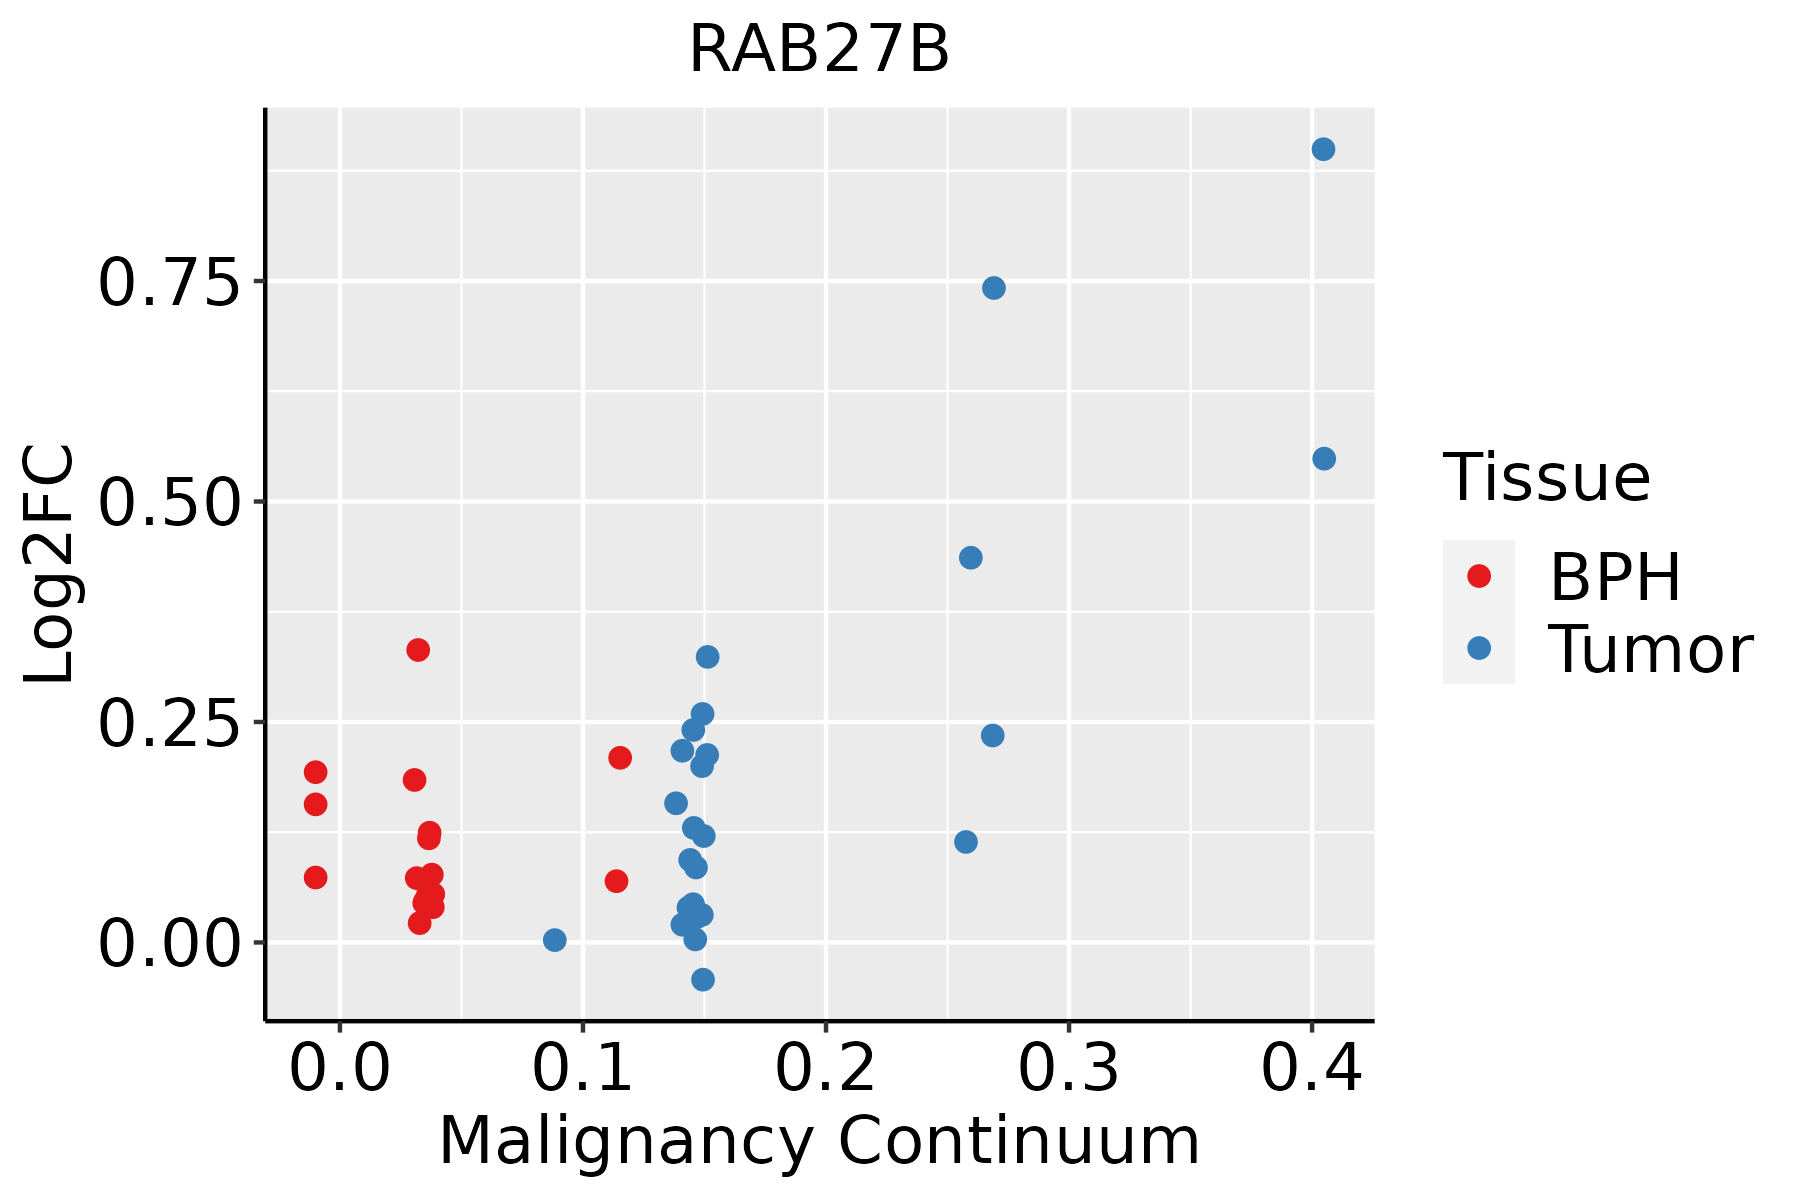 | BPH: Benign Prostatic Hyperplasia |
| ∗log2FC in expression of this searched gene in stem-like cells from each diseased tissue sample relative to stem-like cells in normal samples in each tissue plotted against the malignancy continuum. Samples are colored based on if they are from different disease stage. |
Top |
Malignant transformation related pathway analysis |
| Find out the enriched GO biological processes and KEGG pathways involved in transition from healthy to precancer to cancer |
| Tissue | Disease Stage | Enriched GO biological Processes |
| Colorectum | AD |  |
| Colorectum | SER |  |
| Colorectum | MSS |  |
| Colorectum | MSI-H |  |
| Colorectum | FAP |  |
| ∗Top 15 enriched GO BP terms are showed in the bar plot of each disease state in each tissue. Each row represents a significant GO biological process which is colored according to the -log10(p.adjust). |
| Page: 1 2 3 4 5 6 7 8 9 |
| GO ID | Tissue | Disease Stage | Description | Gene Ratio | Bg Ratio | pvalue | p.adjust | Count |
| GO:005164822 | Oral cavity | EOLP | vesicle localization | 37/2218 | 177/18723 | 3.88e-04 | 3.48e-03 | 37 |
| GO:009893011 | Oral cavity | EOLP | axonal transport | 17/2218 | 64/18723 | 9.71e-04 | 7.35e-03 | 17 |
| GO:00990035 | Oral cavity | EOLP | vesicle-mediated transport in synapse | 39/2218 | 200/18723 | 1.14e-03 | 8.29e-03 | 39 |
| GO:001097021 | Oral cavity | EOLP | transport along microtubule | 32/2218 | 155/18723 | 1.15e-03 | 8.37e-03 | 32 |
| GO:00068874 | Oral cavity | EOLP | exocytosis | 60/2218 | 352/18723 | 2.32e-03 | 1.43e-02 | 60 |
| GO:00995044 | Oral cavity | EOLP | synaptic vesicle cycle | 34/2218 | 181/18723 | 4.25e-03 | 2.33e-02 | 34 |
| GO:00484885 | Oral cavity | EOLP | synaptic vesicle endocytosis | 15/2218 | 62/18723 | 5.00e-03 | 2.64e-02 | 15 |
| GO:01402385 | Oral cavity | EOLP | presynaptic endocytosis | 15/2218 | 62/18723 | 5.00e-03 | 2.64e-02 | 15 |
| GO:00330592 | Oral cavity | EOLP | cellular pigmentation | 13/2218 | 53/18723 | 7.67e-03 | 3.66e-02 | 13 |
| GO:0043473 | Oral cavity | EOLP | pigmentation | 20/2218 | 98/18723 | 1.02e-02 | 4.58e-02 | 20 |
| GO:003070531 | Oral cavity | NEOLP | cytoskeleton-dependent intracellular transport | 46/2005 | 195/18723 | 1.81e-07 | 6.18e-06 | 46 |
| GO:005165631 | Oral cavity | NEOLP | establishment of organelle localization | 69/2005 | 390/18723 | 1.89e-05 | 3.16e-04 | 69 |
| GO:001097031 | Oral cavity | NEOLP | transport along microtubule | 33/2005 | 155/18723 | 8.53e-05 | 1.06e-03 | 33 |
| GO:005165031 | Oral cavity | NEOLP | establishment of vesicle localization | 33/2005 | 161/18723 | 1.83e-04 | 1.99e-03 | 33 |
| GO:005164831 | Oral cavity | NEOLP | vesicle localization | 34/2005 | 177/18723 | 5.23e-04 | 4.61e-03 | 34 |
| GO:000808831 | Oral cavity | NEOLP | axo-dendritic transport | 18/2005 | 75/18723 | 7.69e-04 | 6.20e-03 | 18 |
| GO:009911111 | Oral cavity | NEOLP | microtubule-based transport | 34/2005 | 190/18723 | 1.87e-03 | 1.28e-02 | 34 |
| GO:009893021 | Oral cavity | NEOLP | axonal transport | 14/2005 | 64/18723 | 6.92e-03 | 3.51e-02 | 14 |
| GO:0098840 | Oral cavity | NEOLP | protein transport along microtubule | 5/2005 | 13/18723 | 8.62e-03 | 4.15e-02 | 5 |
| GO:0099118 | Oral cavity | NEOLP | microtubule-based protein transport | 5/2005 | 13/18723 | 8.62e-03 | 4.15e-02 | 5 |
| Page: 1 2 3 4 5 6 |
| Pathway ID | Tissue | Disease Stage | Description | Gene Ratio | Bg Ratio | pvalue | p.adjust | qvalue | Count |
| Page: 1 |
Top |
Cell-cell communication analysis |
| Identification of potential cell-cell interactions between two cell types and their ligand-receptor pairs for different disease states |
| Ligand | Receptor | LRpair | Pathway | Tissue | Disease Stage |
| Page: 1 |
Top |
Single-cell gene regulatory network inference analysis |
| Find out the significant the regulons (TFs) and the target genes of each regulon across cell types for different disease states |
| TF | Cell Type | Tissue | Disease Stage | Target Gene | RSS | Regulon Activity |
| ∗The dot plots of a searched regulon are shown for all cell subpopulations in each disease state of each tissue based on the regulon specific score inferred using pySCENIC and by calculating the average expression. |
| Page: 1 |
Top |
Somatic mutation of malignant transformation related genes |
| Annotation of somatic variants for genes involved in malignant transformation |
| Hugo Symbol | Variant Class | Variant Classification | dbSNP RS | HGVSc | HGVSp | HGVSp Short | SWISSPROT | BIOTYPE | SIFT | PolyPhen | Tumor Sample Barcode | Tissue | Histology | Sex | Age | Stage | Therapy Types | Drugs | Outcome |
| RAB27B | SNV | Missense_Mutation | c.168N>C | p.Gln56His | p.Q56H | O00194 | protein_coding | deleterious(0.03) | benign(0.101) | TCGA-A6-5666-01 | Colorectum | colon adenocarcinoma | Male | >=65 | I/II | Unknown | Unknown | PD | |
| RAB27B | SNV | Missense_Mutation | c.493N>A | p.Ala165Thr | p.A165T | O00194 | protein_coding | tolerated(0.22) | possibly_damaging(0.738) | TCGA-AA-3977-01 | Colorectum | colon adenocarcinoma | Male | >=65 | I/II | Unknown | Unknown | SD | |
| RAB27B | SNV | Missense_Mutation | c.118N>C | p.Thr40Pro | p.T40P | O00194 | protein_coding | deleterious(0) | probably_damaging(0.969) | TCGA-AA-A010-01 | Colorectum | colon adenocarcinoma | Female | <65 | I/II | Chemotherapy | folinic | CR | |
| RAB27B | SNV | Missense_Mutation | c.337N>G | p.Trp113Gly | p.W113G | O00194 | protein_coding | deleterious(0) | probably_damaging(1) | TCGA-AA-A010-01 | Colorectum | colon adenocarcinoma | Female | <65 | I/II | Chemotherapy | folinic | CR | |
| RAB27B | SNV | Missense_Mutation | rs200080884 | c.196N>C | p.Phe66Leu | p.F66L | O00194 | protein_coding | tolerated(0.62) | benign(0.131) | TCGA-CM-6165-01 | Colorectum | colon adenocarcinoma | Male | >=65 | I/II | Unknown | Unknown | SD |
| RAB27B | SNV | Missense_Mutation | rs753780291 | c.551G>A | p.Arg184Gln | p.R184Q | O00194 | protein_coding | deleterious(0.03) | benign(0.323) | TCGA-D5-6928-01 | Colorectum | colon adenocarcinoma | Male | >=65 | I/II | Unknown | Unknown | SD |
| RAB27B | SNV | Missense_Mutation | novel | c.76N>A | p.Leu26Ile | p.L26I | O00194 | protein_coding | deleterious(0.02) | probably_damaging(0.998) | TCGA-AJ-A5DW-01 | Endometrium | uterine corpus endometrioid carcinoma | Female | <65 | I/II | Unknown | Unknown | SD |
| RAB27B | SNV | Missense_Mutation | rs376553954 | c.238C>T | p.Arg80Trp | p.R80W | O00194 | protein_coding | deleterious(0) | probably_damaging(1) | TCGA-B5-A3FC-01 | Endometrium | uterine corpus endometrioid carcinoma | Female | <65 | I/II | Unknown | Unknown | SD |
| RAB27B | SNV | Missense_Mutation | rs865964184 | c.170N>A | p.Gly57Glu | p.G57E | O00194 | protein_coding | tolerated(0.08) | benign(0.185) | TCGA-DF-A2KN-01 | Endometrium | uterine corpus endometrioid carcinoma | Female | Unknown | I/II | Unknown | Unknown | SD |
| RAB27B | SNV | Missense_Mutation | novel | c.43N>A | p.Leu15Ile | p.L15I | O00194 | protein_coding | tolerated(0.92) | probably_damaging(0.977) | TCGA-DF-A2KU-01 | Endometrium | uterine corpus endometrioid carcinoma | Female | Unknown | I/II | Unknown | Unknown | SD |
| Page: 1 2 3 |
Top |
Related drugs of malignant transformation related genes |
| Identification of chemicals and drugs interact with genes involved in malignant transfromation |
| (DGIdb 4.0) |
| Entrez ID | Symbol | Category | Interaction Types | Drug Claim Name | Drug Name | PMIDs |
| Page: 1 |

Copyright 2023-Present -The University of Texas Health Science Center at Houston |