
|
|||||
|
 | |
| |
| |
| |
| |
| |
|
Gene: RAB23 |
Gene summary for RAB23 |
| Gene information | Species | Human | Gene symbol | RAB23 | Gene ID | 51715 |
| Gene name | RAB23, member RAS oncogene family | |
| Gene Alias | HSPC137 | |
| Cytomap | 6p12.1-p11.2 | |
| Gene Type | protein-coding | GO ID | GO:0000045 | UniProtAcc | A0A024RD41 |
Top |
Malignant transformation analysis |
| Identification of the aberrant gene expression in precancerous and cancerous lesions by comparing the gene expression of stem-like cells in diseased tissues with normal stem cells |
| Entrez ID | Symbol | Replicates | Species | Organ | Tissue | Adj P-value | Log2FC | Malignancy |
| 51715 | RAB23 | LZE24T | Human | Esophagus | ESCC | 1.95e-10 | 2.24e-01 | 0.0596 |
| 51715 | RAB23 | P2T-E | Human | Esophagus | ESCC | 1.64e-07 | 8.23e-02 | 0.1177 |
| 51715 | RAB23 | P4T-E | Human | Esophagus | ESCC | 4.01e-11 | 2.68e-01 | 0.1323 |
| 51715 | RAB23 | P5T-E | Human | Esophagus | ESCC | 5.31e-05 | 8.15e-02 | 0.1327 |
| 51715 | RAB23 | P8T-E | Human | Esophagus | ESCC | 3.37e-04 | 7.07e-02 | 0.0889 |
| 51715 | RAB23 | P9T-E | Human | Esophagus | ESCC | 2.30e-04 | 1.54e-01 | 0.1131 |
| 51715 | RAB23 | P10T-E | Human | Esophagus | ESCC | 6.11e-08 | 1.49e-01 | 0.116 |
| 51715 | RAB23 | P11T-E | Human | Esophagus | ESCC | 1.49e-05 | 2.73e-01 | 0.1426 |
| 51715 | RAB23 | P12T-E | Human | Esophagus | ESCC | 2.05e-20 | 3.15e-01 | 0.1122 |
| 51715 | RAB23 | P15T-E | Human | Esophagus | ESCC | 1.05e-08 | 1.51e-01 | 0.1149 |
| 51715 | RAB23 | P16T-E | Human | Esophagus | ESCC | 8.82e-09 | 1.48e-01 | 0.1153 |
| 51715 | RAB23 | P17T-E | Human | Esophagus | ESCC | 3.65e-03 | 1.87e-01 | 0.1278 |
| 51715 | RAB23 | P21T-E | Human | Esophagus | ESCC | 4.74e-03 | 5.00e-02 | 0.1617 |
| 51715 | RAB23 | P22T-E | Human | Esophagus | ESCC | 1.92e-02 | 6.26e-02 | 0.1236 |
| 51715 | RAB23 | P23T-E | Human | Esophagus | ESCC | 1.88e-06 | 1.93e-01 | 0.108 |
| 51715 | RAB23 | P24T-E | Human | Esophagus | ESCC | 1.21e-09 | 1.24e-01 | 0.1287 |
| 51715 | RAB23 | P26T-E | Human | Esophagus | ESCC | 6.14e-11 | 2.58e-01 | 0.1276 |
| 51715 | RAB23 | P27T-E | Human | Esophagus | ESCC | 6.47e-12 | 2.25e-01 | 0.1055 |
| 51715 | RAB23 | P28T-E | Human | Esophagus | ESCC | 1.89e-07 | 1.16e-01 | 0.1149 |
| 51715 | RAB23 | P31T-E | Human | Esophagus | ESCC | 5.84e-15 | 1.07e-01 | 0.1251 |
| Page: 1 2 3 |
| Tissue | Expression Dynamics | Abbreviation |
| Esophagus |  | ESCC: Esophageal squamous cell carcinoma |
| HGIN: High-grade intraepithelial neoplasias | ||
| LGIN: Low-grade intraepithelial neoplasias | ||
| Thyroid | 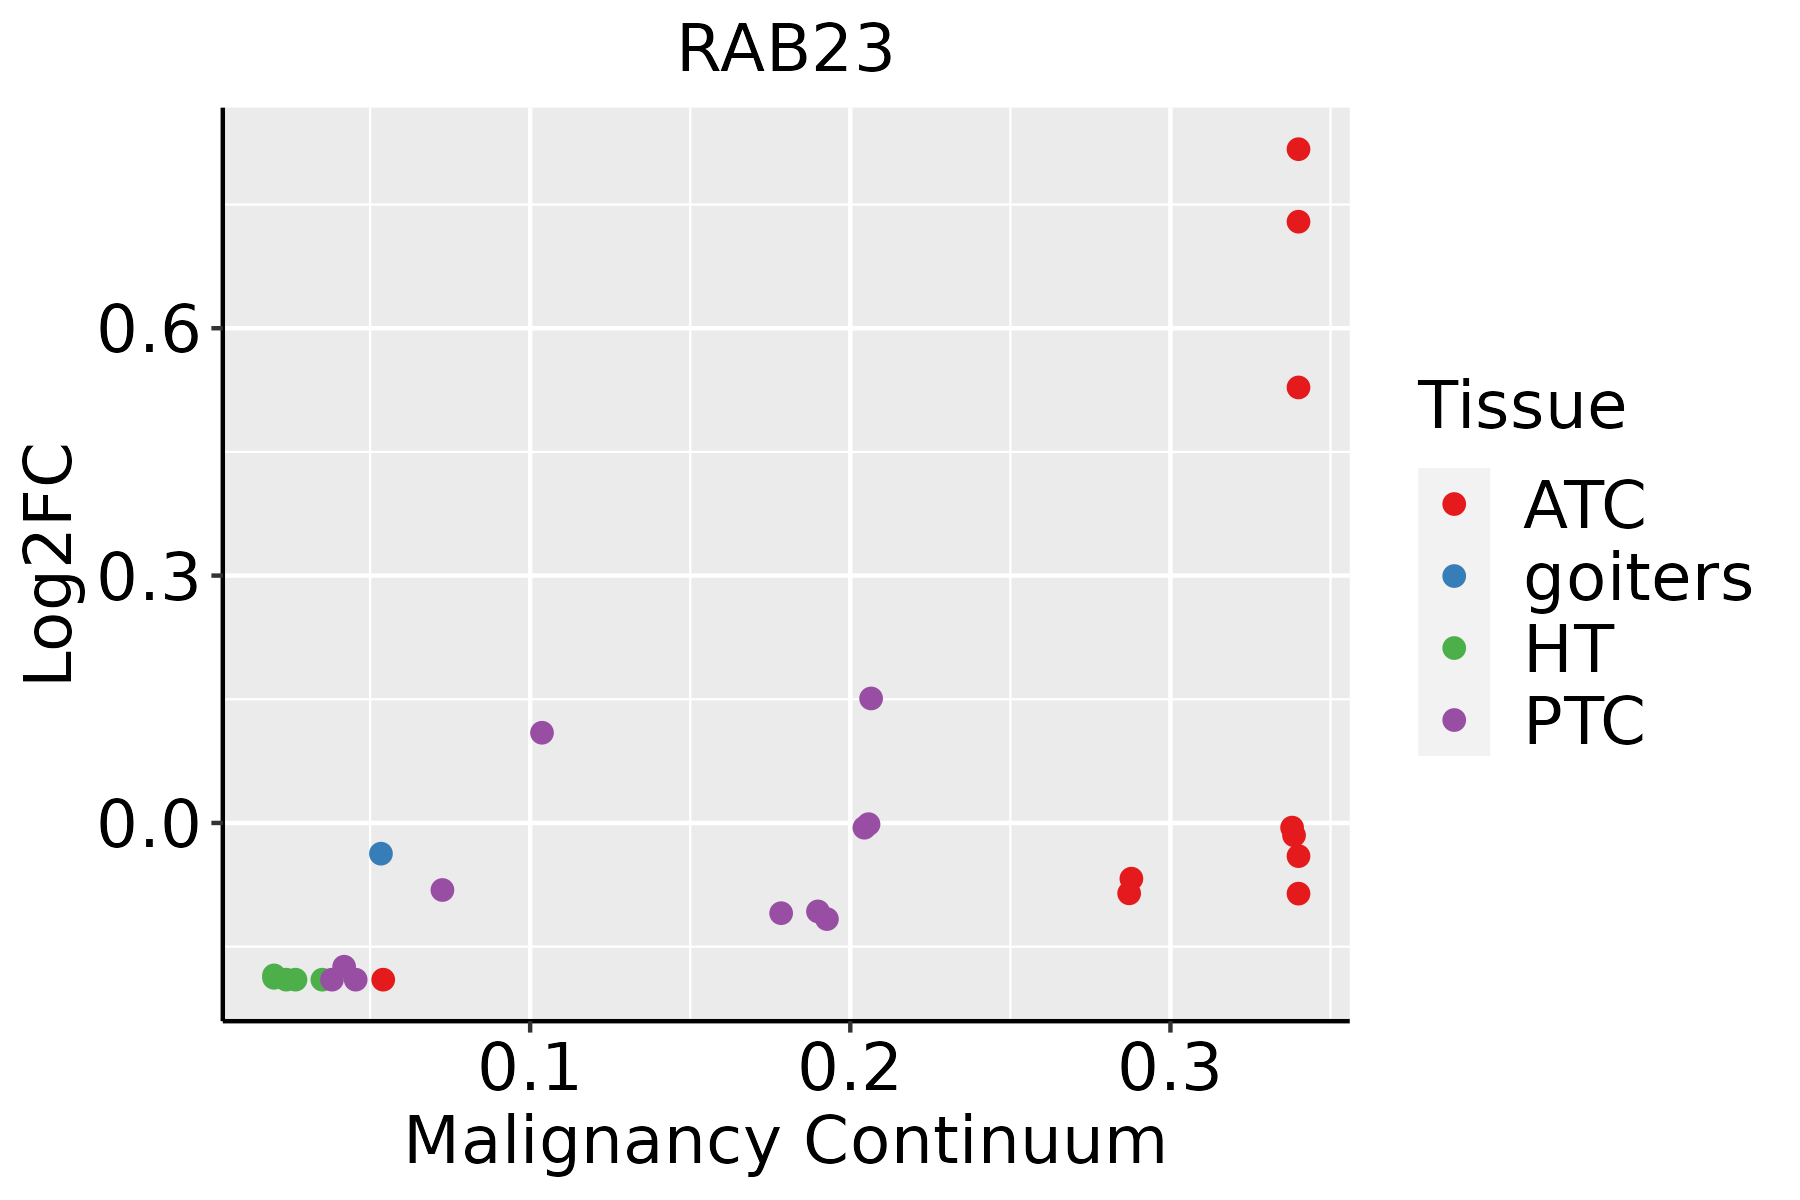 | ATC: Anaplastic thyroid cancer |
| HT: Hashimoto's thyroiditis | ||
| PTC: Papillary thyroid cancer |
| ∗log2FC in expression of this searched gene in stem-like cells from each diseased tissue sample relative to stem-like cells in normal samples in each tissue plotted against the malignancy continuum. Samples are colored based on if they are from different disease stage. |
Top |
Malignant transformation related pathway analysis |
| Find out the enriched GO biological processes and KEGG pathways involved in transition from healthy to precancer to cancer |
| Tissue | Disease Stage | Enriched GO biological Processes |
| Colorectum | AD |  |
| Colorectum | SER |  |
| Colorectum | MSS |  |
| Colorectum | MSI-H |  |
| Colorectum | FAP |  |
| ∗Top 15 enriched GO BP terms are showed in the bar plot of each disease state in each tissue. Each row represents a significant GO biological process which is colored according to the -log10(p.adjust). |
| Page: 1 2 3 4 5 6 7 8 9 |
| GO ID | Tissue | Disease Stage | Description | Gene Ratio | Bg Ratio | pvalue | p.adjust | Count |
| GO:004230616 | Thyroid | PTC | regulation of protein import into nucleus | 38/5968 | 60/18723 | 5.32e-07 | 8.58e-06 | 38 |
| GO:000919920 | Thyroid | PTC | ribonucleoside triphosphate metabolic process | 50/5968 | 89/18723 | 1.81e-06 | 2.50e-05 | 50 |
| GO:000616327 | Thyroid | PTC | purine nucleotide metabolic process | 170/5968 | 396/18723 | 2.02e-06 | 2.75e-05 | 170 |
| GO:000004514 | Thyroid | PTC | autophagosome assembly | 54/5968 | 99/18723 | 2.46e-06 | 3.22e-05 | 54 |
| GO:190503713 | Thyroid | PTC | autophagosome organization | 55/5968 | 103/18723 | 4.75e-06 | 5.79e-05 | 55 |
| GO:000675325 | Thyroid | PTC | nucleoside phosphate metabolic process | 205/5968 | 497/18723 | 5.24e-06 | 6.35e-05 | 205 |
| GO:000911725 | Thyroid | PTC | nucleotide metabolic process | 202/5968 | 489/18723 | 5.46e-06 | 6.60e-05 | 202 |
| GO:00903176 | Thyroid | PTC | negative regulation of intracellular protein transport | 26/5968 | 42/18723 | 5.91e-05 | 5.21e-04 | 26 |
| GO:00323877 | Thyroid | PTC | negative regulation of intracellular transport | 33/5968 | 58/18723 | 7.13e-05 | 6.19e-04 | 33 |
| GO:00603486 | Thyroid | PTC | bone development | 90/5968 | 205/18723 | 1.89e-04 | 1.42e-03 | 90 |
| GO:19049507 | Thyroid | PTC | negative regulation of establishment of protein localization | 61/5968 | 131/18723 | 3.01e-04 | 2.12e-03 | 61 |
| GO:00512246 | Thyroid | PTC | negative regulation of protein transport | 59/5968 | 127/18723 | 4.04e-04 | 2.71e-03 | 59 |
| GO:00468234 | Thyroid | PTC | negative regulation of nucleocytoplasmic transport | 14/5968 | 21/18723 | 1.11e-03 | 6.51e-03 | 14 |
| GO:00460395 | Thyroid | PTC | GTP metabolic process | 15/5968 | 25/18723 | 3.45e-03 | 1.67e-02 | 15 |
| GO:00510518 | Thyroid | PTC | negative regulation of transport | 176/5968 | 470/18723 | 5.44e-03 | 2.49e-02 | 176 |
| GO:007259429 | Thyroid | ATC | establishment of protein localization to organelle | 247/6293 | 422/18723 | 2.88e-26 | 1.40e-23 | 247 |
| GO:003238632 | Thyroid | ATC | regulation of intracellular transport | 203/6293 | 337/18723 | 6.16e-24 | 1.85e-21 | 203 |
| GO:003315726 | Thyroid | ATC | regulation of intracellular protein transport | 147/6293 | 229/18723 | 2.01e-21 | 4.38e-19 | 147 |
| GO:003450423 | Thyroid | ATC | protein localization to nucleus | 175/6293 | 290/18723 | 6.23e-21 | 1.23e-18 | 175 |
| GO:000691326 | Thyroid | ATC | nucleocytoplasmic transport | 180/6293 | 301/18723 | 6.97e-21 | 1.30e-18 | 180 |
| Page: 1 2 3 4 5 6 |
| Pathway ID | Tissue | Disease Stage | Description | Gene Ratio | Bg Ratio | pvalue | p.adjust | qvalue | Count |
| Page: 1 |
Top |
Cell-cell communication analysis |
| Identification of potential cell-cell interactions between two cell types and their ligand-receptor pairs for different disease states |
| Ligand | Receptor | LRpair | Pathway | Tissue | Disease Stage |
| Page: 1 |
Top |
Single-cell gene regulatory network inference analysis |
| Find out the significant the regulons (TFs) and the target genes of each regulon across cell types for different disease states |
| TF | Cell Type | Tissue | Disease Stage | Target Gene | RSS | Regulon Activity |
| ∗The dot plots of a searched regulon are shown for all cell subpopulations in each disease state of each tissue based on the regulon specific score inferred using pySCENIC and by calculating the average expression. |
| Page: 1 |
Top |
Somatic mutation of malignant transformation related genes |
| Annotation of somatic variants for genes involved in malignant transformation |
| Hugo Symbol | Variant Class | Variant Classification | dbSNP RS | HGVSc | HGVSp | HGVSp Short | SWISSPROT | BIOTYPE | SIFT | PolyPhen | Tumor Sample Barcode | Tissue | Histology | Sex | Age | Stage | Therapy Types | Drugs | Outcome |
| RAB23 | SNV | Missense_Mutation | c.269N>G | p.Ser90Cys | p.S90C | Q9ULC3 | protein_coding | deleterious(0) | probably_damaging(1) | TCGA-JW-A5VL-01 | Cervix | cervical & endocervical cancer | Female | <65 | I/II | Unknown | Unknown | SD | |
| RAB23 | SNV | Missense_Mutation | c.128G>A | p.Gly43Glu | p.G43E | Q9ULC3 | protein_coding | deleterious(0) | probably_damaging(1) | TCGA-AA-A00N-01 | Colorectum | colon adenocarcinoma | Male | >=65 | I/II | Unknown | Unknown | PD | |
| RAB23 | SNV | Missense_Mutation | c.422N>C | p.Lys141Thr | p.K141T | Q9ULC3 | protein_coding | deleterious(0.03) | possibly_damaging(0.447) | TCGA-CA-6717-01 | Colorectum | colon adenocarcinoma | Male | <65 | I/II | Chemotherapy | oxaliplatin | CR | |
| RAB23 | SNV | Missense_Mutation | novel | c.109N>T | p.Asp37Tyr | p.D37Y | Q9ULC3 | protein_coding | deleterious(0) | probably_damaging(0.998) | TCGA-A5-A0G1-01 | Endometrium | uterine corpus endometrioid carcinoma | Female | >=65 | I/II | Unknown | Unknown | SD |
| RAB23 | SNV | Missense_Mutation | c.422N>C | p.Lys141Thr | p.K141T | Q9ULC3 | protein_coding | deleterious(0.03) | possibly_damaging(0.447) | TCGA-A5-A2K5-01 | Endometrium | uterine corpus endometrioid carcinoma | Female | >=65 | I/II | Unknown | Unknown | SD | |
| RAB23 | SNV | Missense_Mutation | novel | c.18G>A | p.Met6Ile | p.M6I | Q9ULC3 | protein_coding | tolerated(0.37) | benign(0) | TCGA-AJ-A23O-01 | Endometrium | uterine corpus endometrioid carcinoma | Female | >=65 | I/II | Unknown | Unknown | SD |
| RAB23 | SNV | Missense_Mutation | rs145669565 | c.239N>A | p.Arg80Gln | p.R80Q | Q9ULC3 | protein_coding | deleterious(0.01) | probably_damaging(0.985) | TCGA-AP-A056-01 | Endometrium | uterine corpus endometrioid carcinoma | Female | <65 | I/II | Unknown | Unknown | SD |
| RAB23 | SNV | Missense_Mutation | c.328N>A | p.Glu110Lys | p.E110K | Q9ULC3 | protein_coding | deleterious(0) | probably_damaging(0.993) | TCGA-AP-A0LM-01 | Endometrium | uterine corpus endometrioid carcinoma | Female | <65 | III/IV | Chemotherapy | cisplatin | SD | |
| RAB23 | SNV | Missense_Mutation | novel | c.446G>T | p.Arg149Ile | p.R149I | Q9ULC3 | protein_coding | deleterious(0) | probably_damaging(0.987) | TCGA-B5-A1MX-01 | Endometrium | uterine corpus endometrioid carcinoma | Female | <65 | I/II | Hormone Therapy | megace | SD |
| RAB23 | SNV | Missense_Mutation | rs150655349 | c.25G>A | p.Ala9Thr | p.A9T | Q9ULC3 | protein_coding | tolerated(0.32) | benign(0.263) | TCGA-BK-A13B-01 | Endometrium | uterine corpus endometrioid carcinoma | Female | <65 | I/II | Unknown | Unknown | PD |
| Page: 1 2 3 |
Top |
Related drugs of malignant transformation related genes |
| Identification of chemicals and drugs interact with genes involved in malignant transfromation |
| (DGIdb 4.0) |
| Entrez ID | Symbol | Category | Interaction Types | Drug Claim Name | Drug Name | PMIDs |
| Page: 1 |

Copyright 2023-Present -The University of Texas Health Science Center at Houston |