| Tissue | Expression Dynamics | Abbreviation |
| Esophagus |  | ESCC: Esophageal squamous cell carcinoma |
| HGIN: High-grade intraepithelial neoplasias |
| LGIN: Low-grade intraepithelial neoplasias |
| Liver | 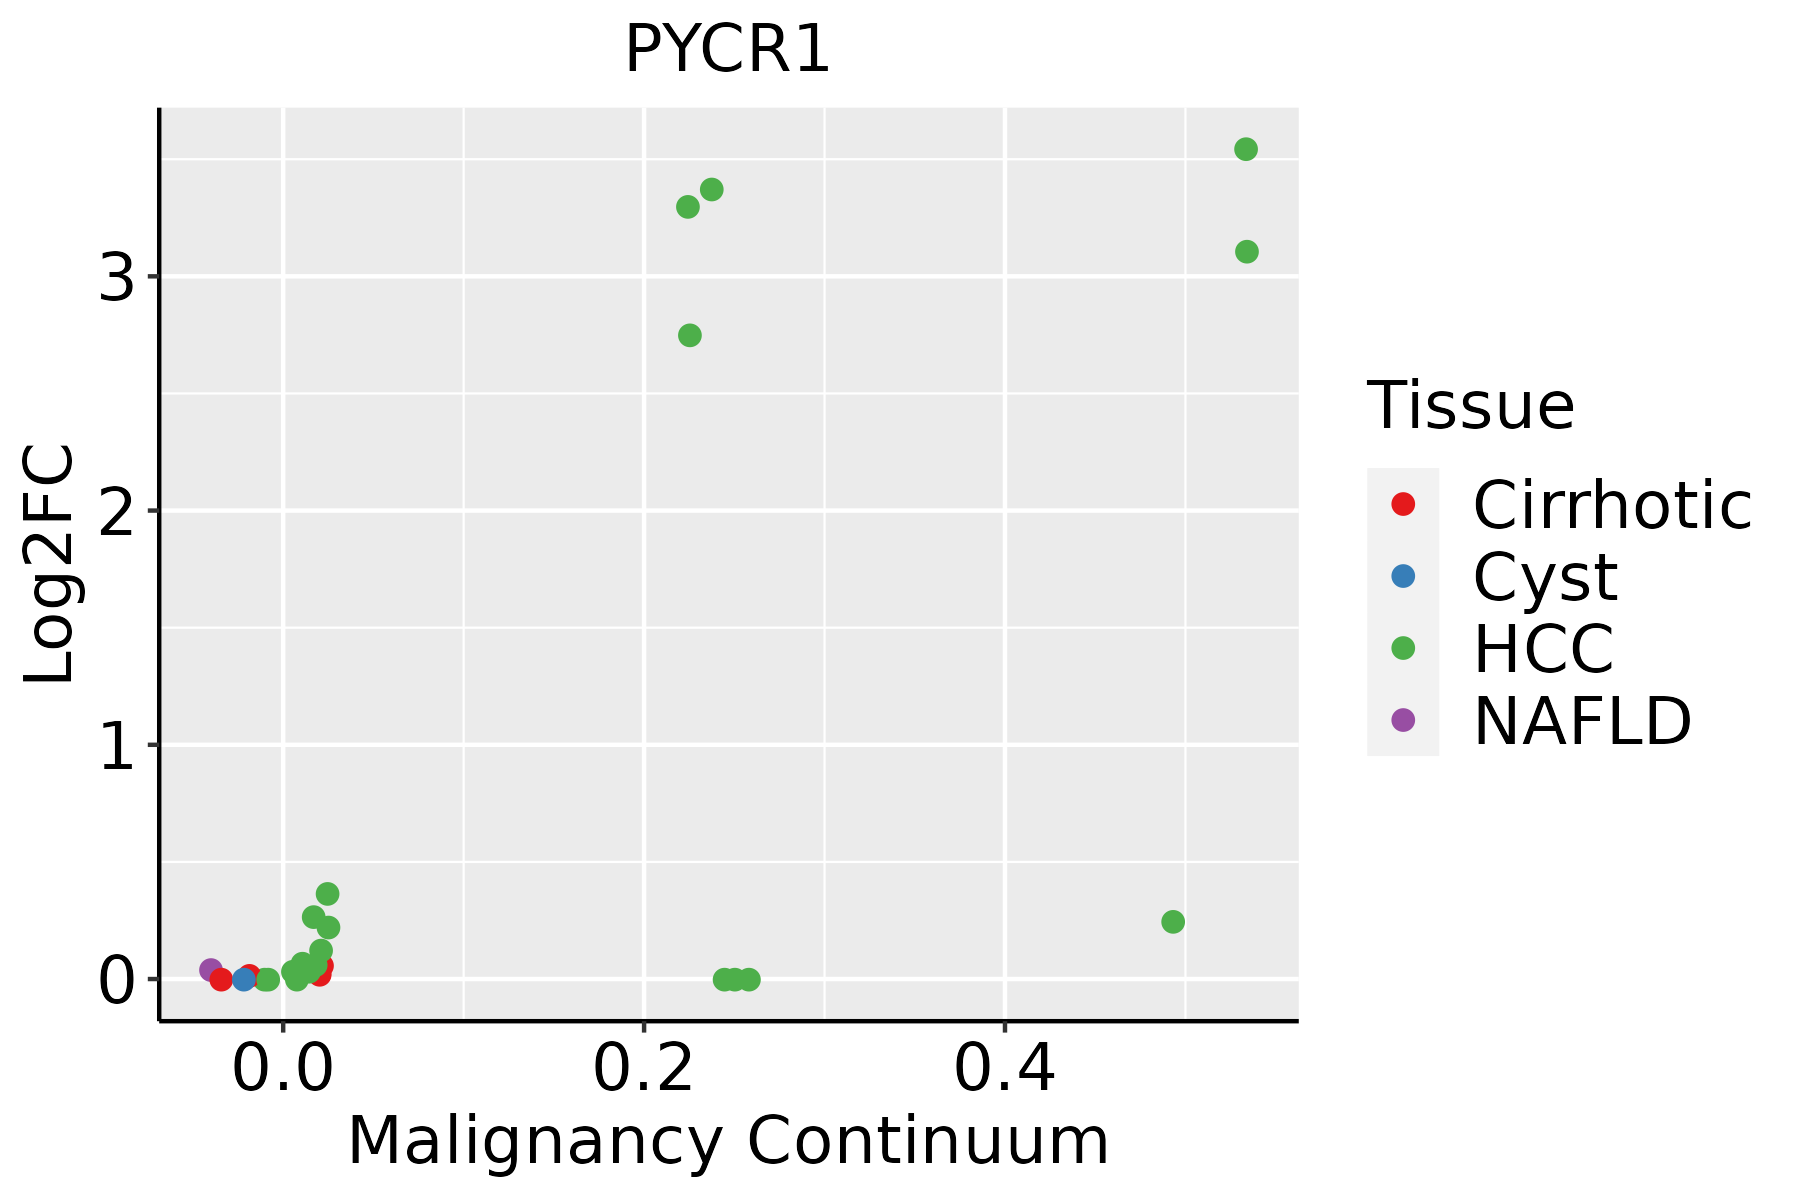 | HCC: Hepatocellular carcinoma |
| NAFLD: Non-alcoholic fatty liver disease |
| Oral Cavity | 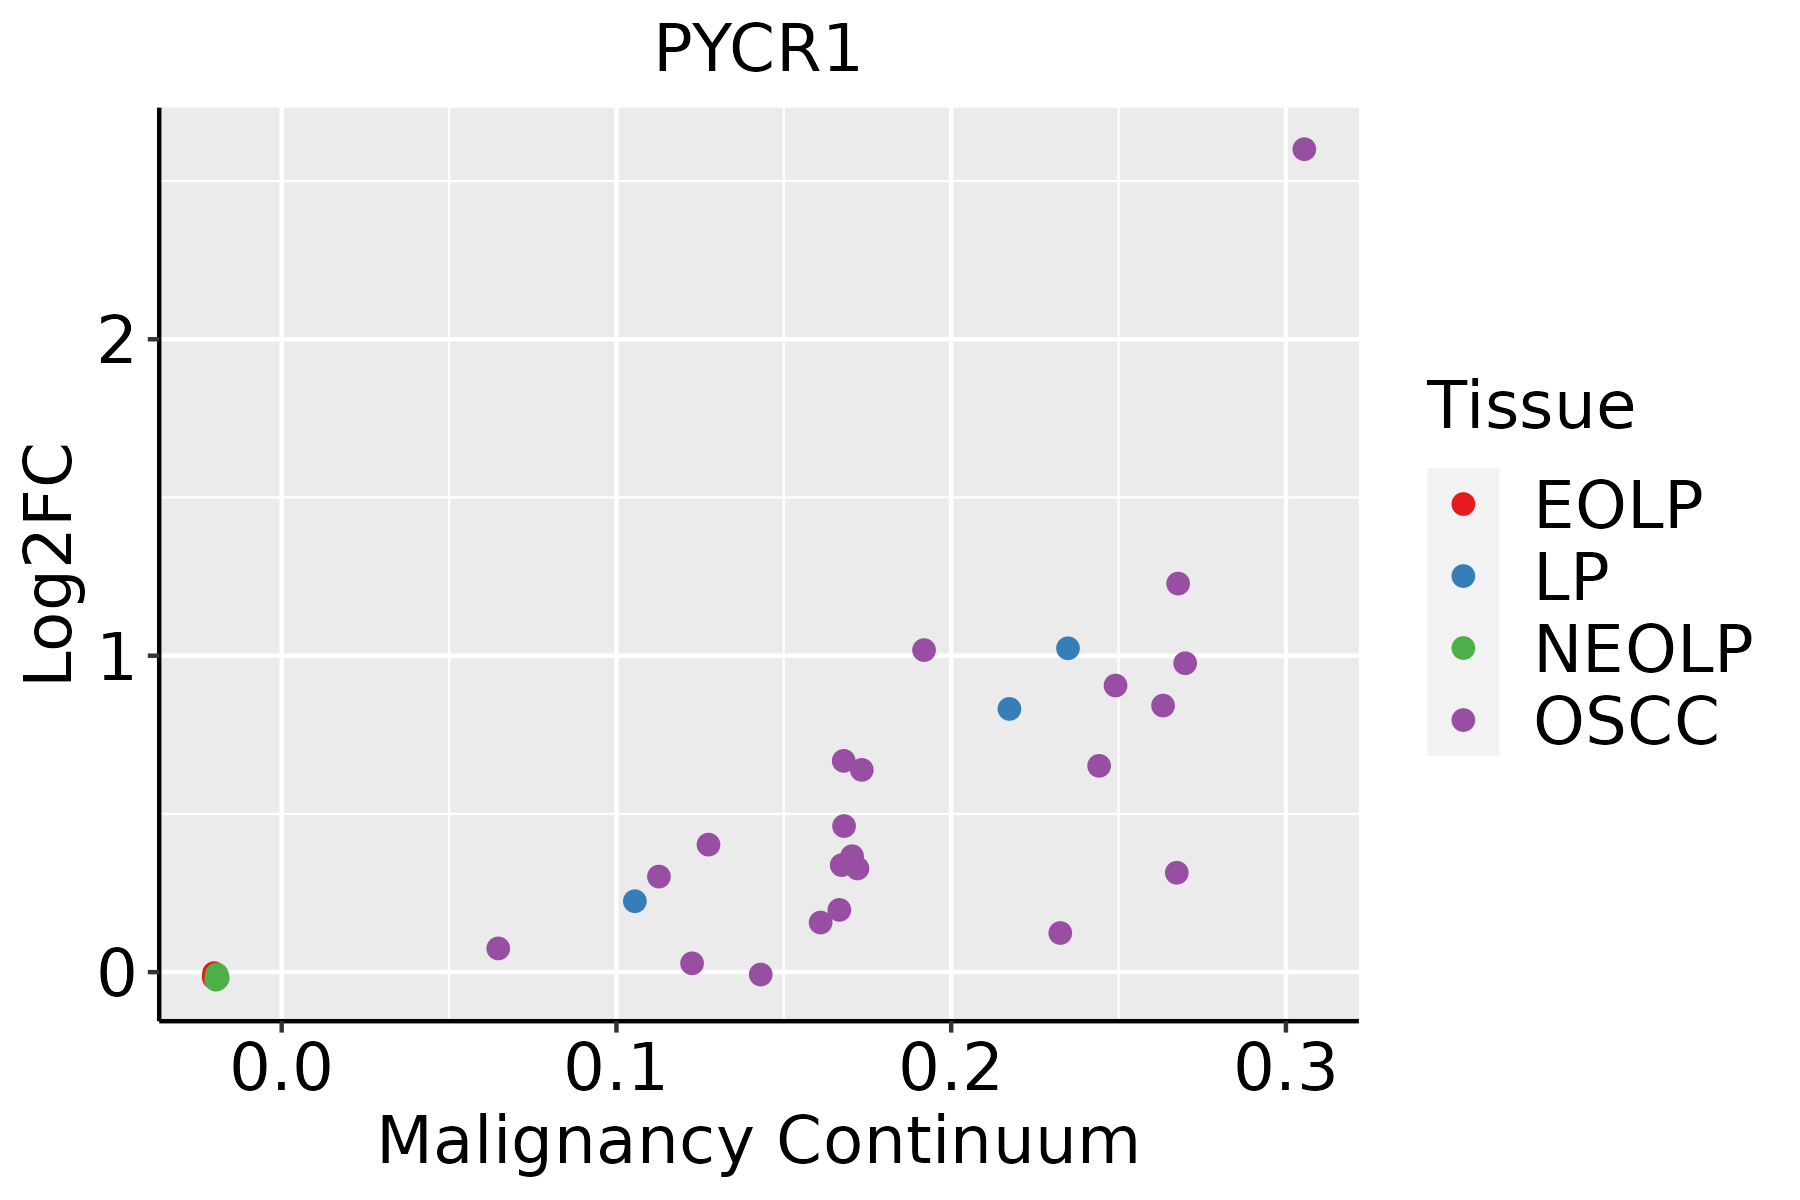 | EOLP: Erosive Oral lichen planus |
| LP: leukoplakia |
| NEOLP: Non-erosive oral lichen planus |
| OSCC: Oral squamous cell carcinoma |
| Prostate | 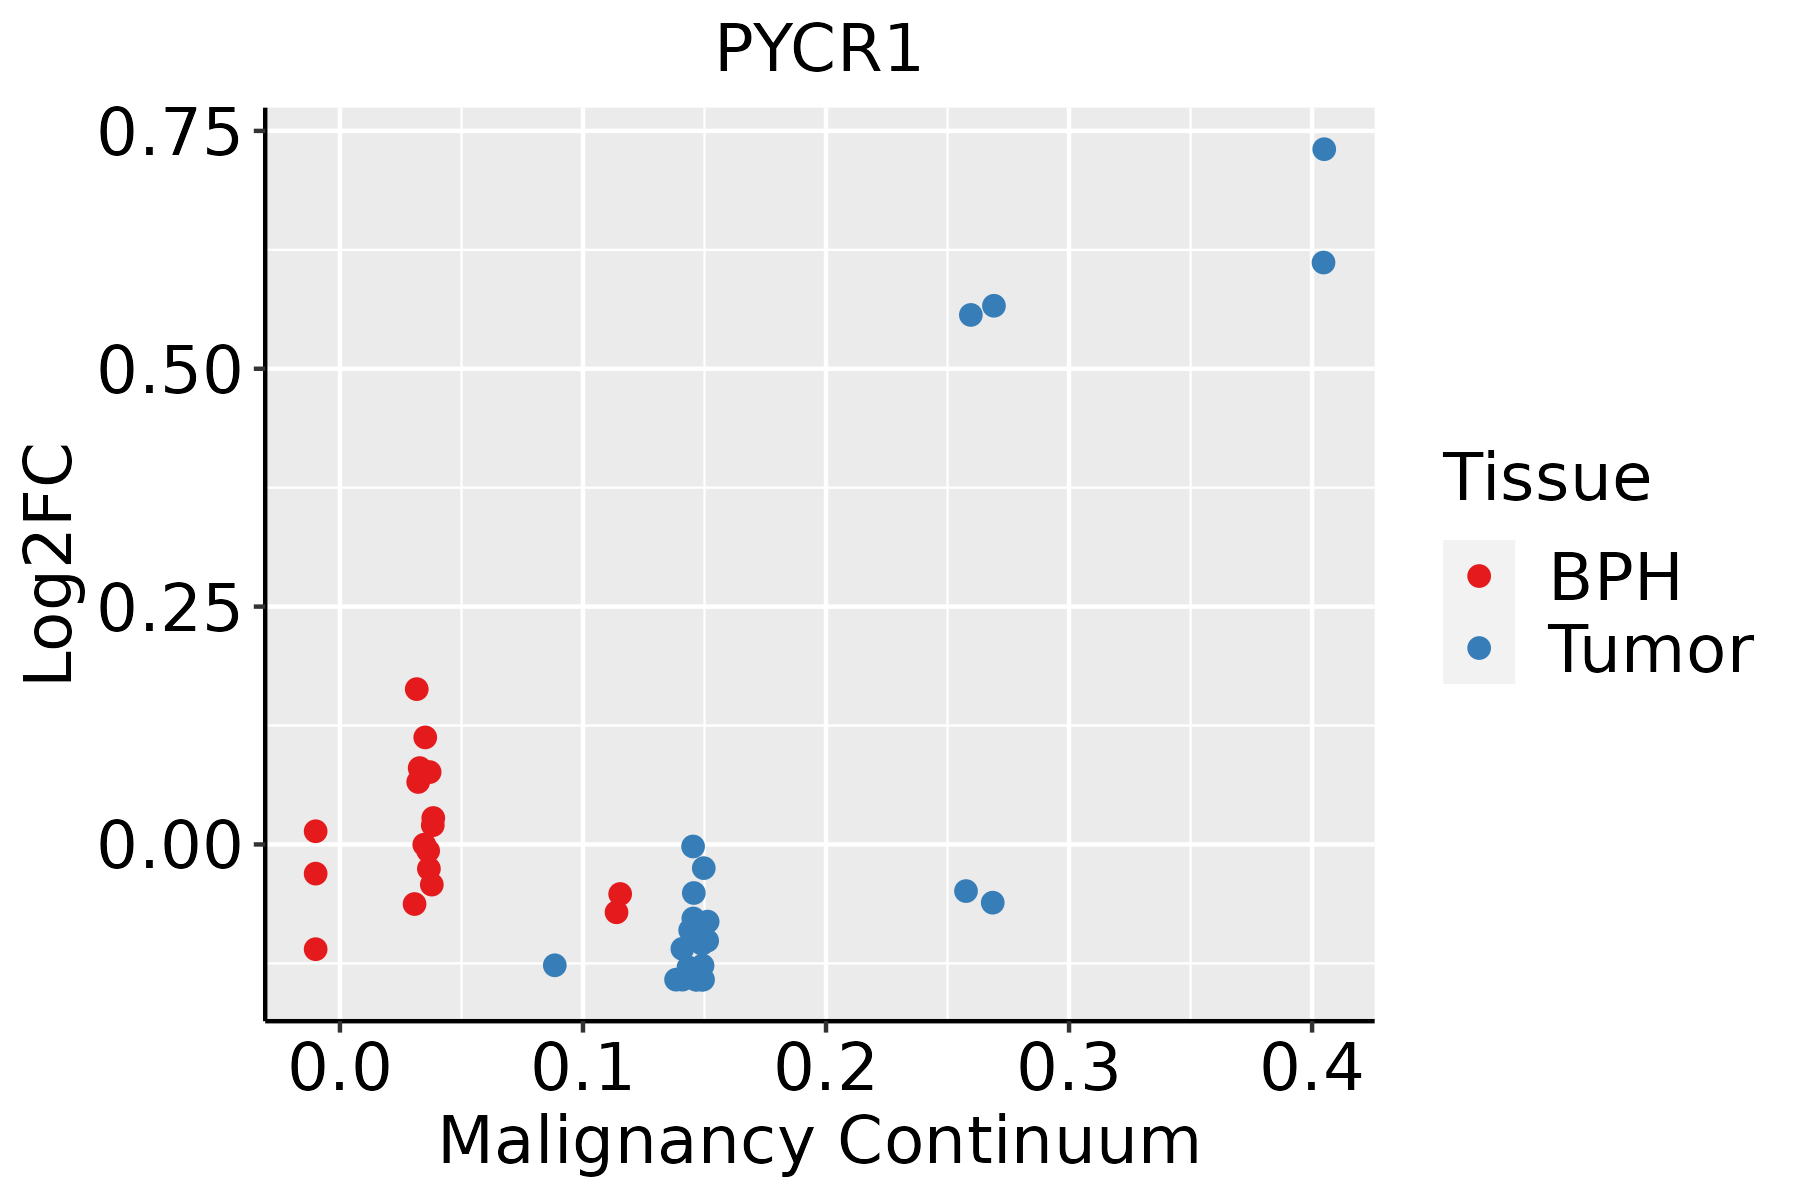 | BPH: Benign Prostatic Hyperplasia |
| Thyroid | 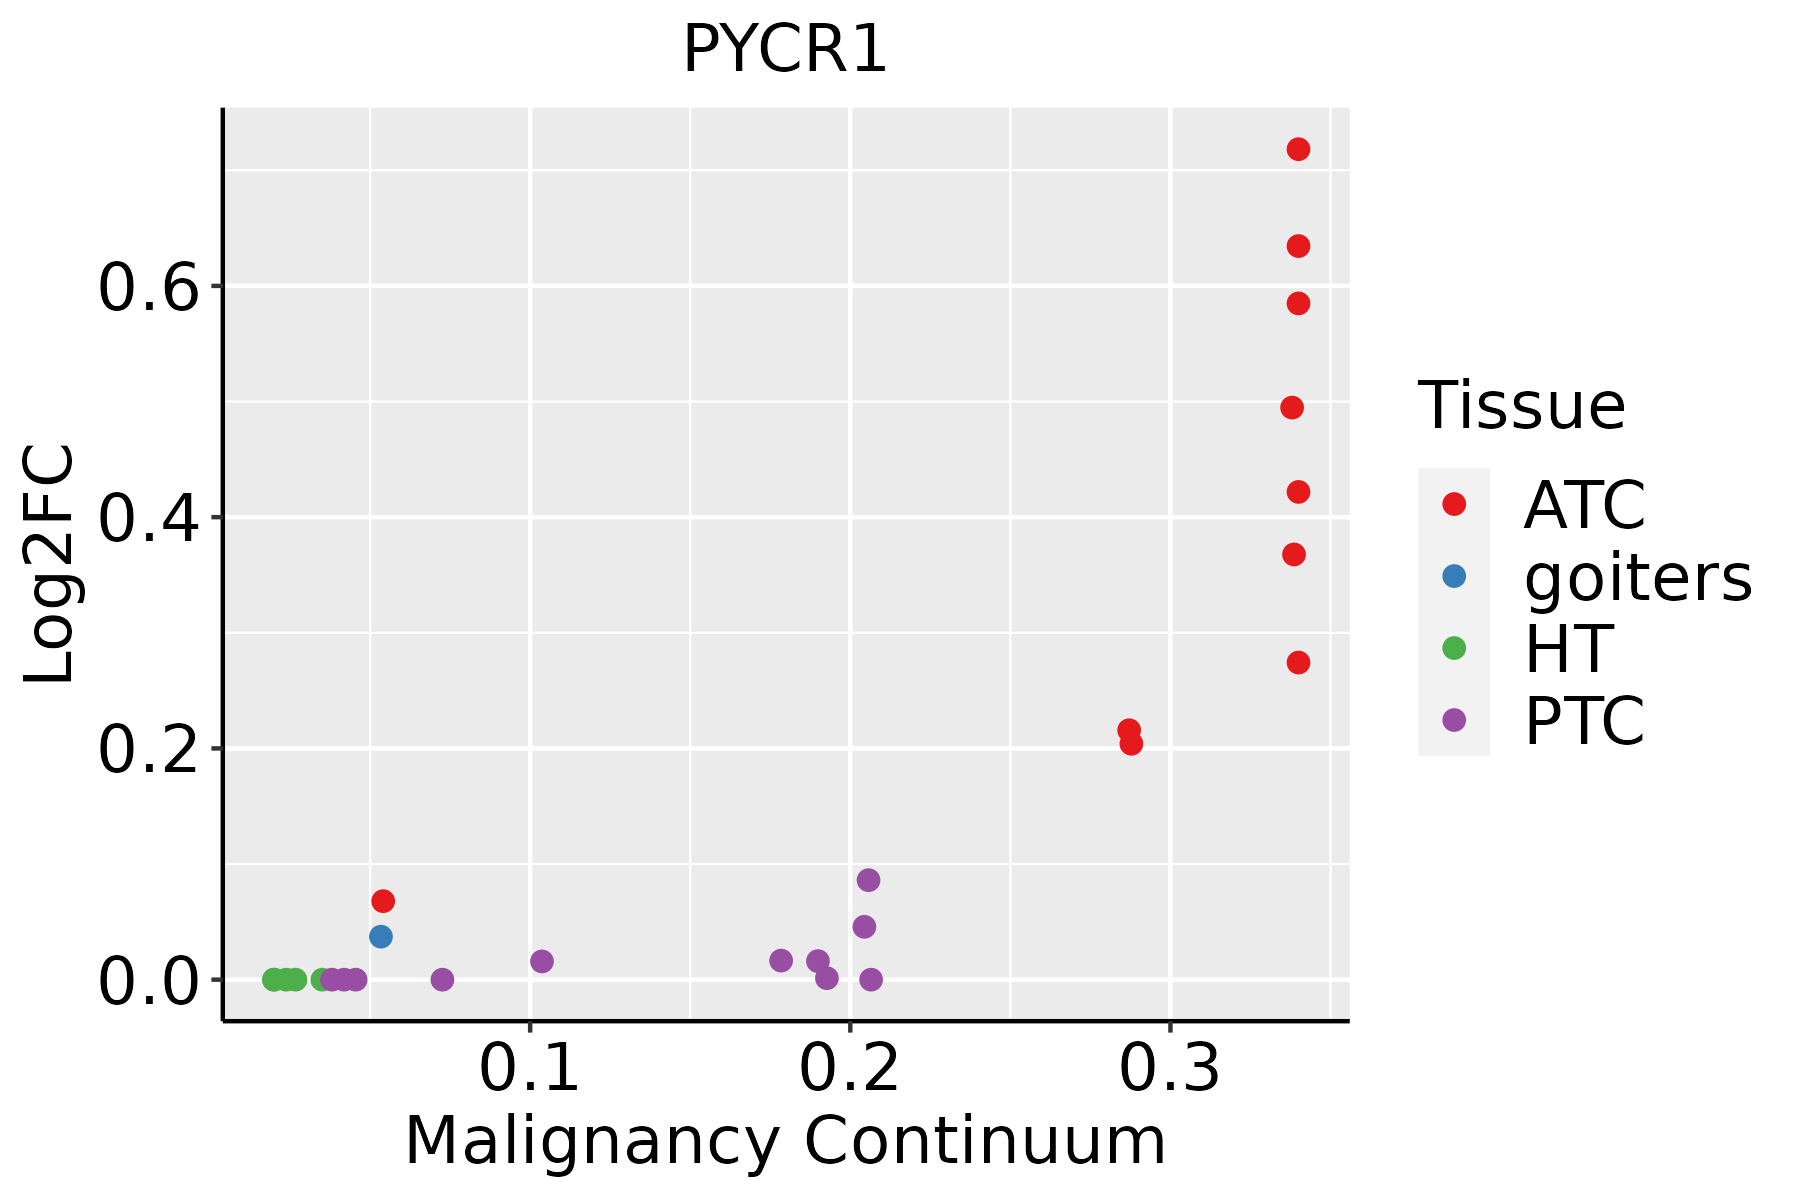 | ATC: Anaplastic thyroid cancer |
| HT: Hashimoto's thyroiditis |
| PTC: Papillary thyroid cancer |
| GO ID | Tissue | Disease Stage | Description | Gene Ratio | Bg Ratio | pvalue | p.adjust | Count |
| GO:000865211 | Oral cavity | LP | cellular amino acid biosynthetic process | 30/4623 | 76/18723 | 3.07e-03 | 2.09e-02 | 30 |
| GO:000697919 | Prostate | Tumor | response to oxidative stress | 144/3246 | 446/18723 | 5.75e-15 | 8.52e-13 | 144 |
| GO:006219719 | Prostate | Tumor | cellular response to chemical stress | 112/3246 | 337/18723 | 7.53e-13 | 7.67e-11 | 112 |
| GO:004254218 | Prostate | Tumor | response to hydrogen peroxide | 57/3246 | 146/18723 | 3.91e-10 | 2.06e-08 | 57 |
| GO:000030219 | Prostate | Tumor | response to reactive oxygen species | 76/3246 | 222/18723 | 7.85e-10 | 3.84e-08 | 76 |
| GO:003459919 | Prostate | Tumor | cellular response to oxidative stress | 92/3246 | 288/18723 | 8.68e-10 | 4.22e-08 | 92 |
| GO:003461418 | Prostate | Tumor | cellular response to reactive oxygen species | 50/3246 | 155/18723 | 4.22e-06 | 6.67e-05 | 50 |
| GO:190320117 | Prostate | Tumor | regulation of oxidative stress-induced cell death | 28/3246 | 74/18723 | 2.16e-05 | 2.77e-04 | 28 |
| GO:007030114 | Prostate | Tumor | cellular response to hydrogen peroxide | 33/3246 | 98/18723 | 6.69e-05 | 7.18e-04 | 33 |
| GO:003647318 | Prostate | Tumor | cell death in response to oxidative stress | 32/3246 | 95/18723 | 8.50e-05 | 8.48e-04 | 32 |
| GO:190040717 | Prostate | Tumor | regulation of cellular response to oxidative stress | 30/3246 | 89/18723 | 1.38e-04 | 1.27e-03 | 30 |
| GO:190288217 | Prostate | Tumor | regulation of response to oxidative stress | 31/3246 | 98/18723 | 3.90e-04 | 3.00e-03 | 31 |
| GO:005188115 | Prostate | Tumor | regulation of mitochondrial membrane potential | 25/3246 | 74/18723 | 4.62e-04 | 3.47e-03 | 25 |
| GO:190320214 | Prostate | Tumor | negative regulation of oxidative stress-induced cell death | 19/3246 | 53/18723 | 9.55e-04 | 6.20e-03 | 19 |
| GO:000697934 | Thyroid | ATC | response to oxidative stress | 246/6293 | 446/18723 | 2.98e-21 | 6.09e-19 | 246 |
| GO:006219734 | Thyroid | ATC | cellular response to chemical stress | 188/6293 | 337/18723 | 3.16e-17 | 3.07e-15 | 188 |
| GO:003459934 | Thyroid | ATC | cellular response to oxidative stress | 158/6293 | 288/18723 | 7.35e-14 | 3.94e-12 | 158 |
| GO:000030234 | Thyroid | ATC | response to reactive oxygen species | 128/6293 | 222/18723 | 1.38e-13 | 7.00e-12 | 128 |
| GO:004254233 | Thyroid | ATC | response to hydrogen peroxide | 92/6293 | 146/18723 | 3.12e-13 | 1.46e-11 | 92 |
| GO:003461433 | Thyroid | ATC | cellular response to reactive oxygen species | 87/6293 | 155/18723 | 6.54e-09 | 1.43e-07 | 87 |
| Pathway ID | Tissue | Disease Stage | Description | Gene Ratio | Bg Ratio | pvalue | p.adjust | qvalue | Count |
| hsa0123023 | Esophagus | ESCC | Biosynthesis of amino acids | 49/4205 | 75/8465 | 4.35e-03 | 1.12e-02 | 5.74e-03 | 49 |
| hsa0123033 | Esophagus | ESCC | Biosynthesis of amino acids | 49/4205 | 75/8465 | 4.35e-03 | 1.12e-02 | 5.74e-03 | 49 |
| hsa0123021 | Liver | HCC | Biosynthesis of amino acids | 53/4020 | 75/8465 | 3.79e-05 | 2.11e-04 | 1.18e-04 | 53 |
| hsa0033021 | Liver | HCC | Arginine and proline metabolism | 33/4020 | 50/8465 | 6.28e-03 | 1.77e-02 | 9.83e-03 | 33 |
| hsa0123031 | Liver | HCC | Biosynthesis of amino acids | 53/4020 | 75/8465 | 3.79e-05 | 2.11e-04 | 1.18e-04 | 53 |
| hsa0033031 | Liver | HCC | Arginine and proline metabolism | 33/4020 | 50/8465 | 6.28e-03 | 1.77e-02 | 9.83e-03 | 33 |
| hsa012305 | Oral cavity | OSCC | Biosynthesis of amino acids | 45/3704 | 75/8465 | 3.27e-03 | 8.23e-03 | 4.19e-03 | 45 |
| hsa0033010 | Oral cavity | OSCC | Arginine and proline metabolism | 30/3704 | 50/8465 | 1.50e-02 | 3.26e-02 | 1.66e-02 | 30 |
| hsa0123012 | Oral cavity | OSCC | Biosynthesis of amino acids | 45/3704 | 75/8465 | 3.27e-03 | 8.23e-03 | 4.19e-03 | 45 |
| hsa0033013 | Oral cavity | OSCC | Arginine and proline metabolism | 30/3704 | 50/8465 | 1.50e-02 | 3.26e-02 | 1.66e-02 | 30 |
| hsa0123022 | Oral cavity | LP | Biosynthesis of amino acids | 36/2418 | 75/8465 | 2.68e-04 | 1.51e-03 | 9.74e-04 | 36 |
| hsa0033023 | Oral cavity | LP | Arginine and proline metabolism | 26/2418 | 50/8465 | 3.94e-04 | 2.08e-03 | 1.34e-03 | 26 |
| hsa0123032 | Oral cavity | LP | Biosynthesis of amino acids | 36/2418 | 75/8465 | 2.68e-04 | 1.51e-03 | 9.74e-04 | 36 |
| hsa0033033 | Oral cavity | LP | Arginine and proline metabolism | 26/2418 | 50/8465 | 3.94e-04 | 2.08e-03 | 1.34e-03 | 26 |
| hsa0033022 | Prostate | Tumor | Arginine and proline metabolism | 19/1791 | 50/8465 | 4.73e-03 | 1.67e-02 | 1.03e-02 | 19 |
| hsa0033032 | Prostate | Tumor | Arginine and proline metabolism | 19/1791 | 50/8465 | 4.73e-03 | 1.67e-02 | 1.03e-02 | 19 |
| Hugo Symbol | Variant Class | Variant Classification | dbSNP RS | HGVSc | HGVSp | HGVSp Short | SWISSPROT | BIOTYPE | SIFT | PolyPhen | Tumor Sample Barcode | Tissue | Histology | Sex | Age | Stage | Therapy Types | Drugs | Outcome |
| PYCR1 | SNV | Missense_Mutation | novel | c.373N>A | p.Gly125Ser | p.G125S | P32322 | protein_coding | deleterious(0) | probably_damaging(1) | TCGA-AC-A23G-01 | Breast | breast invasive carcinoma | Female | >=65 | I/II | Chemotherapy | cytoxan | CR |
| PYCR1 | deletion | Frame_Shift_Del | novel | c.848delN | p.Asn283ThrfsTer35 | p.N283Tfs*35 | P32322 | protein_coding | | | TCGA-D8-A27V-01 | Breast | breast invasive carcinoma | Female | <65 | I/II | Hormone Therapy | tamoxiphen | SD |
| PYCR1 | deletion | Frame_Shift_Del | novel | c.115delG | p.Ala39LeufsTer19 | p.A39Lfs*19 | P32322 | protein_coding | | | TCGA-S3-AA17-01 | Breast | breast invasive carcinoma | Female | <65 | I/II | Hormone Therapy | anastrozole | SD |
| PYCR1 | SNV | Missense_Mutation | rs281875318 | c.850N>A | p.Ala284Thr | p.A284T | P32322 | protein_coding | deleterious(0) | probably_damaging(0.999) | TCGA-2W-A8YY-01 | Cervix | cervical & endocervical cancer | Female | <65 | I/II | Chemotherapy | cisplatin | CR |
| PYCR1 | SNV | Missense_Mutation | novel | c.295C>A | p.Pro99Thr | p.P99T | P32322 | protein_coding | deleterious(0) | probably_damaging(0.968) | TCGA-Q1-A6DT-01 | Cervix | cervical & endocervical cancer | Female | <65 | I/II | Unknown | Unknown | PD |
| PYCR1 | SNV | Missense_Mutation | rs746669423 | c.872N>A | p.Arg291His | p.R291H | P32322 | protein_coding | deleterious(0) | probably_damaging(0.99) | TCGA-VS-A94Z-01 | Cervix | cervical & endocervical cancer | Female | <65 | I/II | Chemotherapy | cisplatin | CR |
| PYCR1 | SNV | Missense_Mutation | rs748950222 | c.691N>T | p.Arg231Cys | p.R231C | P32322 | protein_coding | deleterious(0) | possibly_damaging(0.907) | TCGA-NH-A5IV-01 | Colorectum | colon adenocarcinoma | Female | >=65 | I/II | Unknown | Unknown | SD |
| PYCR1 | SNV | Missense_Mutation | rs771644421 | c.376N>A | p.Val126Ile | p.V126I | P32322 | protein_coding | tolerated(0.28) | benign(0.081) | TCGA-AP-A059-01 | Endometrium | uterine corpus endometrioid carcinoma | Female | >=65 | I/II | Unknown | Unknown | SD |
| PYCR1 | SNV | Missense_Mutation | novel | c.1027G>A | p.Ala343Thr | p.A343T | P32322 | protein_coding | tolerated_low_confidence(0.25) | benign(0.007) | TCGA-B5-A1MX-01 | Endometrium | uterine corpus endometrioid carcinoma | Female | <65 | I/II | Hormone Therapy | megace | SD |
| PYCR1 | SNV | Missense_Mutation | rs139751598 | c.616G>A | p.Ala206Thr | p.A206T | P32322 | protein_coding | deleterious(0) | probably_damaging(0.918) | TCGA-B5-A3FC-01 | Endometrium | uterine corpus endometrioid carcinoma | Female | <65 | I/II | Unknown | Unknown | SD |


