
|
|||||
|
 | |
| |
| |
| |
| |
| |
|
Gene: PROX1 |
Gene summary for PROX1 |
| Gene information | Species | Human | Gene symbol | PROX1 | Gene ID | 5629 |
| Gene name | prospero homeobox 1 | |
| Gene Alias | PROX1 | |
| Cytomap | 1q32.3 | |
| Gene Type | protein-coding | GO ID | GO:0000075 | UniProtAcc | Q92786 |
Top |
Malignant transformation analysis |
| Identification of the aberrant gene expression in precancerous and cancerous lesions by comparing the gene expression of stem-like cells in diseased tissues with normal stem cells |
| Entrez ID | Symbol | Replicates | Species | Organ | Tissue | Adj P-value | Log2FC | Malignancy |
| 5629 | PROX1 | HTA11_866_3004761011 | Human | Colorectum | AD | 7.47e-08 | 4.54e-01 | 0.096 |
| 5629 | PROX1 | HTA11_7696_3000711011 | Human | Colorectum | AD | 1.01e-10 | 4.53e-01 | 0.0674 |
| 5629 | PROX1 | HTA11_99999970781_79442 | Human | Colorectum | MSS | 5.19e-10 | 4.18e-01 | 0.294 |
| 5629 | PROX1 | HTA11_99999965062_69753 | Human | Colorectum | MSI-H | 9.16e-10 | 1.80e+00 | 0.3487 |
| 5629 | PROX1 | HTA11_99999965104_69814 | Human | Colorectum | MSS | 1.63e-08 | 6.30e-01 | 0.281 |
| 5629 | PROX1 | HTA11_99999971662_82457 | Human | Colorectum | MSS | 8.41e-08 | 4.73e-01 | 0.3859 |
| 5629 | PROX1 | HTA11_99999974143_84620 | Human | Colorectum | MSS | 3.92e-04 | 2.48e-01 | 0.3005 |
| 5629 | PROX1 | A001-C-119 | Human | Colorectum | FAP | 1.33e-02 | 4.88e-01 | -0.1557 |
| 5629 | PROX1 | A002-C-021 | Human | Colorectum | FAP | 5.21e-19 | 6.84e-01 | 0.1171 |
| 5629 | PROX1 | CRC-1-8810 | Human | Colorectum | CRC | 7.08e-18 | 7.51e-01 | 0.6257 |
| 5629 | PROX1 | CRC-3-11773 | Human | Colorectum | CRC | 1.15e-02 | 4.47e-01 | 0.2564 |
| 5629 | PROX1 | NAFLD1 | Human | Liver | NAFLD | 2.52e-05 | 8.90e-01 | -0.04 |
| 5629 | PROX1 | S43 | Human | Liver | Cirrhotic | 1.08e-12 | -1.83e-01 | -0.0187 |
| 5629 | PROX1 | HCC1_Meng | Human | Liver | HCC | 4.48e-90 | -9.78e-02 | 0.0246 |
| 5629 | PROX1 | HCC2_Meng | Human | Liver | HCC | 1.54e-15 | -5.45e-01 | 0.0107 |
| 5629 | PROX1 | cirrhotic1 | Human | Liver | Cirrhotic | 1.97e-11 | -1.52e-01 | 0.0202 |
| 5629 | PROX1 | cirrhotic2 | Human | Liver | Cirrhotic | 5.19e-22 | 5.85e-02 | 0.0201 |
| 5629 | PROX1 | cirrhotic3 | Human | Liver | Cirrhotic | 7.02e-10 | -2.49e-01 | 0.0215 |
| 5629 | PROX1 | HCC1 | Human | Liver | HCC | 4.71e-11 | 5.27e+00 | 0.5336 |
| 5629 | PROX1 | Pt13.a | Human | Liver | HCC | 7.00e-08 | -3.10e-01 | 0.021 |
| Page: 1 2 |
| Tissue | Expression Dynamics | Abbreviation |
| Colorectum (GSE201348) |  | FAP: Familial adenomatous polyposis |
| CRC: Colorectal cancer | ||
| Colorectum (HTA11) |  | AD: Adenomas |
| SER: Sessile serrated lesions | ||
| MSI-H: Microsatellite-high colorectal cancer | ||
| MSS: Microsatellite stable colorectal cancer | ||
| Liver | 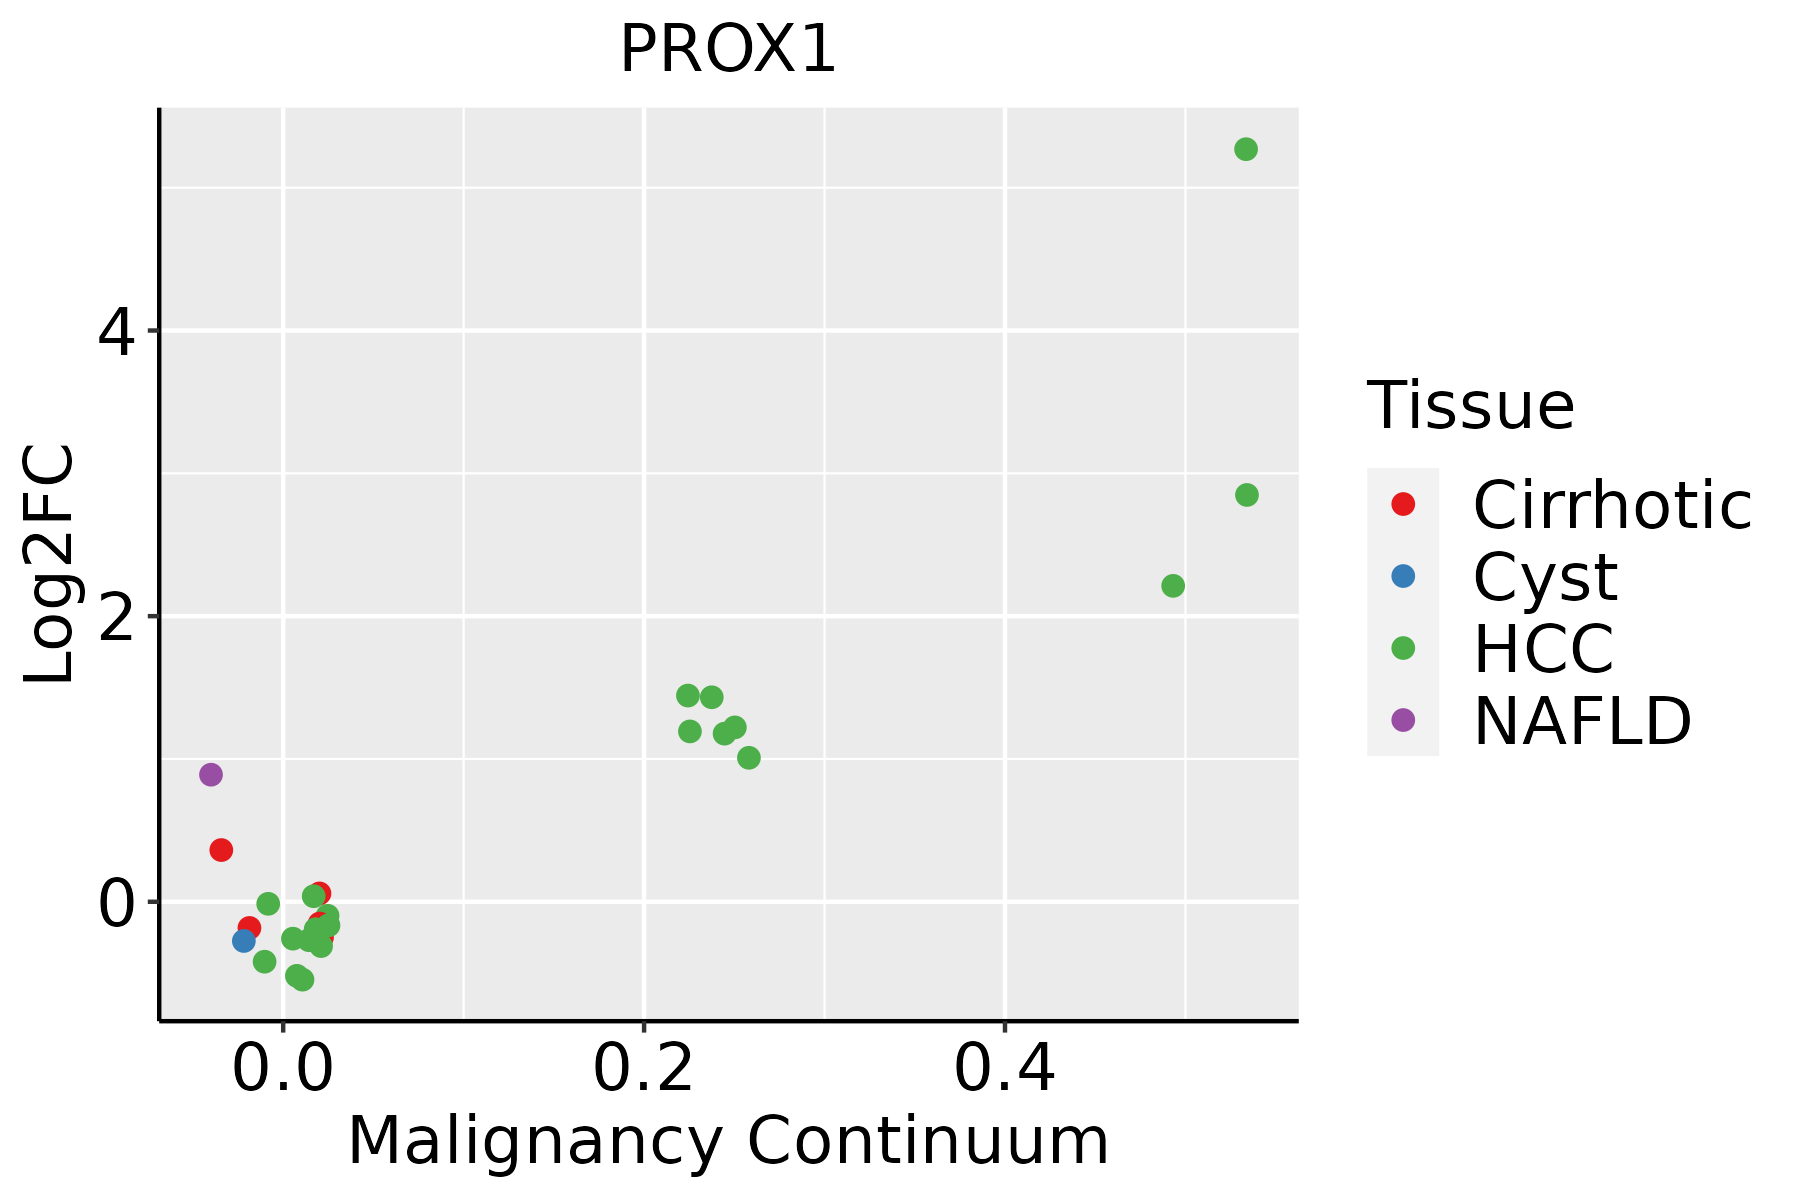 | HCC: Hepatocellular carcinoma |
| NAFLD: Non-alcoholic fatty liver disease |
| ∗log2FC in expression of this searched gene in stem-like cells from each diseased tissue sample relative to stem-like cells in normal samples in each tissue plotted against the malignancy continuum. Samples are colored based on if they are from different disease stage. |
Top |
Malignant transformation related pathway analysis |
| Find out the enriched GO biological processes and KEGG pathways involved in transition from healthy to precancer to cancer |
| Tissue | Disease Stage | Enriched GO biological Processes |
| Colorectum | AD |  |
| Colorectum | SER |  |
| Colorectum | MSS |  |
| Colorectum | MSI-H |  |
| Colorectum | FAP |  |
| ∗Top 15 enriched GO BP terms are showed in the bar plot of each disease state in each tissue. Each row represents a significant GO biological process which is colored according to the -log10(p.adjust). |
| Page: 1 2 3 4 5 6 7 8 9 |
| GO ID | Tissue | Disease Stage | Description | Gene Ratio | Bg Ratio | pvalue | p.adjust | Count |
| GO:00190792 | Colorectum | MSS | viral genome replication | 49/3467 | 131/18723 | 2.73e-07 | 1.11e-05 | 49 |
| GO:00076232 | Colorectum | MSS | circadian rhythm | 69/3467 | 210/18723 | 4.22e-07 | 1.67e-05 | 69 |
| GO:00485112 | Colorectum | MSS | rhythmic process | 89/3467 | 298/18723 | 1.17e-06 | 3.96e-05 | 89 |
| GO:00610082 | Colorectum | MSS | hepaticobiliary system development | 51/3467 | 150/18723 | 4.33e-06 | 1.23e-04 | 51 |
| GO:00018892 | Colorectum | MSS | liver development | 50/3467 | 147/18723 | 5.28e-06 | 1.44e-04 | 50 |
| GO:00507922 | Colorectum | MSS | regulation of viral process | 54/3467 | 164/18723 | 6.79e-06 | 1.77e-04 | 54 |
| GO:00316672 | Colorectum | MSS | response to nutrient levels | 125/3467 | 474/18723 | 1.24e-05 | 2.88e-04 | 125 |
| GO:00226122 | Colorectum | MSS | gland morphogenesis | 41/3467 | 118/18723 | 2.02e-05 | 4.30e-04 | 41 |
| GO:00336742 | Colorectum | MSS | positive regulation of kinase activity | 122/3467 | 467/18723 | 2.50e-05 | 5.21e-04 | 122 |
| GO:00458602 | Colorectum | MSS | positive regulation of protein kinase activity | 102/3467 | 386/18723 | 6.93e-05 | 1.20e-03 | 102 |
| GO:19039002 | Colorectum | MSS | regulation of viral life cycle | 47/3467 | 148/18723 | 7.20e-05 | 1.21e-03 | 47 |
| GO:00605621 | Colorectum | MSS | epithelial tube morphogenesis | 88/3467 | 325/18723 | 8.45e-05 | 1.37e-03 | 88 |
| GO:00016672 | Colorectum | MSS | ameboidal-type cell migration | 120/3467 | 475/18723 | 1.37e-04 | 2.05e-03 | 120 |
| GO:00450691 | Colorectum | MSS | regulation of viral genome replication | 30/3467 | 85/18723 | 1.81e-04 | 2.57e-03 | 30 |
| GO:00719002 | Colorectum | MSS | regulation of protein serine/threonine kinase activity | 93/3467 | 359/18723 | 2.98e-04 | 3.91e-03 | 93 |
| GO:00901322 | Colorectum | MSS | epithelium migration | 93/3467 | 360/18723 | 3.30e-04 | 4.24e-03 | 93 |
| GO:00106312 | Colorectum | MSS | epithelial cell migration | 92/3467 | 357/18723 | 3.87e-04 | 4.86e-03 | 92 |
| GO:00427522 | Colorectum | MSS | regulation of circadian rhythm | 38/3467 | 121/18723 | 4.33e-04 | 5.23e-03 | 38 |
| GO:00106322 | Colorectum | MSS | regulation of epithelial cell migration | 77/3467 | 292/18723 | 5.39e-04 | 6.04e-03 | 77 |
| GO:00901302 | Colorectum | MSS | tissue migration | 93/3467 | 365/18723 | 5.42e-04 | 6.06e-03 | 93 |
| Page: 1 2 3 4 5 6 7 8 9 10 11 12 13 14 15 16 17 18 19 20 21 22 23 |
| Pathway ID | Tissue | Disease Stage | Description | Gene Ratio | Bg Ratio | pvalue | p.adjust | qvalue | Count |
| Page: 1 |
Top |
Cell-cell communication analysis |
| Identification of potential cell-cell interactions between two cell types and their ligand-receptor pairs for different disease states |
| Ligand | Receptor | LRpair | Pathway | Tissue | Disease Stage |
| Page: 1 |
Top |
Single-cell gene regulatory network inference analysis |
| Find out the significant the regulons (TFs) and the target genes of each regulon across cell types for different disease states |
| TF | Cell Type | Tissue | Disease Stage | Target Gene | RSS | Regulon Activity |
| PROX1 | STM | Colorectum | CRC | DACH1,NKD1,SOX4, etc. | 3.54e-01 |  |
| PROX1 | TUF | Colorectum | CRC | DACH1,NKD1,SOX4, etc. | 4.81e-02 | |
| PROX1 | STM | Colorectum | FAP | DACH1,NKD1,SOX4, etc. | 2.21e-01 |  |
| PROX1 | LYMEND | Skin | ADJ | TFF3,TFPI,MMRN1, etc. | 3.37e-01 |  |
| PROX1 | LYMEND | Skin | cSCC | TFF3,TFPI,MMRN1, etc. | 2.77e-01 |  |
| PROX1 | LYMEND | Skin | Healthy | TFF3,TFPI,MMRN1, etc. | 1.15e-01 |  |
| PROX1 | PVA | Skin | SCCIS | TFF3,TFPI,MMRN1, etc. | 4.40e-01 |  |
| ∗The dot plots of a searched regulon are shown for all cell subpopulations in each disease state of each tissue based on the regulon specific score inferred using pySCENIC and by calculating the average expression. |
| Page: 1 |
Top |
Somatic mutation of malignant transformation related genes |
| Annotation of somatic variants for genes involved in malignant transformation |
| Hugo Symbol | Variant Class | Variant Classification | dbSNP RS | HGVSc | HGVSp | HGVSp Short | SWISSPROT | BIOTYPE | SIFT | PolyPhen | Tumor Sample Barcode | Tissue | Histology | Sex | Age | Stage | Therapy Types | Drugs | Outcome |
| PROX1 | SNV | Missense_Mutation | c.860N>C | p.Arg287Thr | p.R287T | Q92786 | protein_coding | tolerated(0.13) | benign(0.044) | TCGA-A2-A0YK-01 | Breast | breast invasive carcinoma | Female | <65 | I/II | Chemotherapy | cytoxan | SD | |
| PROX1 | SNV | Missense_Mutation | c.1630N>G | p.Pro544Ala | p.P544A | Q92786 | protein_coding | tolerated(0.94) | benign(0.029) | TCGA-A2-A25B-01 | Breast | breast invasive carcinoma | Female | <65 | I/II | Chemotherapy | taxotere | PD | |
| PROX1 | SNV | Missense_Mutation | c.1264N>A | p.Asp422Asn | p.D422N | Q92786 | protein_coding | tolerated(0.24) | benign(0.021) | TCGA-A8-A09Z-01 | Breast | breast invasive carcinoma | Female | >=65 | I/II | Unknown | Unknown | SD | |
| PROX1 | SNV | Missense_Mutation | novel | c.1666A>C | p.Lys556Gln | p.K556Q | Q92786 | protein_coding | deleterious(0) | probably_damaging(0.997) | TCGA-AN-A046-01 | Breast | breast invasive carcinoma | Female | >=65 | I/II | Unknown | Unknown | SD |
| PROX1 | SNV | Missense_Mutation | c.1565N>T | p.Thr522Met | p.T522M | Q92786 | protein_coding | deleterious(0.05) | possibly_damaging(0.714) | TCGA-AN-A0FL-01 | Breast | breast invasive carcinoma | Female | <65 | I/II | Unknown | Unknown | SD | |
| PROX1 | SNV | Missense_Mutation | c.811N>T | p.Asp271Tyr | p.D271Y | Q92786 | protein_coding | deleterious(0) | probably_damaging(0.999) | TCGA-B6-A0IB-01 | Breast | breast invasive carcinoma | Female | <65 | III/IV | Unknown | Unknown | PD | |
| PROX1 | SNV | Missense_Mutation | c.1243G>A | p.Val415Ile | p.V415I | Q92786 | protein_coding | tolerated(0.06) | probably_damaging(0.989) | TCGA-BH-A0HK-01 | Breast | breast invasive carcinoma | Female | >=65 | I/II | Hormone Therapy | arimidex | SD | |
| PROX1 | SNV | Missense_Mutation | rs773788297 | c.1933G>A | p.Asp645Asn | p.D645N | Q92786 | protein_coding | tolerated(0.05) | possibly_damaging(0.529) | TCGA-EW-A1PH-01 | Breast | breast invasive carcinoma | Female | <65 | I/II | Chemotherapy | cyclophosphamide | SD |
| PROX1 | SNV | Missense_Mutation | novel | c.799G>A | p.Glu267Lys | p.E267K | Q92786 | protein_coding | deleterious(0.02) | possibly_damaging(0.589) | TCGA-PE-A5DE-01 | Breast | breast invasive carcinoma | Female | <65 | I/II | Chemotherapy | taxotere | CR |
| PROX1 | insertion | Nonsense_Mutation | novel | c.1463_1464insATGAGCACCTGAGAGCAAAGCGCGCCCGGGTTGAGAATATAATTCG | p.Met489Ter | p.M489* | Q92786 | protein_coding | TCGA-A2-A0EX-01 | Breast | breast invasive carcinoma | Female | <65 | I/II | Hormone Therapy | tamoxiphen | SD |
| Page: 1 2 3 4 5 6 7 8 9 10 11 12 13 14 15 |
Top |
Related drugs of malignant transformation related genes |
| Identification of chemicals and drugs interact with genes involved in malignant transfromation |
| (DGIdb 4.0) |
| Entrez ID | Symbol | Category | Interaction Types | Drug Claim Name | Drug Name | PMIDs |
| 5629 | PROX1 | TRANSCRIPTION FACTOR | atenolol | ATENOLOL |
| Page: 1 |

Copyright 2023-Present -The University of Texas Health Science Center at Houston |