
|
|||||
|
 | |
| |
| |
| |
| |
| |
|
Gene: PROC |
Gene summary for PROC |
| Gene information | Species | Human | Gene symbol | PROC | Gene ID | 5624 |
| Gene name | protein C, inactivator of coagulation factors Va and VIIIa | |
| Gene Alias | APC | |
| Cytomap | 2q14.3 | |
| Gene Type | protein-coding | GO ID | GO:0001885 | UniProtAcc | P04070 |
Top |
Malignant transformation analysis |
| Identification of the aberrant gene expression in precancerous and cancerous lesions by comparing the gene expression of stem-like cells in diseased tissues with normal stem cells |
| Entrez ID | Symbol | Replicates | Species | Organ | Tissue | Adj P-value | Log2FC | Malignancy |
| 5624 | PROC | P4T-E | Human | Esophagus | ESCC | 4.90e-05 | 1.41e-01 | 0.1323 |
| 5624 | PROC | P8T-E | Human | Esophagus | ESCC | 8.84e-05 | 9.93e-02 | 0.0889 |
| 5624 | PROC | P15T-E | Human | Esophagus | ESCC | 8.45e-04 | 1.27e-01 | 0.1149 |
| 5624 | PROC | P20T-E | Human | Esophagus | ESCC | 5.73e-03 | 1.12e-01 | 0.1124 |
| 5624 | PROC | P21T-E | Human | Esophagus | ESCC | 1.53e-19 | 4.31e-01 | 0.1617 |
| 5624 | PROC | P31T-E | Human | Esophagus | ESCC | 9.20e-06 | 1.25e-01 | 0.1251 |
| 5624 | PROC | P32T-E | Human | Esophagus | ESCC | 3.89e-12 | 2.56e-01 | 0.1666 |
| 5624 | PROC | P37T-E | Human | Esophagus | ESCC | 3.37e-15 | 3.93e-01 | 0.1371 |
| 5624 | PROC | P49T-E | Human | Esophagus | ESCC | 4.64e-06 | 8.97e-01 | 0.1768 |
| 5624 | PROC | P61T-E | Human | Esophagus | ESCC | 1.48e-02 | 1.07e-01 | 0.099 |
| 5624 | PROC | P62T-E | Human | Esophagus | ESCC | 1.20e-02 | 1.03e-01 | 0.1302 |
| 5624 | PROC | P74T-E | Human | Esophagus | ESCC | 2.69e-06 | 2.07e-01 | 0.1479 |
| 5624 | PROC | P75T-E | Human | Esophagus | ESCC | 1.88e-04 | 1.32e-01 | 0.1125 |
| 5624 | PROC | P83T-E | Human | Esophagus | ESCC | 6.97e-08 | 2.59e-01 | 0.1738 |
| 5624 | PROC | P89T-E | Human | Esophagus | ESCC | 5.33e-06 | 3.20e-01 | 0.1752 |
| 5624 | PROC | P104T-E | Human | Esophagus | ESCC | 2.70e-02 | 1.45e-01 | 0.0931 |
| 5624 | PROC | P130T-E | Human | Esophagus | ESCC | 9.78e-30 | 5.87e-01 | 0.1676 |
| 5624 | PROC | NAFLD1 | Human | Liver | NAFLD | 8.78e-05 | 3.32e-01 | -0.04 |
| 5624 | PROC | S43 | Human | Liver | Cirrhotic | 6.20e-18 | -2.06e-01 | -0.0187 |
| 5624 | PROC | HCC1_Meng | Human | Liver | HCC | 3.09e-64 | 6.86e-01 | 0.0246 |
| Page: 1 2 |
| Tissue | Expression Dynamics | Abbreviation |
| Esophagus | 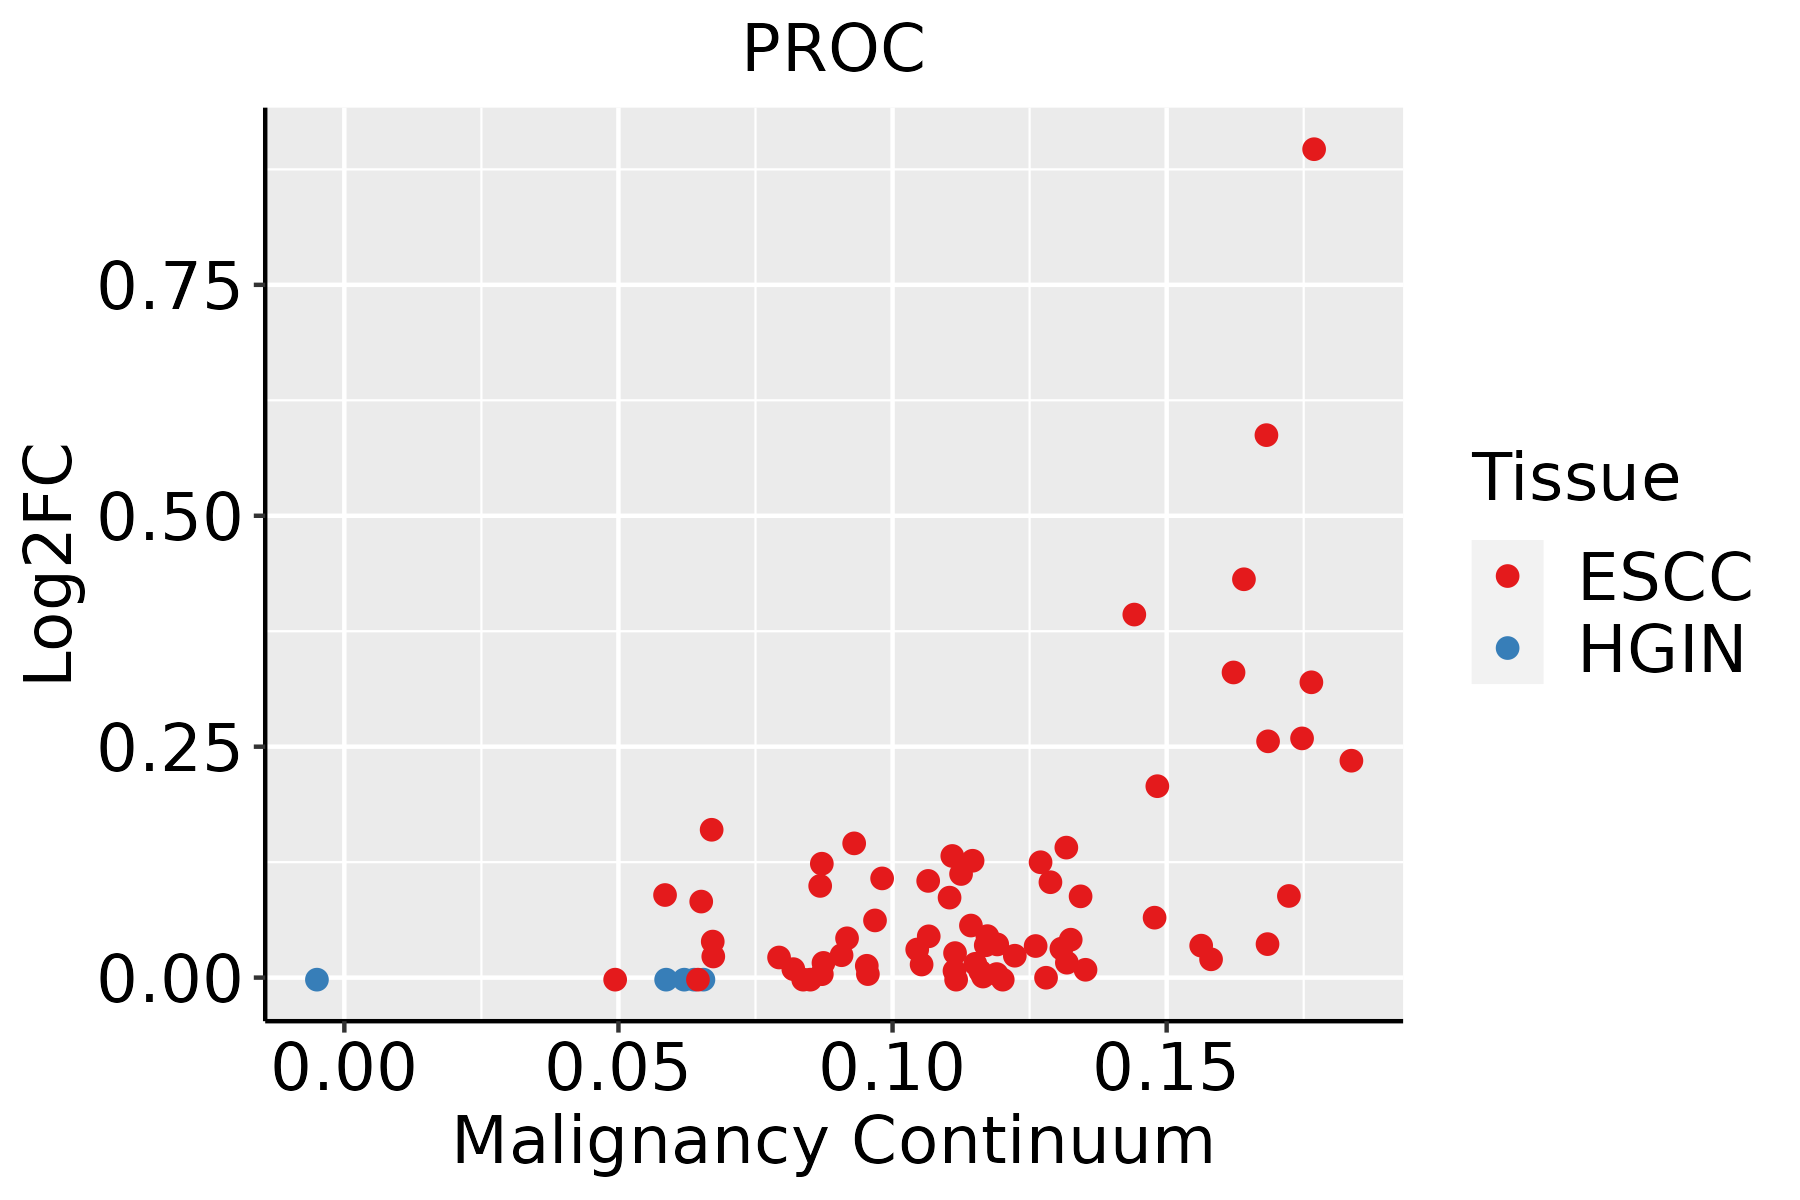 | ESCC: Esophageal squamous cell carcinoma |
| HGIN: High-grade intraepithelial neoplasias | ||
| LGIN: Low-grade intraepithelial neoplasias | ||
| Liver | 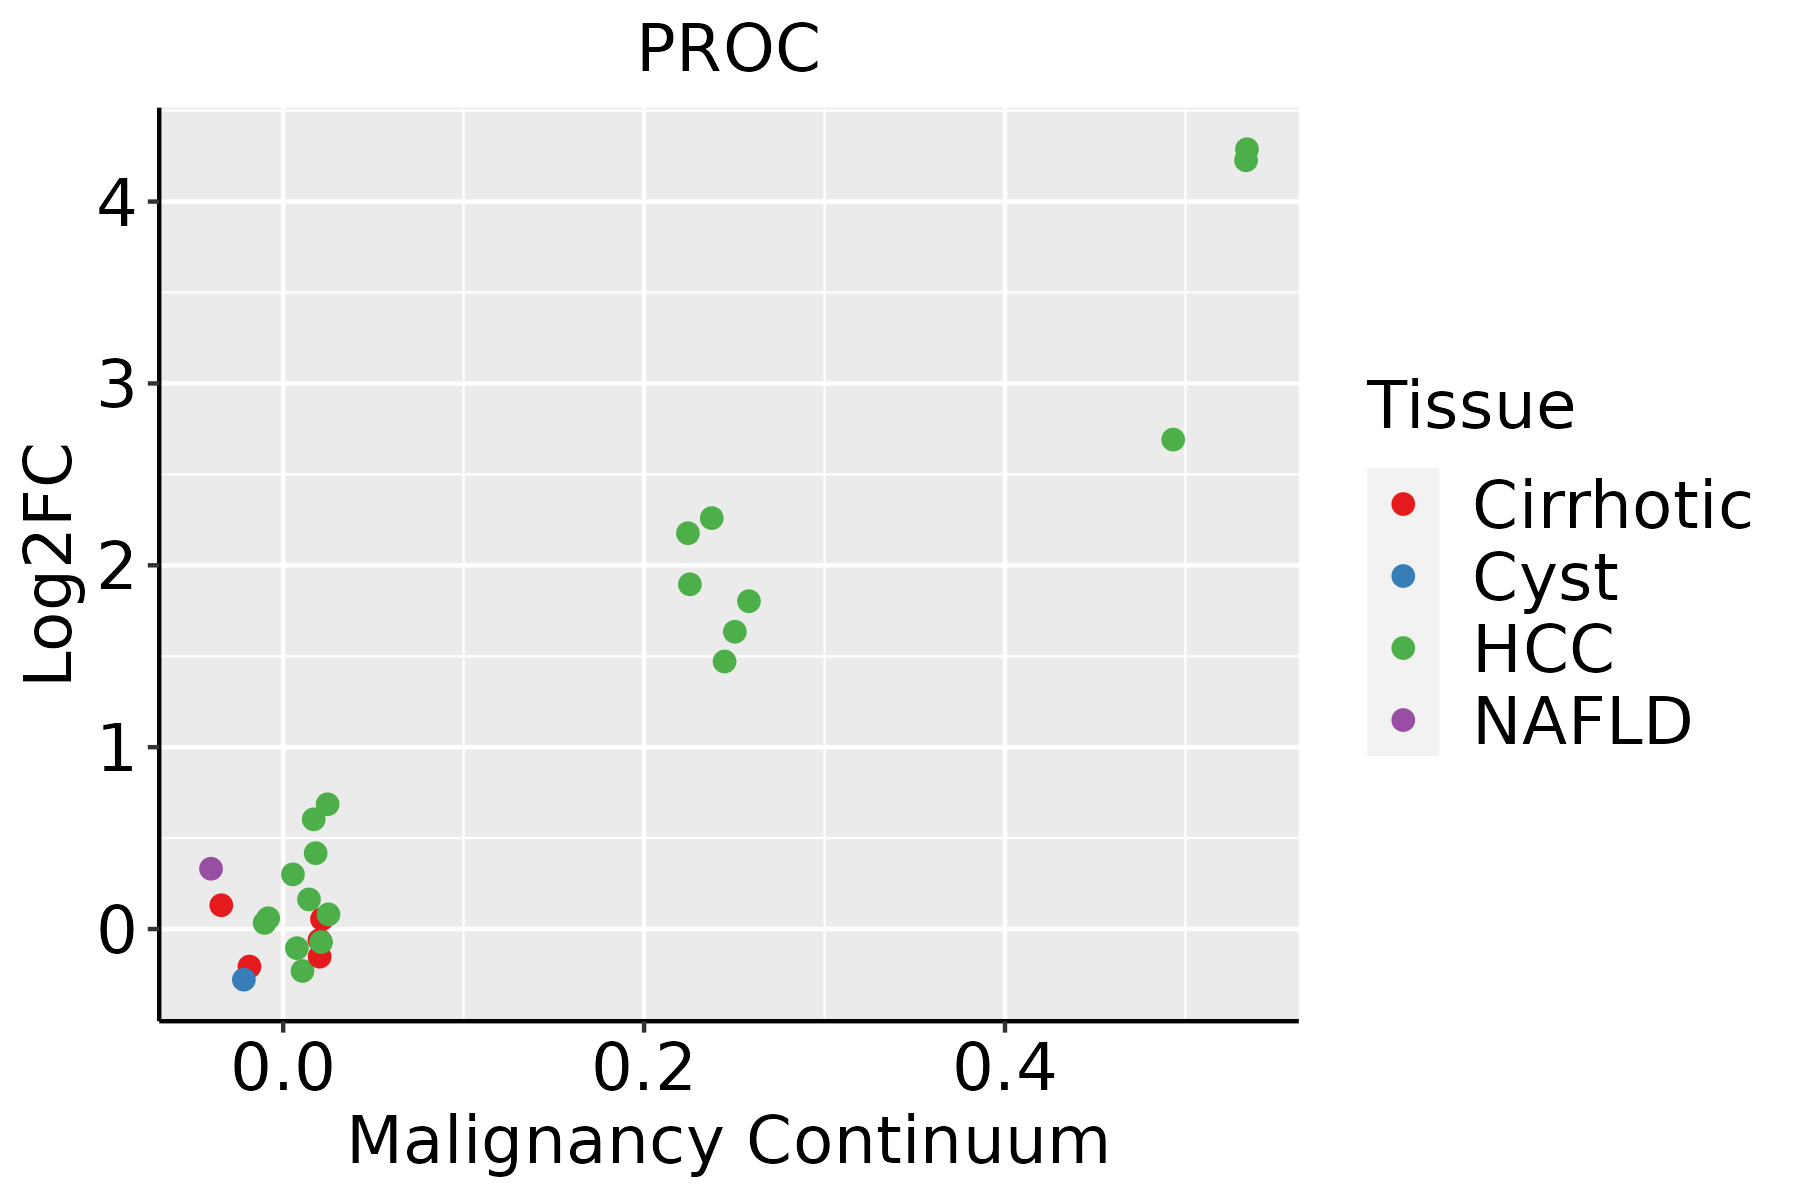 | HCC: Hepatocellular carcinoma |
| NAFLD: Non-alcoholic fatty liver disease |
| ∗log2FC in expression of this searched gene in stem-like cells from each diseased tissue sample relative to stem-like cells in normal samples in each tissue plotted against the malignancy continuum. Samples are colored based on if they are from different disease stage. |
Top |
Malignant transformation related pathway analysis |
| Find out the enriched GO biological processes and KEGG pathways involved in transition from healthy to precancer to cancer |
| Tissue | Disease Stage | Enriched GO biological Processes |
| Colorectum | AD |  |
| Colorectum | SER |  |
| Colorectum | MSS |  |
| Colorectum | MSI-H |  |
| Colorectum | FAP |  |
| ∗Top 15 enriched GO BP terms are showed in the bar plot of each disease state in each tissue. Each row represents a significant GO biological process which is colored according to the -log10(p.adjust). |
| Page: 1 2 3 4 5 6 7 8 9 |
| GO ID | Tissue | Disease Stage | Description | Gene Ratio | Bg Ratio | pvalue | p.adjust | Count |
| GO:00508172 | Liver | HCC | coagulation | 118/7958 | 222/18723 | 8.41e-04 | 5.03e-03 | 118 |
| GO:005087822 | Liver | HCC | regulation of body fluid levels | 191/7958 | 379/18723 | 1.06e-03 | 6.11e-03 | 191 |
| GO:00508192 | Liver | HCC | negative regulation of coagulation | 34/7958 | 53/18723 | 1.20e-03 | 6.68e-03 | 34 |
| GO:000206422 | Liver | HCC | epithelial cell development | 114/7958 | 220/18723 | 3.19e-03 | 1.47e-02 | 114 |
| GO:006102822 | Liver | HCC | establishment of endothelial barrier | 28/7958 | 46/18723 | 9.16e-03 | 3.52e-02 | 28 |
| GO:000188512 | Liver | HCC | endothelial cell development | 37/7958 | 64/18723 | 9.63e-03 | 3.63e-02 | 37 |
| GO:004206020 | Oral cavity | OSCC | wound healing | 237/7305 | 422/18723 | 4.51e-13 | 2.18e-11 | 237 |
| GO:005087819 | Oral cavity | OSCC | regulation of body fluid levels | 179/7305 | 379/18723 | 6.19e-04 | 3.50e-03 | 179 |
| GO:00075969 | Oral cavity | OSCC | blood coagulation | 102/7305 | 217/18723 | 9.69e-03 | 3.43e-02 | 102 |
| GO:00075999 | Oral cavity | OSCC | hemostasis | 103/7305 | 222/18723 | 1.45e-02 | 4.73e-02 | 103 |
| GO:00508179 | Oral cavity | OSCC | coagulation | 103/7305 | 222/18723 | 1.45e-02 | 4.73e-02 | 103 |
| GO:0042060110 | Oral cavity | LP | wound healing | 139/4623 | 422/18723 | 7.10e-05 | 9.48e-04 | 139 |
| GO:004206026 | Oral cavity | EOLP | wound healing | 99/2218 | 422/18723 | 1.18e-11 | 1.85e-09 | 99 |
| GO:005081715 | Oral cavity | EOLP | coagulation | 43/2218 | 222/18723 | 7.59e-04 | 6.09e-03 | 43 |
| GO:000759615 | Oral cavity | EOLP | blood coagulation | 42/2218 | 217/18723 | 8.81e-04 | 6.76e-03 | 42 |
| GO:000759915 | Oral cavity | EOLP | hemostasis | 42/2218 | 222/18723 | 1.40e-03 | 9.58e-03 | 42 |
| GO:0050878110 | Oral cavity | EOLP | regulation of body fluid levels | 63/2218 | 379/18723 | 3.36e-03 | 1.94e-02 | 63 |
| GO:004206033 | Oral cavity | NEOLP | wound healing | 106/2005 | 422/18723 | 1.93e-17 | 1.91e-14 | 106 |
| GO:005081722 | Oral cavity | NEOLP | coagulation | 48/2005 | 222/18723 | 1.51e-06 | 3.77e-05 | 48 |
| GO:000759621 | Oral cavity | NEOLP | blood coagulation | 47/2005 | 217/18723 | 1.84e-06 | 4.44e-05 | 47 |
| Page: 1 2 3 4 5 |
| Pathway ID | Tissue | Disease Stage | Description | Gene Ratio | Bg Ratio | pvalue | p.adjust | qvalue | Count |
| hsa04610 | Liver | NAFLD | Complement and coagulation cascades | 35/1043 | 86/8465 | 2.48e-11 | 2.04e-09 | 1.64e-09 | 35 |
| hsa046101 | Liver | NAFLD | Complement and coagulation cascades | 35/1043 | 86/8465 | 2.48e-11 | 2.04e-09 | 1.64e-09 | 35 |
| hsa046102 | Liver | Cirrhotic | Complement and coagulation cascades | 48/2530 | 86/8465 | 4.41e-07 | 5.44e-06 | 3.35e-06 | 48 |
| hsa046103 | Liver | Cirrhotic | Complement and coagulation cascades | 48/2530 | 86/8465 | 4.41e-07 | 5.44e-06 | 3.35e-06 | 48 |
| hsa046104 | Liver | HCC | Complement and coagulation cascades | 57/4020 | 86/8465 | 3.19e-04 | 1.45e-03 | 8.04e-04 | 57 |
| hsa046105 | Liver | HCC | Complement and coagulation cascades | 57/4020 | 86/8465 | 3.19e-04 | 1.45e-03 | 8.04e-04 | 57 |
| Page: 1 |
Top |
Cell-cell communication analysis |
| Identification of potential cell-cell interactions between two cell types and their ligand-receptor pairs for different disease states |
| Ligand | Receptor | LRpair | Pathway | Tissue | Disease Stage |
| Page: 1 |
Top |
Single-cell gene regulatory network inference analysis |
| Find out the significant the regulons (TFs) and the target genes of each regulon across cell types for different disease states |
| TF | Cell Type | Tissue | Disease Stage | Target Gene | RSS | Regulon Activity |
| ∗The dot plots of a searched regulon are shown for all cell subpopulations in each disease state of each tissue based on the regulon specific score inferred using pySCENIC and by calculating the average expression. |
| Page: 1 |
Top |
Somatic mutation of malignant transformation related genes |
| Annotation of somatic variants for genes involved in malignant transformation |
| Hugo Symbol | Variant Class | Variant Classification | dbSNP RS | HGVSc | HGVSp | HGVSp Short | SWISSPROT | BIOTYPE | SIFT | PolyPhen | Tumor Sample Barcode | Tissue | Histology | Sex | Age | Stage | Therapy Types | Drugs | Outcome |
| PROC | SNV | Missense_Mutation | rs199514227 | c.118C>T | p.Arg40Cys | p.R40C | P04070 | protein_coding | deleterious(0) | possibly_damaging(0.789) | TCGA-A7-A4SD-01 | Breast | breast invasive carcinoma | Female | <65 | I/II | Chemotherapy | taxotere | CR |
| PROC | SNV | Missense_Mutation | c.1216A>G | p.Met406Val | p.M406V | P04070 | protein_coding | deleterious(0) | probably_damaging(0.998) | TCGA-AN-A0AT-01 | Breast | breast invasive carcinoma | Female | <65 | I/II | Unknown | Unknown | SD | |
| PROC | SNV | Missense_Mutation | rs764737827 | c.859N>A | p.Val287Ile | p.V287I | P04070 | protein_coding | tolerated(1) | benign(0) | TCGA-D8-A1Y1-01 | Breast | breast invasive carcinoma | Female | >=65 | III/IV | Hormone Therapy | tamoxiphen | PD |
| PROC | SNV | Missense_Mutation | novel | c.1185G>T | p.Gln395His | p.Q395H | P04070 | protein_coding | deleterious(0.01) | possibly_damaging(0.742) | TCGA-2W-A8YY-01 | Cervix | cervical & endocervical cancer | Female | <65 | I/II | Chemotherapy | cisplatin | CR |
| PROC | SNV | Missense_Mutation | rs199469472 | c.1258G>T | p.Val420Leu | p.V420L | P04070 | protein_coding | deleterious(0) | probably_damaging(0.998) | TCGA-DS-A1OB-01 | Cervix | cervical & endocervical cancer | Female | <65 | I/II | Chemotherapy | carboplatin | PD |
| PROC | SNV | Missense_Mutation | novel | c.346N>C | p.Gly116Arg | p.G116R | P04070 | protein_coding | deleterious(0.03) | probably_damaging(0.92) | TCGA-VS-A8QH-01 | Cervix | cervical & endocervical cancer | Female | >=65 | I/II | Chemotherapy | gemcitabine | PD |
| PROC | insertion | Frame_Shift_Ins | novel | c.1257_1258insA | p.Val420SerfsTer5 | p.V420Sfs*5 | P04070 | protein_coding | TCGA-DS-A1OB-01 | Cervix | cervical & endocervical cancer | Female | <65 | I/II | Chemotherapy | carboplatin | PD | ||
| PROC | SNV | Missense_Mutation | rs746989553 | c.581N>A | p.Arg194His | p.R194H | P04070 | protein_coding | tolerated(0.12) | possibly_damaging(0.655) | TCGA-A6-2686-01 | Colorectum | colon adenocarcinoma | Female | >=65 | I/II | Unknown | Unknown | SD |
| PROC | SNV | Missense_Mutation | rs199469476 | c.632N>A | p.Arg211Gln | p.R211Q | P04070 | protein_coding | tolerated(0.06) | possibly_damaging(0.906) | TCGA-AA-3695-01 | Colorectum | colon adenocarcinoma | Female | <65 | III/IV | Unknown | Unknown | SD |
| PROC | SNV | Missense_Mutation | c.901N>A | p.Ala301Thr | p.A301T | P04070 | protein_coding | deleterious(0) | probably_damaging(0.988) | TCGA-AA-3713-01 | Colorectum | colon adenocarcinoma | Male | >=65 | III/IV | Chemotherapy | 5-fluorouracil | PR |
| Page: 1 2 3 4 5 6 |
Top |
Related drugs of malignant transformation related genes |
| Identification of chemicals and drugs interact with genes involved in malignant transfromation |
| (DGIdb 4.0) |
| Entrez ID | Symbol | Category | Interaction Types | Drug Claim Name | Drug Name | PMIDs |
| 5624 | PROC | PROTEASE, DRUGGABLE GENOME, ENZYME | Sodium Tetradecyl Sulfate | |||
| 5624 | PROC | PROTEASE, DRUGGABLE GENOME, ENZYME | avatrombopag | AVATROMBOPAG | ||
| 5624 | PROC | PROTEASE, DRUGGABLE GENOME, ENZYME | Avatrombopag | AVATROMBOPAG | ||
| 5624 | PROC | PROTEASE, DRUGGABLE GENOME, ENZYME | Progesterone | PROGESTERONE | ||
| 5624 | PROC | PROTEASE, DRUGGABLE GENOME, ENZYME | lusutrombopag | LUSUTROMBOPAG | ||
| 5624 | PROC | PROTEASE, DRUGGABLE GENOME, ENZYME | Warfarin | WARFARIN | ||
| 5624 | PROC | PROTEASE, DRUGGABLE GENOME, ENZYME | estradiol / progesterone | |||
| 5624 | PROC | PROTEASE, DRUGGABLE GENOME, ENZYME | ethinyl estradiol / norelgestromin | |||
| 5624 | PROC | PROTEASE, DRUGGABLE GENOME, ENZYME | Lusutrombopag | LUSUTROMBOPAG | ||
| 5624 | PROC | PROTEASE, DRUGGABLE GENOME, ENZYME | MENADIONE | MENADIONE |
| Page: 1 2 |

Copyright 2023-Present -The University of Texas Health Science Center at Houston |