
|
|||||
|
 | |
| |
| |
| |
| |
| |
|
Gene: PPIH |
Gene summary for PPIH |
| Gene information | Species | Human | Gene symbol | PPIH | Gene ID | 10465 |
| Gene name | peptidylprolyl isomerase H | |
| Gene Alias | CYP-20 | |
| Cytomap | 1p34.2 | |
| Gene Type | protein-coding | GO ID | GO:0000375 | UniProtAcc | O43447 |
Top |
Malignant transformation analysis |
| Identification of the aberrant gene expression in precancerous and cancerous lesions by comparing the gene expression of stem-like cells in diseased tissues with normal stem cells |
| Entrez ID | Symbol | Replicates | Species | Organ | Tissue | Adj P-value | Log2FC | Malignancy |
| 10465 | PPIH | HTA11_1938_2000001011 | Human | Colorectum | AD | 3.41e-02 | 3.25e-01 | -0.0811 |
| 10465 | PPIH | HTA11_347_2000001011 | Human | Colorectum | AD | 2.67e-06 | 3.65e-01 | -0.1954 |
| 10465 | PPIH | HTA11_1391_2000001011 | Human | Colorectum | AD | 2.70e-04 | 3.73e-01 | -0.059 |
| 10465 | PPIH | HTA11_6801_2000001011 | Human | Colorectum | SER | 1.11e-05 | 6.87e-01 | 0.0171 |
| 10465 | PPIH | HTA11_7696_3000711011 | Human | Colorectum | AD | 1.36e-06 | 3.05e-01 | 0.0674 |
| 10465 | PPIH | HTA11_99999970781_79442 | Human | Colorectum | MSS | 2.80e-07 | 3.99e-01 | 0.294 |
| 10465 | PPIH | HTA11_99999965104_69814 | Human | Colorectum | MSS | 6.87e-08 | 5.44e-01 | 0.281 |
| 10465 | PPIH | HTA11_99999971662_82457 | Human | Colorectum | MSS | 1.15e-12 | 5.00e-01 | 0.3859 |
| 10465 | PPIH | LZE2T | Human | Esophagus | ESCC | 1.53e-06 | 7.50e-01 | 0.082 |
| 10465 | PPIH | LZE3D | Human | Esophagus | HGIN | 2.82e-02 | 6.60e-01 | 0.0668 |
| 10465 | PPIH | LZE4T | Human | Esophagus | ESCC | 6.29e-07 | 1.75e-01 | 0.0811 |
| 10465 | PPIH | LZE7T | Human | Esophagus | ESCC | 3.00e-05 | 3.86e-01 | 0.0667 |
| 10465 | PPIH | LZE8T | Human | Esophagus | ESCC | 2.71e-07 | 4.54e-01 | 0.067 |
| 10465 | PPIH | LZE20T | Human | Esophagus | ESCC | 1.20e-10 | 3.40e-01 | 0.0662 |
| 10465 | PPIH | LZE22D1 | Human | Esophagus | HGIN | 3.27e-02 | 1.68e-01 | 0.0595 |
| 10465 | PPIH | LZE22T | Human | Esophagus | ESCC | 1.10e-03 | 4.56e-01 | 0.068 |
| 10465 | PPIH | LZE24T | Human | Esophagus | ESCC | 3.84e-25 | 5.69e-01 | 0.0596 |
| 10465 | PPIH | LZE22D3 | Human | Esophagus | HGIN | 1.25e-02 | 3.35e-01 | 0.0653 |
| 10465 | PPIH | LZE21T | Human | Esophagus | ESCC | 4.82e-03 | 4.61e-01 | 0.0655 |
| 10465 | PPIH | LZE6T | Human | Esophagus | ESCC | 1.37e-10 | 5.21e-01 | 0.0845 |
| Page: 1 2 3 4 5 6 7 |
| Tissue | Expression Dynamics | Abbreviation |
| Colorectum (GSE201348) |  | FAP: Familial adenomatous polyposis |
| CRC: Colorectal cancer | ||
| Colorectum (HTA11) |  | AD: Adenomas |
| SER: Sessile serrated lesions | ||
| MSI-H: Microsatellite-high colorectal cancer | ||
| MSS: Microsatellite stable colorectal cancer | ||
| Esophagus | 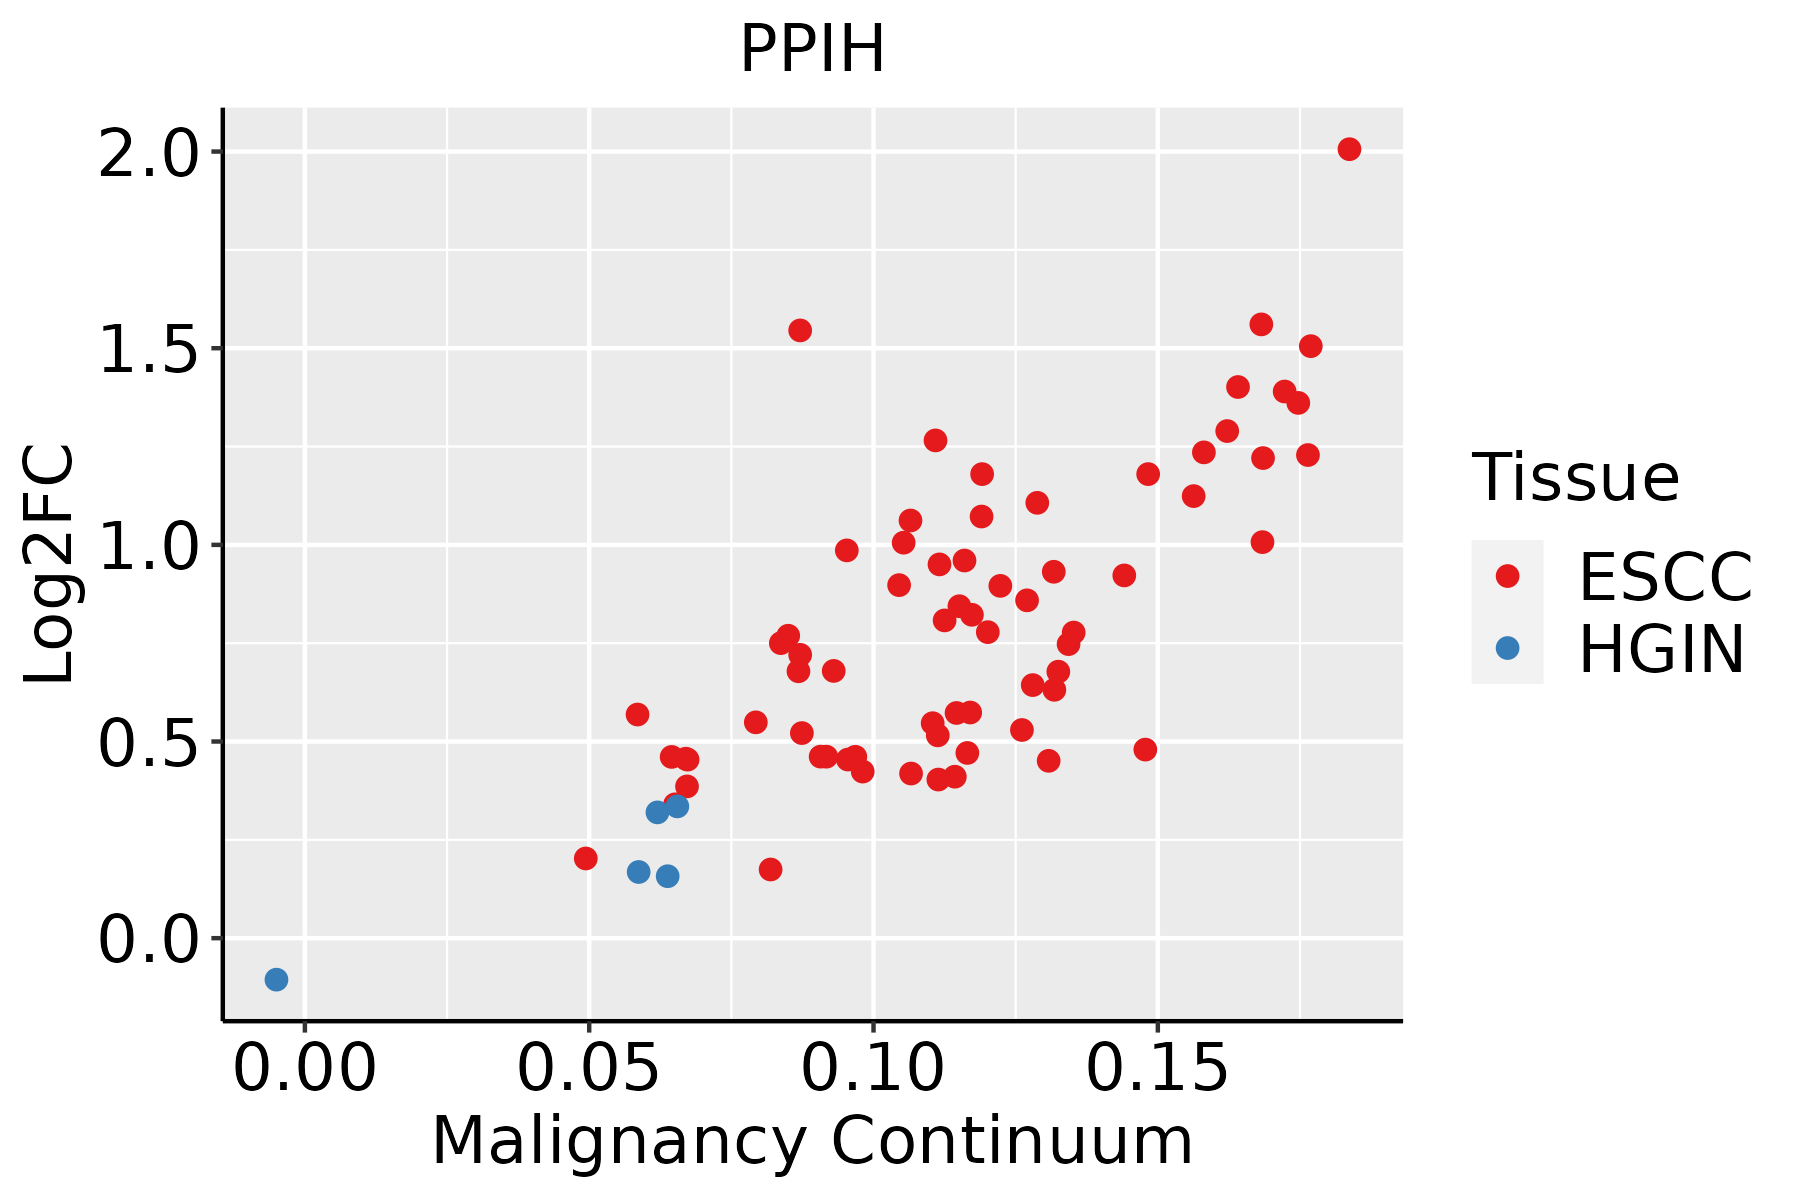 | ESCC: Esophageal squamous cell carcinoma |
| HGIN: High-grade intraepithelial neoplasias | ||
| LGIN: Low-grade intraepithelial neoplasias | ||
| Liver | 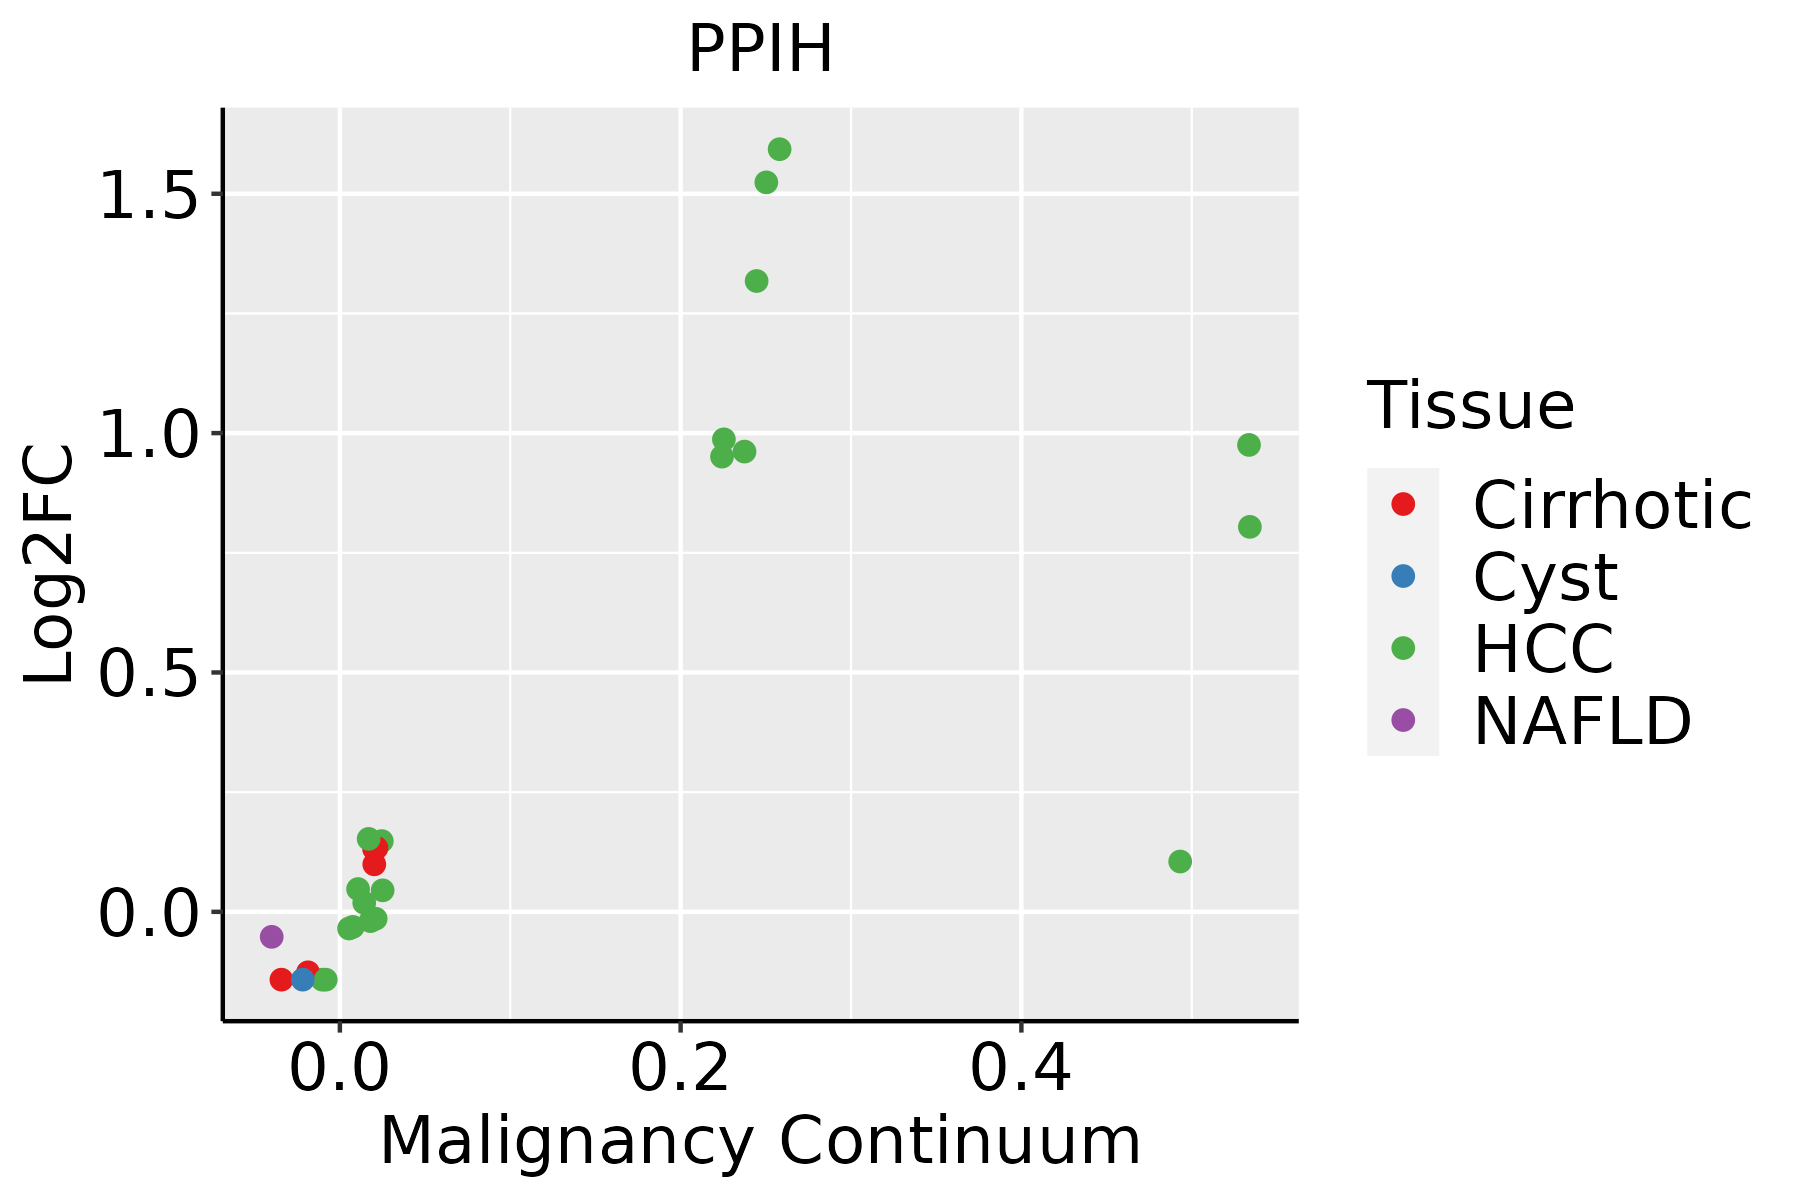 | HCC: Hepatocellular carcinoma |
| NAFLD: Non-alcoholic fatty liver disease | ||
| Oral Cavity | 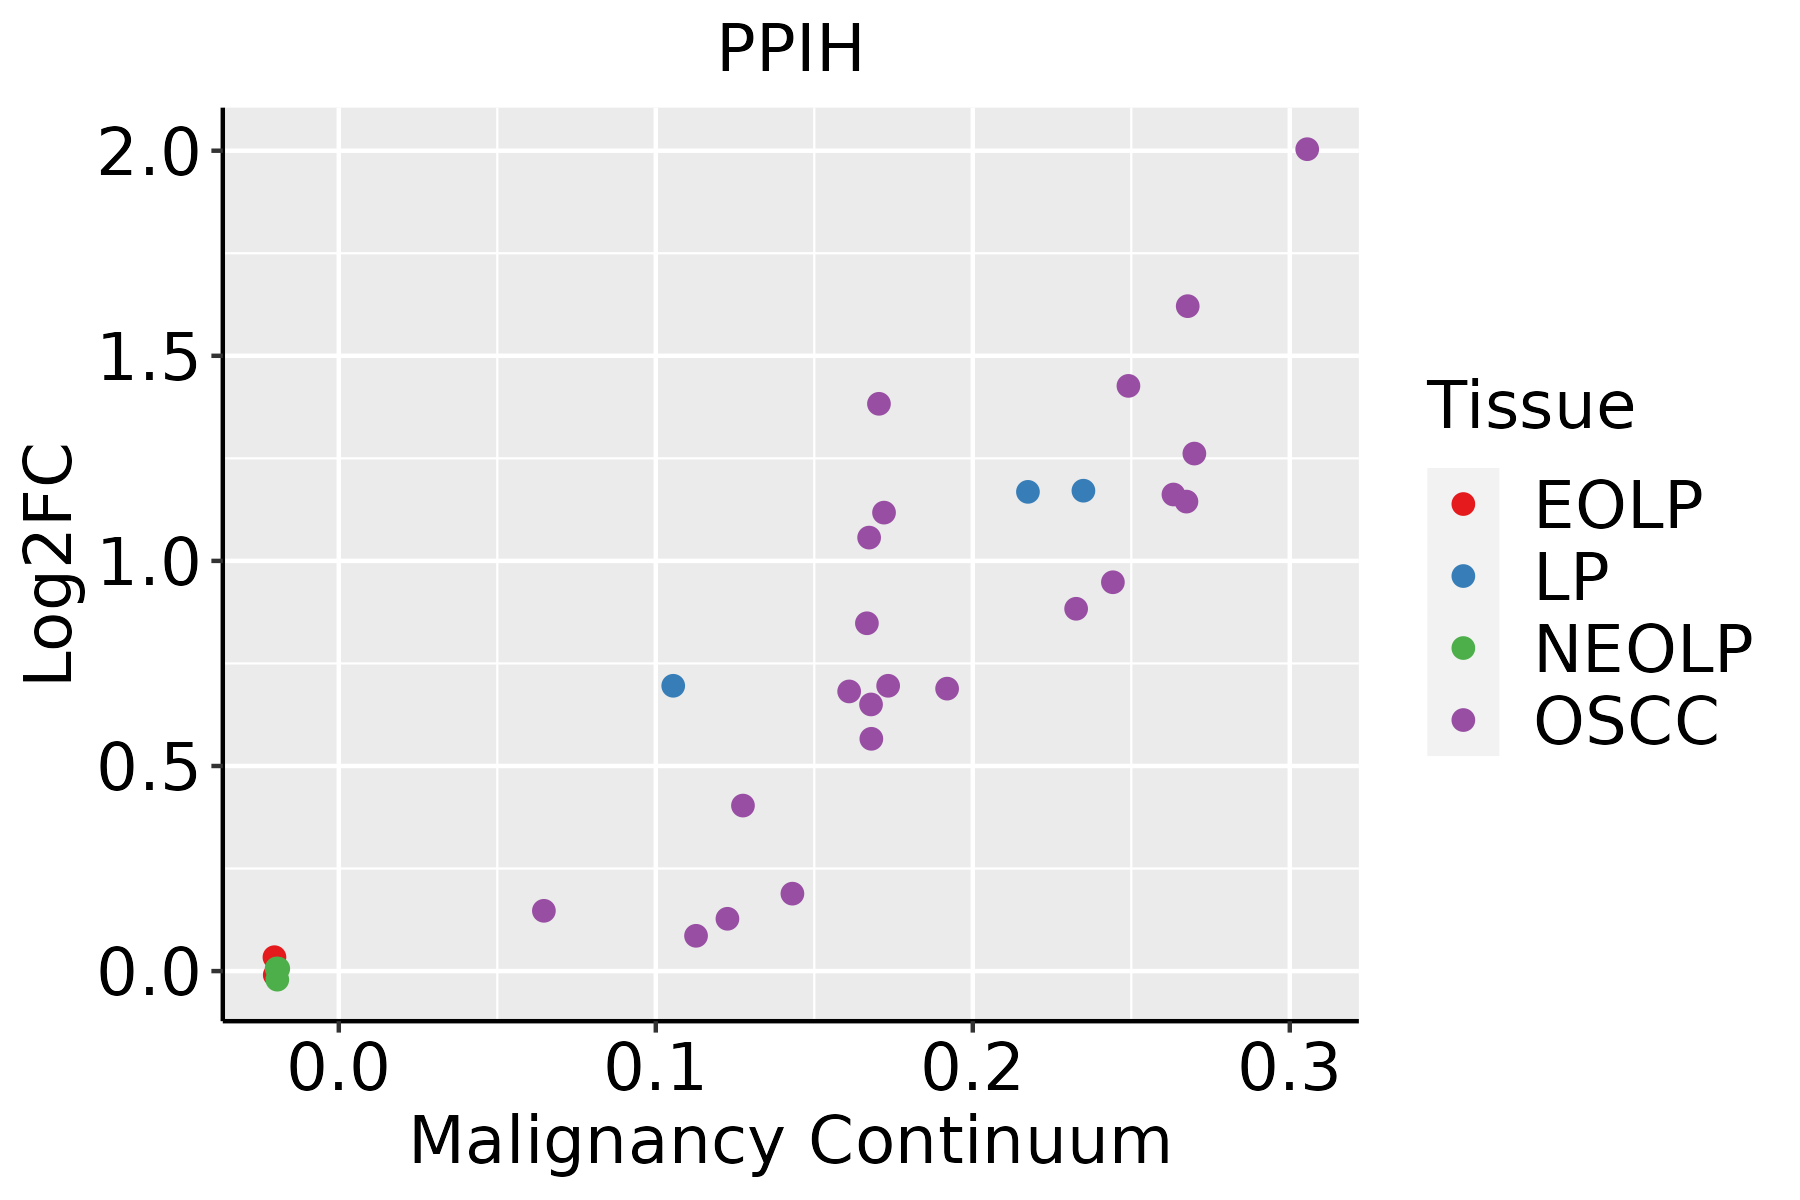 | EOLP: Erosive Oral lichen planus |
| LP: leukoplakia | ||
| NEOLP: Non-erosive oral lichen planus | ||
| OSCC: Oral squamous cell carcinoma | ||
| Skin | 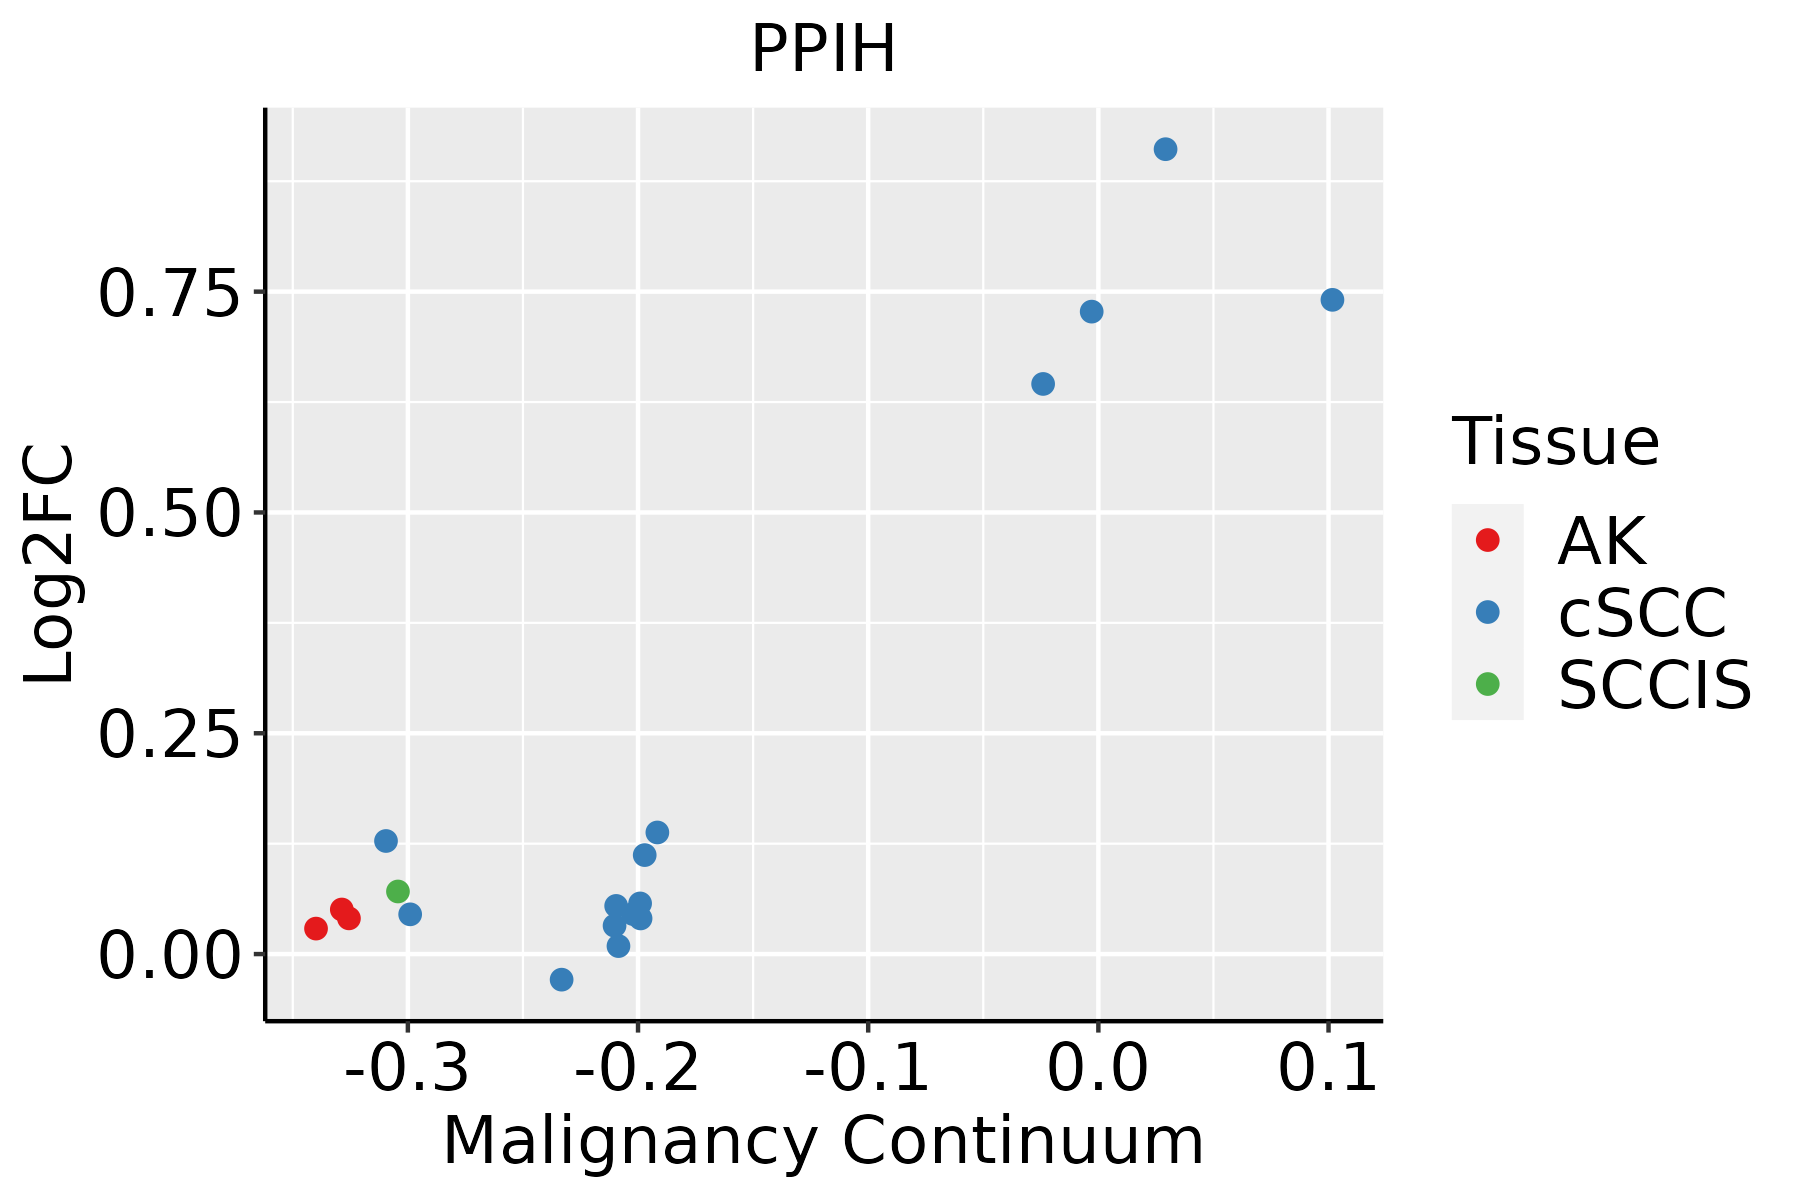 | AK: Actinic keratosis |
| cSCC: Cutaneous squamous cell carcinoma | ||
| SCCIS:squamous cell carcinoma in situ | ||
| Thyroid |  | ATC: Anaplastic thyroid cancer |
| HT: Hashimoto's thyroiditis | ||
| PTC: Papillary thyroid cancer |
| ∗log2FC in expression of this searched gene in stem-like cells from each diseased tissue sample relative to stem-like cells in normal samples in each tissue plotted against the malignancy continuum. Samples are colored based on if they are from different disease stage. |
Top |
Malignant transformation related pathway analysis |
| Find out the enriched GO biological processes and KEGG pathways involved in transition from healthy to precancer to cancer |
| Tissue | Disease Stage | Enriched GO biological Processes |
| Colorectum | AD |  |
| Colorectum | SER |  |
| Colorectum | MSS |  |
| Colorectum | MSI-H |  |
| Colorectum | FAP |  |
| ∗Top 15 enriched GO BP terms are showed in the bar plot of each disease state in each tissue. Each row represents a significant GO biological process which is colored according to the -log10(p.adjust). |
| Page: 1 2 3 4 5 6 7 8 9 |
| GO ID | Tissue | Disease Stage | Description | Gene Ratio | Bg Ratio | pvalue | p.adjust | Count |
| GO:0050792111 | Esophagus | ESCC | regulation of viral process | 119/8552 | 164/18723 | 2.19e-12 | 9.03e-11 | 119 |
| GO:1903900111 | Esophagus | ESCC | regulation of viral life cycle | 106/8552 | 148/18723 | 1.26e-10 | 3.72e-09 | 106 |
| GO:0045069110 | Esophagus | ESCC | regulation of viral genome replication | 67/8552 | 85/18723 | 3.81e-10 | 1.04e-08 | 67 |
| GO:0048524110 | Esophagus | ESCC | positive regulation of viral process | 52/8552 | 65/18723 | 1.41e-08 | 2.77e-07 | 52 |
| GO:001820816 | Esophagus | ESCC | peptidyl-proline modification | 46/8552 | 58/18723 | 1.59e-07 | 2.51e-06 | 46 |
| GO:000041313 | Esophagus | ESCC | protein peptidyl-prolyl isomerization | 32/8552 | 42/18723 | 5.52e-05 | 4.27e-04 | 32 |
| GO:004507015 | Esophagus | ESCC | positive regulation of viral genome replication | 24/8552 | 30/18723 | 1.27e-04 | 8.67e-04 | 24 |
| GO:000838012 | Liver | Cirrhotic | RNA splicing | 229/4634 | 434/18723 | 9.13e-37 | 2.86e-33 | 229 |
| GO:000037512 | Liver | Cirrhotic | RNA splicing, via transesterification reactions | 175/4634 | 324/18723 | 5.95e-30 | 7.47e-27 | 175 |
| GO:000037712 | Liver | Cirrhotic | RNA splicing, via transesterification reactions with bulged adenosine as nucleophile | 172/4634 | 320/18723 | 4.02e-29 | 3.60e-26 | 172 |
| GO:000039812 | Liver | Cirrhotic | mRNA splicing, via spliceosome | 172/4634 | 320/18723 | 4.02e-29 | 3.60e-26 | 172 |
| GO:001603212 | Liver | Cirrhotic | viral process | 203/4634 | 415/18723 | 5.40e-27 | 3.76e-24 | 203 |
| GO:00064577 | Liver | Cirrhotic | protein folding | 114/4634 | 212/18723 | 9.23e-20 | 2.31e-17 | 114 |
| GO:001905812 | Liver | Cirrhotic | viral life cycle | 148/4634 | 317/18723 | 1.12e-17 | 1.64e-15 | 148 |
| GO:001907912 | Liver | Cirrhotic | viral genome replication | 69/4634 | 131/18723 | 5.77e-12 | 3.98e-10 | 69 |
| GO:00485247 | Liver | Cirrhotic | positive regulation of viral process | 39/4634 | 65/18723 | 1.62e-09 | 6.93e-08 | 39 |
| GO:00507927 | Liver | Cirrhotic | regulation of viral process | 74/4634 | 164/18723 | 9.54e-09 | 3.69e-07 | 74 |
| GO:19039007 | Liver | Cirrhotic | regulation of viral life cycle | 64/4634 | 148/18723 | 6.12e-07 | 1.32e-05 | 64 |
| GO:004507011 | Liver | Cirrhotic | positive regulation of viral genome replication | 20/4634 | 30/18723 | 1.50e-06 | 2.95e-05 | 20 |
| GO:004506912 | Liver | Cirrhotic | regulation of viral genome replication | 41/4634 | 85/18723 | 2.28e-06 | 4.19e-05 | 41 |
| Page: 1 2 3 4 5 6 7 8 9 |
| Pathway ID | Tissue | Disease Stage | Description | Gene Ratio | Bg Ratio | pvalue | p.adjust | qvalue | Count |
| hsa03040 | Colorectum | AD | Spliceosome | 73/2092 | 217/8465 | 1.73e-03 | 9.68e-03 | 6.18e-03 | 73 |
| hsa030401 | Colorectum | AD | Spliceosome | 73/2092 | 217/8465 | 1.73e-03 | 9.68e-03 | 6.18e-03 | 73 |
| hsa030402 | Colorectum | MSS | Spliceosome | 66/1875 | 217/8465 | 2.58e-03 | 1.27e-02 | 7.81e-03 | 66 |
| hsa030403 | Colorectum | MSS | Spliceosome | 66/1875 | 217/8465 | 2.58e-03 | 1.27e-02 | 7.81e-03 | 66 |
| hsa0304018 | Esophagus | HGIN | Spliceosome | 79/1383 | 217/8465 | 3.22e-13 | 7.00e-12 | 5.56e-12 | 79 |
| hsa0304019 | Esophagus | HGIN | Spliceosome | 79/1383 | 217/8465 | 3.22e-13 | 7.00e-12 | 5.56e-12 | 79 |
| hsa0304027 | Esophagus | ESCC | Spliceosome | 128/4205 | 217/8465 | 3.31e-03 | 8.79e-03 | 4.50e-03 | 128 |
| hsa0304037 | Esophagus | ESCC | Spliceosome | 128/4205 | 217/8465 | 3.31e-03 | 8.79e-03 | 4.50e-03 | 128 |
| hsa030407 | Liver | Cirrhotic | Spliceosome | 102/2530 | 217/8465 | 5.69e-08 | 9.47e-07 | 5.84e-07 | 102 |
| hsa0304012 | Liver | Cirrhotic | Spliceosome | 102/2530 | 217/8465 | 5.69e-08 | 9.47e-07 | 5.84e-07 | 102 |
| hsa0304022 | Liver | HCC | Spliceosome | 122/4020 | 217/8465 | 5.55e-03 | 1.60e-02 | 8.91e-03 | 122 |
| hsa0304032 | Liver | HCC | Spliceosome | 122/4020 | 217/8465 | 5.55e-03 | 1.60e-02 | 8.91e-03 | 122 |
| hsa0304016 | Oral cavity | OSCC | Spliceosome | 123/3704 | 217/8465 | 7.21e-05 | 2.74e-04 | 1.40e-04 | 123 |
| hsa0304017 | Oral cavity | OSCC | Spliceosome | 123/3704 | 217/8465 | 7.21e-05 | 2.74e-04 | 1.40e-04 | 123 |
| hsa0304026 | Oral cavity | LP | Spliceosome | 106/2418 | 217/8465 | 1.30e-10 | 2.40e-09 | 1.55e-09 | 106 |
| hsa0304036 | Oral cavity | LP | Spliceosome | 106/2418 | 217/8465 | 1.30e-10 | 2.40e-09 | 1.55e-09 | 106 |
| Page: 1 |
Top |
Cell-cell communication analysis |
| Identification of potential cell-cell interactions between two cell types and their ligand-receptor pairs for different disease states |
| Ligand | Receptor | LRpair | Pathway | Tissue | Disease Stage |
| Page: 1 |
Top |
Single-cell gene regulatory network inference analysis |
| Find out the significant the regulons (TFs) and the target genes of each regulon across cell types for different disease states |
| TF | Cell Type | Tissue | Disease Stage | Target Gene | RSS | Regulon Activity |
| ∗The dot plots of a searched regulon are shown for all cell subpopulations in each disease state of each tissue based on the regulon specific score inferred using pySCENIC and by calculating the average expression. |
| Page: 1 |
Top |
Somatic mutation of malignant transformation related genes |
| Annotation of somatic variants for genes involved in malignant transformation |
| Hugo Symbol | Variant Class | Variant Classification | dbSNP RS | HGVSc | HGVSp | HGVSp Short | SWISSPROT | BIOTYPE | SIFT | PolyPhen | Tumor Sample Barcode | Tissue | Histology | Sex | Age | Stage | Therapy Types | Drugs | Outcome |
| PPIH | insertion | Frame_Shift_Ins | novel | c.12_13insGAGCATTACTTCCCACACGCATACCCCAACCAACCCCC | p.Asn5GlufsTer36 | p.N5Efs*36 | O43447 | protein_coding | TCGA-BH-A0HY-01 | Breast | breast invasive carcinoma | Female | <65 | I/II | Hormone Therapy | taxotere | CR | ||
| PPIH | SNV | Missense_Mutation | novel | c.182A>G | p.Lys61Arg | p.K61R | O43447 | protein_coding | deleterious(0.01) | probably_damaging(0.983) | TCGA-2W-A8YY-01 | Cervix | cervical & endocervical cancer | Female | <65 | I/II | Chemotherapy | cisplatin | CR |
| PPIH | SNV | Missense_Mutation | c.176N>A | p.Gly59Glu | p.G59E | O43447 | protein_coding | deleterious(0) | probably_damaging(1) | TCGA-LP-A4AV-01 | Cervix | cervical & endocervical cancer | Female | <65 | I/II | Unknown | Unknown | SD | |
| PPIH | SNV | Missense_Mutation | c.372C>A | p.Phe124Leu | p.F124L | O43447 | protein_coding | deleterious(0.01) | probably_damaging(0.922) | TCGA-AA-A00N-01 | Colorectum | colon adenocarcinoma | Male | >=65 | I/II | Unknown | Unknown | PD | |
| PPIH | SNV | Missense_Mutation | novel | c.128N>G | p.Phe43Cys | p.F43C | O43447 | protein_coding | deleterious(0) | probably_damaging(0.998) | TCGA-A5-A2K5-01 | Endometrium | uterine corpus endometrioid carcinoma | Female | >=65 | I/II | Unknown | Unknown | SD |
| PPIH | SNV | Missense_Mutation | c.287C>A | p.Ala96Glu | p.A96E | O43447 | protein_coding | tolerated(0.56) | benign(0.003) | TCGA-AP-A056-01 | Endometrium | uterine corpus endometrioid carcinoma | Female | <65 | I/II | Unknown | Unknown | SD | |
| PPIH | SNV | Missense_Mutation | rs765096105 | c.515N>T | p.Ser172Leu | p.S172L | O43447 | protein_coding | deleterious(0.02) | benign(0.065) | TCGA-AP-A0LM-01 | Endometrium | uterine corpus endometrioid carcinoma | Female | <65 | III/IV | Chemotherapy | cisplatin | SD |
| PPIH | SNV | Missense_Mutation | novel | c.386N>A | p.Ser129Tyr | p.S129Y | O43447 | protein_coding | deleterious(0) | possibly_damaging(0.705) | TCGA-AP-A1DV-01 | Endometrium | uterine corpus endometrioid carcinoma | Female | <65 | I/II | Unknown | Unknown | SD |
| PPIH | SNV | Missense_Mutation | novel | c.277N>A | p.Gly93Arg | p.G93R | O43447 | protein_coding | tolerated(0.27) | benign(0.288) | TCGA-AX-A06F-01 | Endometrium | uterine corpus endometrioid carcinoma | Female | <65 | III/IV | Chemotherapy | carboplatin | SD |
| PPIH | SNV | Missense_Mutation | c.338N>T | p.Ala113Val | p.A113V | O43447 | protein_coding | deleterious(0.03) | benign(0.212) | TCGA-AX-A0J1-01 | Endometrium | uterine corpus endometrioid carcinoma | Female | >=65 | I/II | Unknown | Unknown | SD |
| Page: 1 2 |
Top |
Related drugs of malignant transformation related genes |
| Identification of chemicals and drugs interact with genes involved in malignant transfromation |
| (DGIdb 4.0) |
| Entrez ID | Symbol | Category | Interaction Types | Drug Claim Name | Drug Name | PMIDs |
| Page: 1 |

Copyright 2023-Present -The University of Texas Health Science Center at Houston |