
|
|||||
|
 | |
| |
| |
| |
| |
| |
|
Gene: PHAX |
Gene summary for PHAX |
| Gene information | Species | Human | Gene symbol | PHAX | Gene ID | 51808 |
| Gene name | phosphorylated adaptor for RNA export | |
| Gene Alias | RNUXA | |
| Cytomap | 5q23.2 | |
| Gene Type | protein-coding | GO ID | GO:0006139 | UniProtAcc | Q9H814 |
Top |
Malignant transformation analysis |
| Identification of the aberrant gene expression in precancerous and cancerous lesions by comparing the gene expression of stem-like cells in diseased tissues with normal stem cells |
| Entrez ID | Symbol | Replicates | Species | Organ | Tissue | Adj P-value | Log2FC | Malignancy |
| 51808 | PHAX | HTA11_347_2000001011 | Human | Colorectum | AD | 7.19e-16 | 5.97e-01 | -0.1954 |
| 51808 | PHAX | HTA11_696_2000001011 | Human | Colorectum | AD | 7.27e-03 | 3.23e-01 | -0.1464 |
| 51808 | PHAX | HTA11_866_2000001011 | Human | Colorectum | AD | 7.32e-03 | 2.38e-01 | -0.1001 |
| 51808 | PHAX | HTA11_546_2000001011 | Human | Colorectum | AD | 1.30e-02 | 3.97e-01 | -0.0842 |
| 51808 | PHAX | HTA11_99999971662_82457 | Human | Colorectum | MSS | 1.72e-03 | 2.69e-01 | 0.3859 |
| 51808 | PHAX | A015-C-203 | Human | Colorectum | FAP | 2.99e-02 | -1.30e-01 | -0.1294 |
| 51808 | PHAX | A015-C-104 | Human | Colorectum | FAP | 4.43e-02 | -5.67e-02 | -0.1899 |
| 51808 | PHAX | LZE2T | Human | Esophagus | ESCC | 1.24e-05 | 3.39e-01 | 0.082 |
| 51808 | PHAX | LZE4T | Human | Esophagus | ESCC | 1.94e-07 | 2.73e-01 | 0.0811 |
| 51808 | PHAX | LZE8T | Human | Esophagus | ESCC | 4.85e-07 | 8.95e-02 | 0.067 |
| 51808 | PHAX | LZE20T | Human | Esophagus | ESCC | 2.28e-07 | 6.44e-02 | 0.0662 |
| 51808 | PHAX | LZE24T | Human | Esophagus | ESCC | 2.21e-09 | 3.14e-01 | 0.0596 |
| 51808 | PHAX | LZE6T | Human | Esophagus | ESCC | 9.08e-03 | 1.93e-01 | 0.0845 |
| 51808 | PHAX | P1T-E | Human | Esophagus | ESCC | 5.76e-07 | 1.89e-01 | 0.0875 |
| 51808 | PHAX | P2T-E | Human | Esophagus | ESCC | 6.79e-41 | 7.59e-01 | 0.1177 |
| 51808 | PHAX | P4T-E | Human | Esophagus | ESCC | 8.19e-24 | 6.19e-01 | 0.1323 |
| 51808 | PHAX | P5T-E | Human | Esophagus | ESCC | 8.51e-17 | 2.70e-01 | 0.1327 |
| 51808 | PHAX | P8T-E | Human | Esophagus | ESCC | 6.94e-13 | 2.71e-01 | 0.0889 |
| 51808 | PHAX | P9T-E | Human | Esophagus | ESCC | 1.90e-17 | 3.09e-01 | 0.1131 |
| 51808 | PHAX | P10T-E | Human | Esophagus | ESCC | 1.32e-26 | 2.89e-01 | 0.116 |
| Page: 1 2 3 4 5 6 7 |
| Tissue | Expression Dynamics | Abbreviation |
| Colorectum (GSE201348) |  | FAP: Familial adenomatous polyposis |
| CRC: Colorectal cancer | ||
| Colorectum (HTA11) |  | AD: Adenomas |
| SER: Sessile serrated lesions | ||
| MSI-H: Microsatellite-high colorectal cancer | ||
| MSS: Microsatellite stable colorectal cancer | ||
| Esophagus | 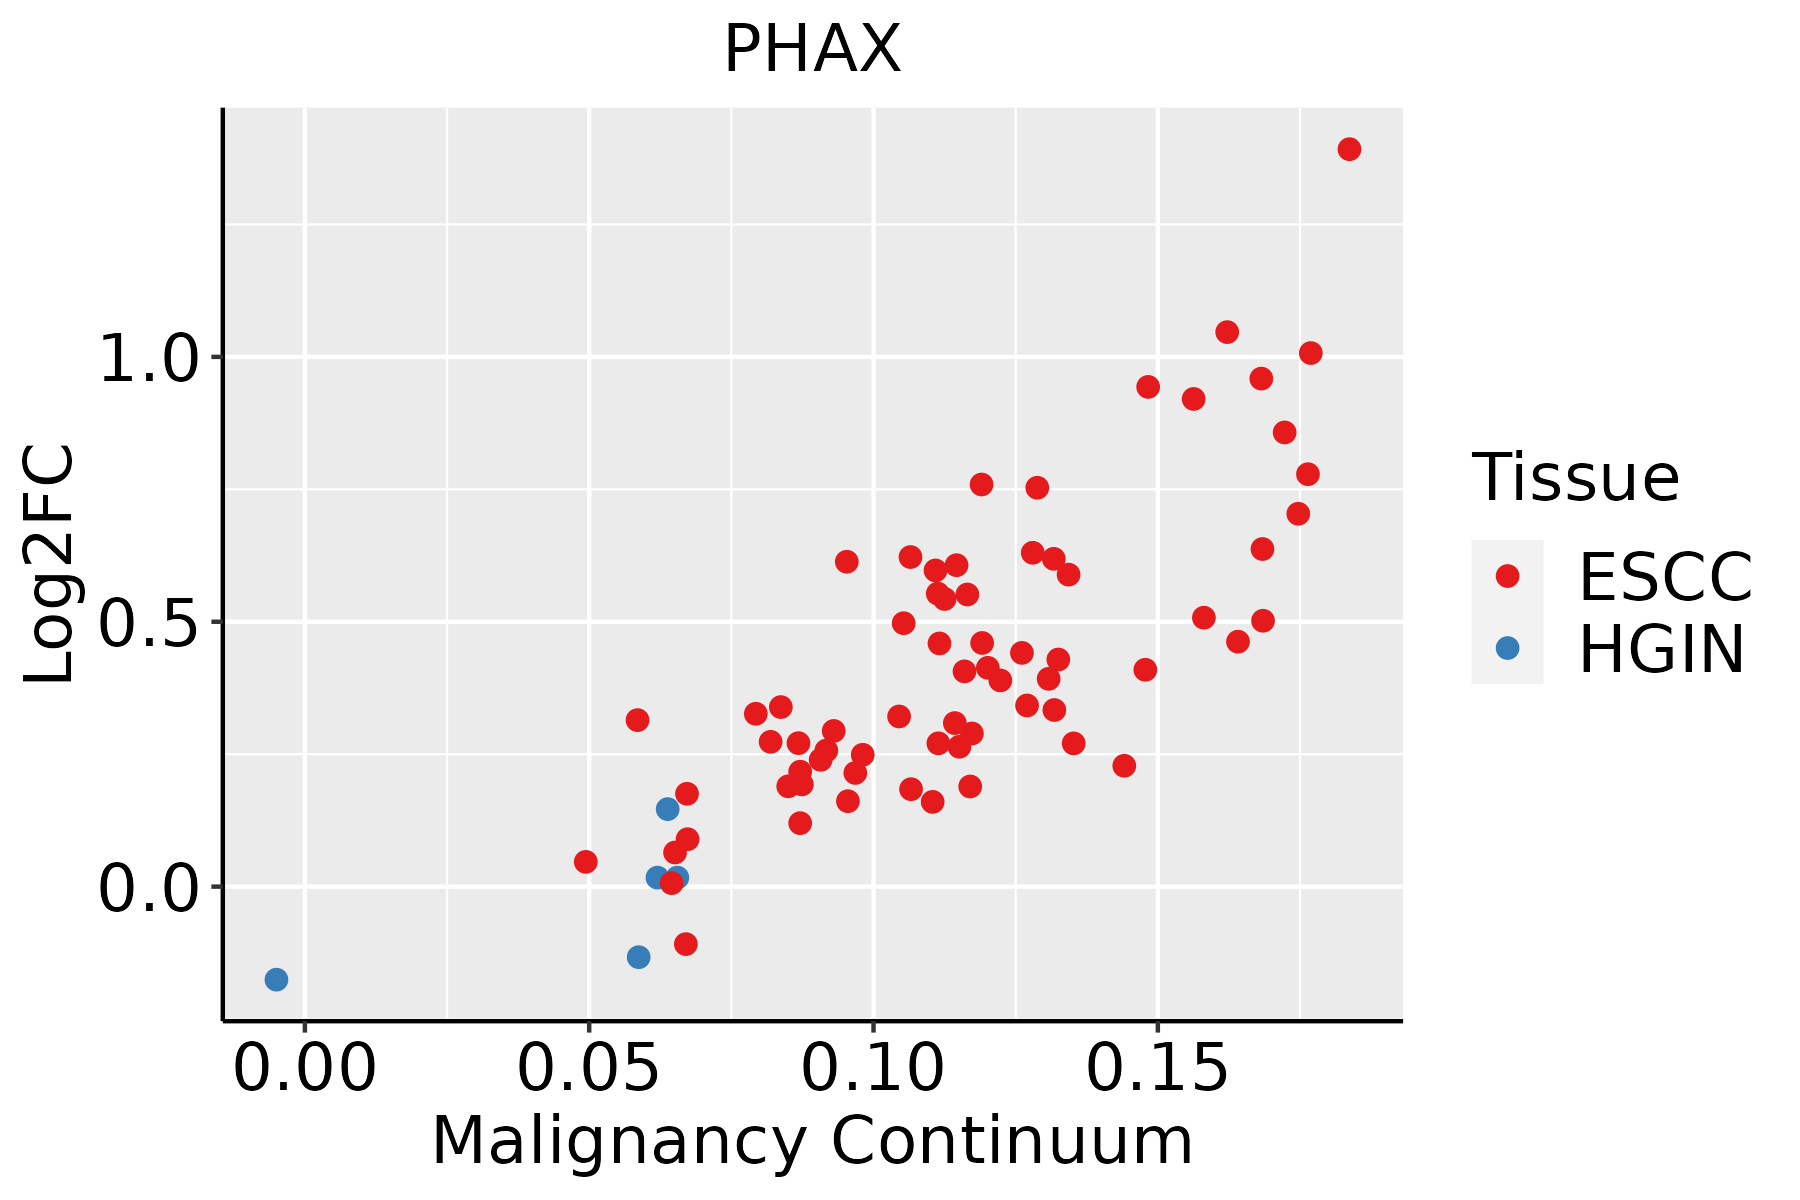 | ESCC: Esophageal squamous cell carcinoma |
| HGIN: High-grade intraepithelial neoplasias | ||
| LGIN: Low-grade intraepithelial neoplasias | ||
| Liver |  | HCC: Hepatocellular carcinoma |
| NAFLD: Non-alcoholic fatty liver disease | ||
| Oral Cavity | 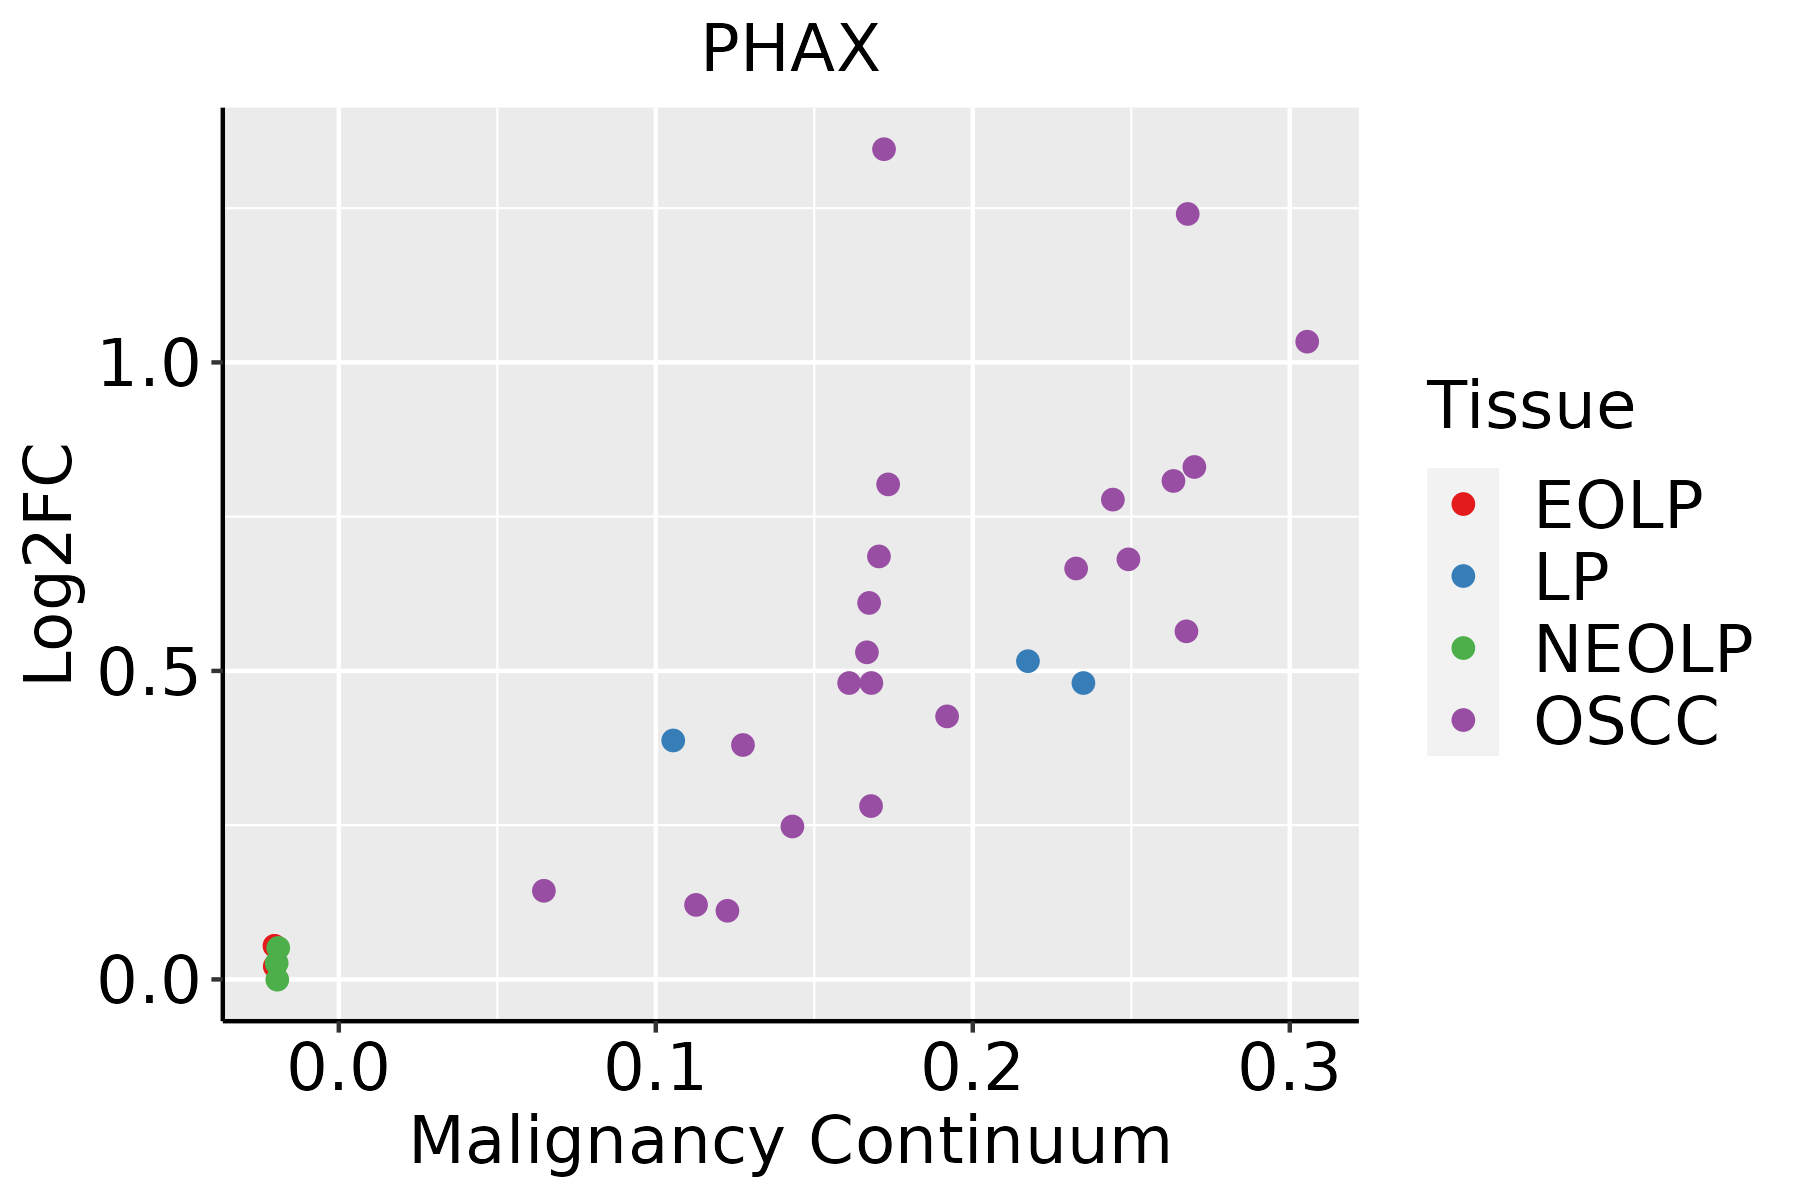 | EOLP: Erosive Oral lichen planus |
| LP: leukoplakia | ||
| NEOLP: Non-erosive oral lichen planus | ||
| OSCC: Oral squamous cell carcinoma | ||
| Skin | 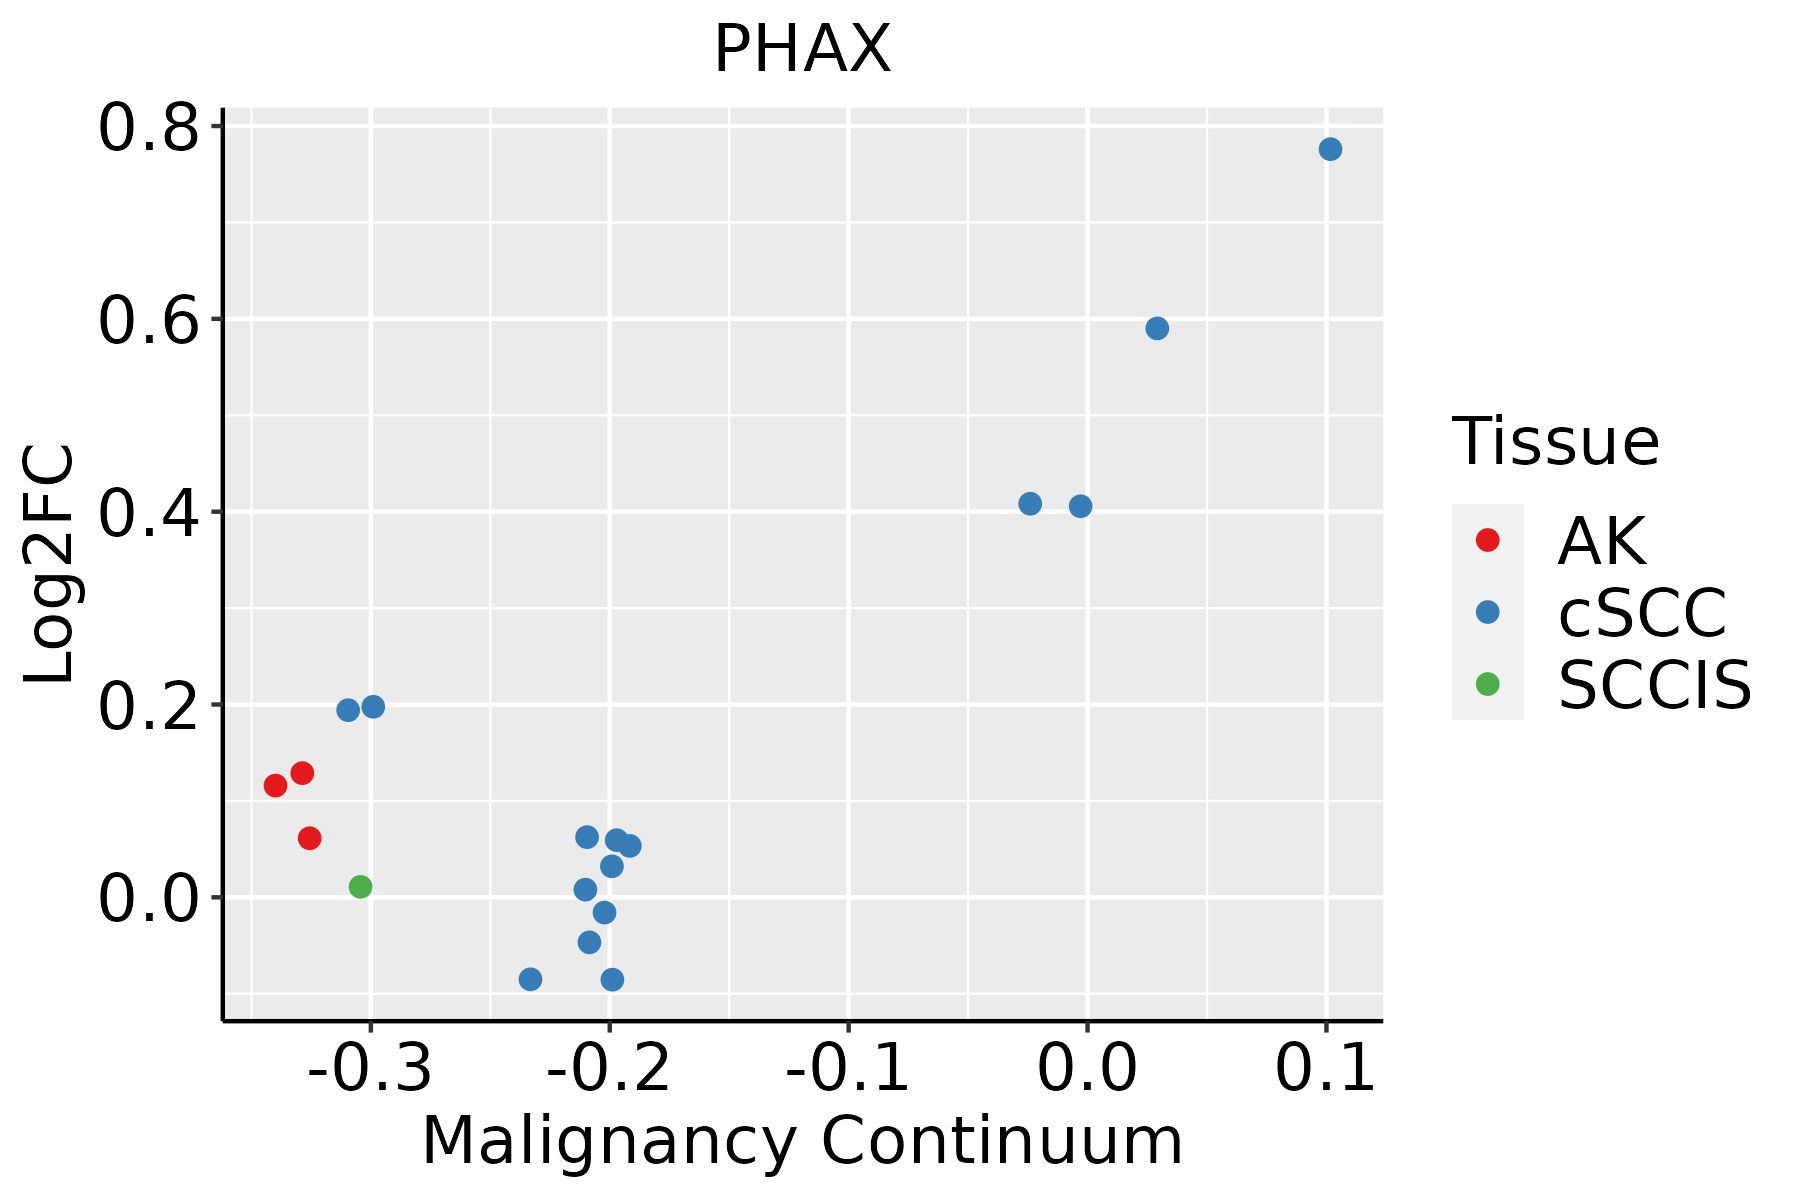 | AK: Actinic keratosis |
| cSCC: Cutaneous squamous cell carcinoma | ||
| SCCIS:squamous cell carcinoma in situ | ||
| Thyroid |  | ATC: Anaplastic thyroid cancer |
| HT: Hashimoto's thyroiditis | ||
| PTC: Papillary thyroid cancer |
| ∗log2FC in expression of this searched gene in stem-like cells from each diseased tissue sample relative to stem-like cells in normal samples in each tissue plotted against the malignancy continuum. Samples are colored based on if they are from different disease stage. |
Top |
Malignant transformation related pathway analysis |
| Find out the enriched GO biological processes and KEGG pathways involved in transition from healthy to precancer to cancer |
| Tissue | Disease Stage | Enriched GO biological Processes |
| Colorectum | AD |  |
| Colorectum | SER |  |
| Colorectum | MSS |  |
| Colorectum | MSI-H |  |
| Colorectum | FAP |  |
| ∗Top 15 enriched GO BP terms are showed in the bar plot of each disease state in each tissue. Each row represents a significant GO biological process which is colored according to the -log10(p.adjust). |
| Page: 1 2 3 4 5 6 7 8 9 |
| GO ID | Tissue | Disease Stage | Description | Gene Ratio | Bg Ratio | pvalue | p.adjust | Count |
| GO:0006403110 | Esophagus | ESCC | RNA localization | 166/8552 | 201/18723 | 1.95e-27 | 6.18e-25 | 166 |
| GO:0006401110 | Esophagus | ESCC | RNA catabolic process | 204/8552 | 278/18723 | 3.39e-21 | 5.66e-19 | 204 |
| GO:005123617 | Esophagus | ESCC | establishment of RNA localization | 134/8552 | 166/18723 | 1.23e-20 | 1.81e-18 | 134 |
| GO:0051168110 | Esophagus | ESCC | nuclear export | 126/8552 | 154/18723 | 1.88e-20 | 2.65e-18 | 126 |
| GO:005065717 | Esophagus | ESCC | nucleic acid transport | 131/8552 | 163/18723 | 6.94e-20 | 8.46e-18 | 131 |
| GO:005065817 | Esophagus | ESCC | RNA transport | 131/8552 | 163/18723 | 6.94e-20 | 8.46e-18 | 131 |
| GO:0034655110 | Esophagus | ESCC | nucleobase-containing compound catabolic process | 272/8552 | 407/18723 | 2.92e-18 | 2.90e-16 | 272 |
| GO:001593117 | Esophagus | ESCC | nucleobase-containing compound transport | 162/8552 | 222/18723 | 9.87e-17 | 7.93e-15 | 162 |
| GO:004670018 | Esophagus | ESCC | heterocycle catabolic process | 286/8552 | 445/18723 | 1.12e-15 | 7.47e-14 | 286 |
| GO:004427019 | Esophagus | ESCC | cellular nitrogen compound catabolic process | 288/8552 | 451/18723 | 3.03e-15 | 1.79e-13 | 288 |
| GO:001943918 | Esophagus | ESCC | aromatic compound catabolic process | 295/8552 | 467/18723 | 1.09e-14 | 5.98e-13 | 295 |
| GO:190136118 | Esophagus | ESCC | organic cyclic compound catabolic process | 307/8552 | 495/18723 | 9.99e-14 | 4.80e-12 | 307 |
| GO:000640512 | Esophagus | ESCC | RNA export from nucleus | 68/8552 | 84/18723 | 2.99e-11 | 1.01e-09 | 68 |
| GO:0009895111 | Esophagus | ESCC | negative regulation of catabolic process | 201/8552 | 320/18723 | 3.88e-10 | 1.05e-08 | 201 |
| GO:004348719 | Esophagus | ESCC | regulation of RNA stability | 117/8552 | 170/18723 | 7.91e-10 | 1.94e-08 | 117 |
| GO:0031330111 | Esophagus | ESCC | negative regulation of cellular catabolic process | 166/8552 | 262/18723 | 5.17e-09 | 1.08e-07 | 166 |
| GO:190236916 | Esophagus | ESCC | negative regulation of RNA catabolic process | 46/8552 | 75/18723 | 4.54e-03 | 1.78e-02 | 46 |
| GO:190136111 | Liver | Cirrhotic | organic cyclic compound catabolic process | 213/4634 | 495/18723 | 1.58e-19 | 3.67e-17 | 213 |
| GO:001943911 | Liver | Cirrhotic | aromatic compound catabolic process | 202/4634 | 467/18723 | 6.93e-19 | 1.28e-16 | 202 |
| GO:004427011 | Liver | Cirrhotic | cellular nitrogen compound catabolic process | 195/4634 | 451/18723 | 2.99e-18 | 4.94e-16 | 195 |
| Page: 1 2 3 4 5 6 7 8 9 10 |
| Pathway ID | Tissue | Disease Stage | Description | Gene Ratio | Bg Ratio | pvalue | p.adjust | qvalue | Count |
| hsa0301321 | Esophagus | ESCC | Nucleocytoplasmic transport | 89/4205 | 108/8465 | 1.20e-12 | 2.37e-11 | 1.21e-11 | 89 |
| hsa0301331 | Esophagus | ESCC | Nucleocytoplasmic transport | 89/4205 | 108/8465 | 1.20e-12 | 2.37e-11 | 1.21e-11 | 89 |
| hsa03013 | Liver | HCC | Nucleocytoplasmic transport | 81/4020 | 108/8465 | 4.28e-09 | 6.83e-08 | 3.80e-08 | 81 |
| hsa030131 | Liver | HCC | Nucleocytoplasmic transport | 81/4020 | 108/8465 | 4.28e-09 | 6.83e-08 | 3.80e-08 | 81 |
| hsa030136 | Oral cavity | OSCC | Nucleocytoplasmic transport | 82/3704 | 108/8465 | 7.93e-12 | 1.33e-10 | 6.77e-11 | 82 |
| hsa0301311 | Oral cavity | OSCC | Nucleocytoplasmic transport | 82/3704 | 108/8465 | 7.93e-12 | 1.33e-10 | 6.77e-11 | 82 |
| Page: 1 |
Top |
Cell-cell communication analysis |
| Identification of potential cell-cell interactions between two cell types and their ligand-receptor pairs for different disease states |
| Ligand | Receptor | LRpair | Pathway | Tissue | Disease Stage |
| Page: 1 |
Top |
Single-cell gene regulatory network inference analysis |
| Find out the significant the regulons (TFs) and the target genes of each regulon across cell types for different disease states |
| TF | Cell Type | Tissue | Disease Stage | Target Gene | RSS | Regulon Activity |
| ∗The dot plots of a searched regulon are shown for all cell subpopulations in each disease state of each tissue based on the regulon specific score inferred using pySCENIC and by calculating the average expression. |
| Page: 1 |
Top |
Somatic mutation of malignant transformation related genes |
| Annotation of somatic variants for genes involved in malignant transformation |
| Hugo Symbol | Variant Class | Variant Classification | dbSNP RS | HGVSc | HGVSp | HGVSp Short | SWISSPROT | BIOTYPE | SIFT | PolyPhen | Tumor Sample Barcode | Tissue | Histology | Sex | Age | Stage | Therapy Types | Drugs | Outcome |
| PHAX | SNV | Missense_Mutation | c.466N>T | p.Leu156Phe | p.L156F | Q9H814 | protein_coding | deleterious(0.03) | benign(0.305) | TCGA-B6-A0WZ-01 | Breast | breast invasive carcinoma | Female | <65 | I/II | Unknown | Unknown | PD | |
| PHAX | SNV | Missense_Mutation | novel | c.322N>T | p.Val108Phe | p.V108F | Q9H814 | protein_coding | tolerated(0.24) | benign(0) | TCGA-BH-A209-01 | Breast | breast invasive carcinoma | Female | >=65 | I/II | Unknown | Unknown | SD |
| PHAX | SNV | Missense_Mutation | novel | c.979N>G | p.Thr327Ala | p.T327A | Q9H814 | protein_coding | tolerated(0.22) | benign(0.006) | TCGA-AA-3949-01 | Colorectum | colon adenocarcinoma | Female | >=65 | III/IV | Unknown | Unknown | SD |
| PHAX | SNV | Missense_Mutation | novel | c.354N>T | p.Trp118Cys | p.W118C | Q9H814 | protein_coding | deleterious(0) | probably_damaging(0.956) | TCGA-AA-3984-01 | Colorectum | colon adenocarcinoma | Female | <65 | I/II | Unknown | Unknown | SD |
| PHAX | SNV | Missense_Mutation | c.1002N>T | p.Met334Ile | p.M334I | Q9H814 | protein_coding | tolerated(0.05) | benign(0.005) | TCGA-AA-A00N-01 | Colorectum | colon adenocarcinoma | Male | >=65 | I/II | Unknown | Unknown | PD | |
| PHAX | SNV | Missense_Mutation | c.435N>T | p.Arg145Ser | p.R145S | Q9H814 | protein_coding | tolerated(0.55) | benign(0.001) | TCGA-AZ-5403-01 | Colorectum | colon adenocarcinoma | Male | <65 | I/II | Unknown | Unknown | PD | |
| PHAX | SNV | Missense_Mutation | novel | c.646N>C | p.Lys216Gln | p.K216Q | Q9H814 | protein_coding | deleterious(0.04) | probably_damaging(0.961) | TCGA-CA-6717-01 | Colorectum | colon adenocarcinoma | Male | <65 | I/II | Chemotherapy | oxaliplatin | CR |
| PHAX | SNV | Missense_Mutation | c.986N>G | p.Val329Gly | p.V329G | Q9H814 | protein_coding | deleterious(0) | benign(0.261) | TCGA-CM-6677-01 | Colorectum | colon adenocarcinoma | Female | >=65 | I/II | Unknown | Unknown | SD | |
| PHAX | SNV | Missense_Mutation | c.951N>C | p.Glu317Asp | p.E317D | Q9H814 | protein_coding | tolerated(0.09) | benign(0.024) | TCGA-G4-6588-01 | Colorectum | colon adenocarcinoma | Female | <65 | I/II | Unknown | Unknown | SD | |
| PHAX | SNV | Missense_Mutation | novel | c.554N>A | p.Met185Lys | p.M185K | Q9H814 | protein_coding | tolerated(0.91) | benign(0) | TCGA-AG-A00Y-01 | Colorectum | rectum adenocarcinoma | Male | >=65 | I/II | Unknown | Unknown | PD |
| Page: 1 2 3 4 |
Top |
Related drugs of malignant transformation related genes |
| Identification of chemicals and drugs interact with genes involved in malignant transfromation |
| (DGIdb 4.0) |
| Entrez ID | Symbol | Category | Interaction Types | Drug Claim Name | Drug Name | PMIDs |
| Page: 1 |

Copyright 2023-Present -The University of Texas Health Science Center at Houston |