
|
|||||
|
 | |
| |
| |
| |
| |
| |
|
Gene: PDK4 |
Gene summary for PDK4 |
| Gene information | Species | Human | Gene symbol | PDK4 | Gene ID | 5166 |
| Gene name | pyruvate dehydrogenase kinase 4 | |
| Gene Alias | PDK4 | |
| Cytomap | 7q21.3 | |
| Gene Type | protein-coding | GO ID | GO:0001894 | UniProtAcc | A4D1H4 |
Top |
Malignant transformation analysis |
| Identification of the aberrant gene expression in precancerous and cancerous lesions by comparing the gene expression of stem-like cells in diseased tissues with normal stem cells |
| Entrez ID | Symbol | Replicates | Species | Organ | Tissue | Adj P-value | Log2FC | Malignancy |
| 5166 | PDK4 | GSM4909280 | Human | Breast | Precancer | 1.02e-04 | 5.73e-01 | 0.0305 |
| 5166 | PDK4 | GSM4909281 | Human | Breast | IDC | 5.37e-03 | -1.67e-01 | 0.21 |
| 5166 | PDK4 | GSM4909282 | Human | Breast | IDC | 3.66e-05 | -1.72e-01 | -0.0288 |
| 5166 | PDK4 | GSM4909285 | Human | Breast | IDC | 3.66e-05 | -1.72e-01 | 0.21 |
| 5166 | PDK4 | GSM4909286 | Human | Breast | IDC | 1.72e-05 | -1.74e-01 | 0.1081 |
| 5166 | PDK4 | GSM4909290 | Human | Breast | IDC | 5.07e-03 | -1.74e-01 | 0.2096 |
| 5166 | PDK4 | GSM4909296 | Human | Breast | IDC | 1.64e-03 | -1.56e-01 | 0.1524 |
| 5166 | PDK4 | GSM4909311 | Human | Breast | IDC | 1.15e-04 | -1.24e-01 | 0.1534 |
| 5166 | PDK4 | GSM4909315 | Human | Breast | IDC | 1.72e-05 | -1.74e-01 | 0.21 |
| 5166 | PDK4 | GSM4909319 | Human | Breast | IDC | 1.47e-08 | 1.42e-02 | 0.1563 |
| 5166 | PDK4 | brca2 | Human | Breast | Precancer | 1.09e-03 | 2.44e-01 | -0.024 |
| 5166 | PDK4 | NCCBC5 | Human | Breast | DCIS | 2.81e-03 | -1.74e-01 | 0.2046 |
| 5166 | PDK4 | DCIS2 | Human | Breast | DCIS | 1.66e-30 | 5.89e-01 | 0.0085 |
| 5166 | PDK4 | NAFLD1 | Human | Liver | NAFLD | 2.30e-02 | 4.03e-01 | -0.04 |
| 5166 | PDK4 | S43 | Human | Liver | Cirrhotic | 9.81e-08 | 1.57e-01 | -0.0187 |
| 5166 | PDK4 | S44 | Human | Liver | HCC | 3.51e-23 | 1.73e+00 | -0.0083 |
| 5166 | PDK4 | HCC1_Meng | Human | Liver | HCC | 4.47e-04 | -1.99e-01 | 0.0246 |
| 5166 | PDK4 | HCC2_Meng | Human | Liver | HCC | 4.09e-14 | 2.06e-03 | 0.0107 |
| 5166 | PDK4 | HCC1 | Human | Liver | HCC | 9.06e-05 | 2.46e+00 | 0.5336 |
| 5166 | PDK4 | HCC2 | Human | Liver | HCC | 1.26e-04 | 2.96e+00 | 0.5341 |
| Page: 1 2 3 4 5 6 |
| Tissue | Expression Dynamics | Abbreviation |
| Breast | 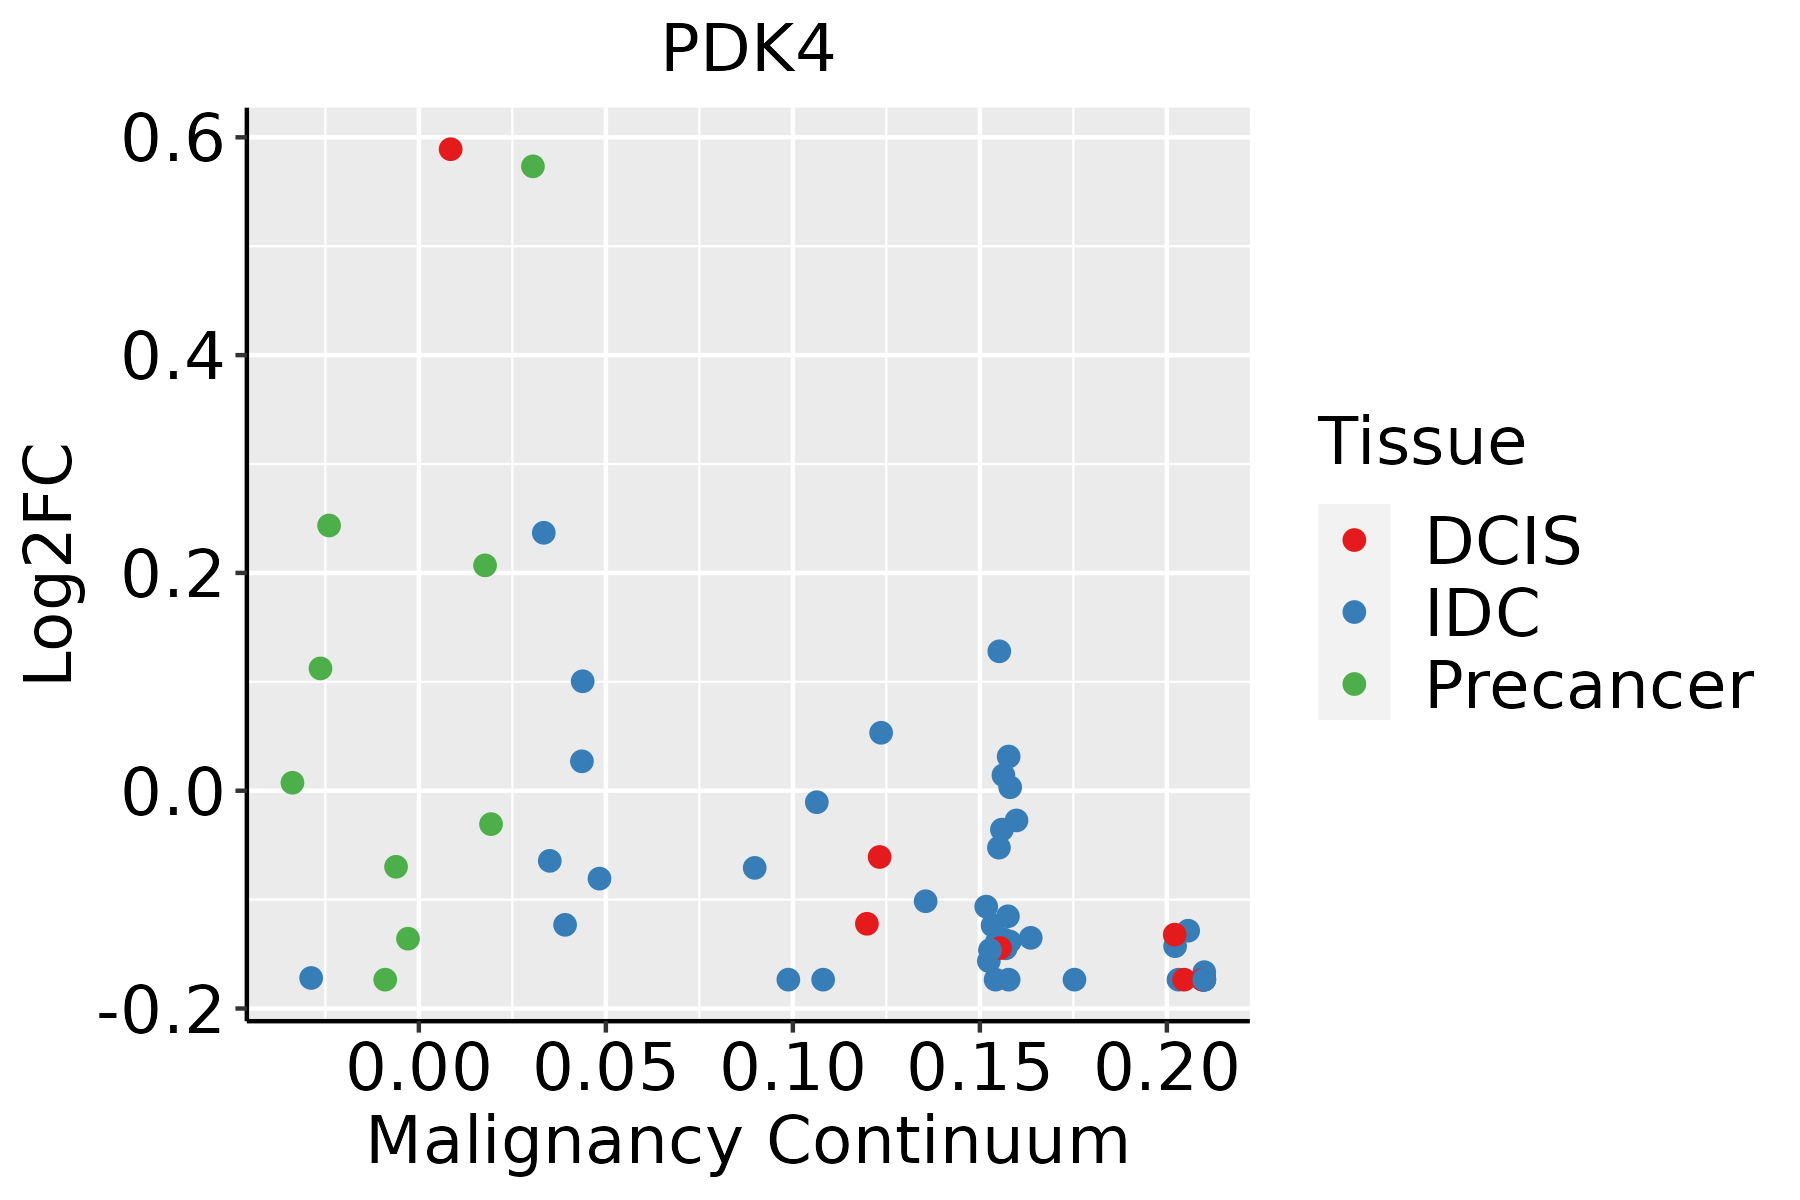 | IDC: Invasive ductal carcinoma |
| DCIS: Ductal carcinoma in situ | ||
| Precancer(BRCA1-mut): Precancerous lesion from BRCA1 mutation carriers | ||
| GC | 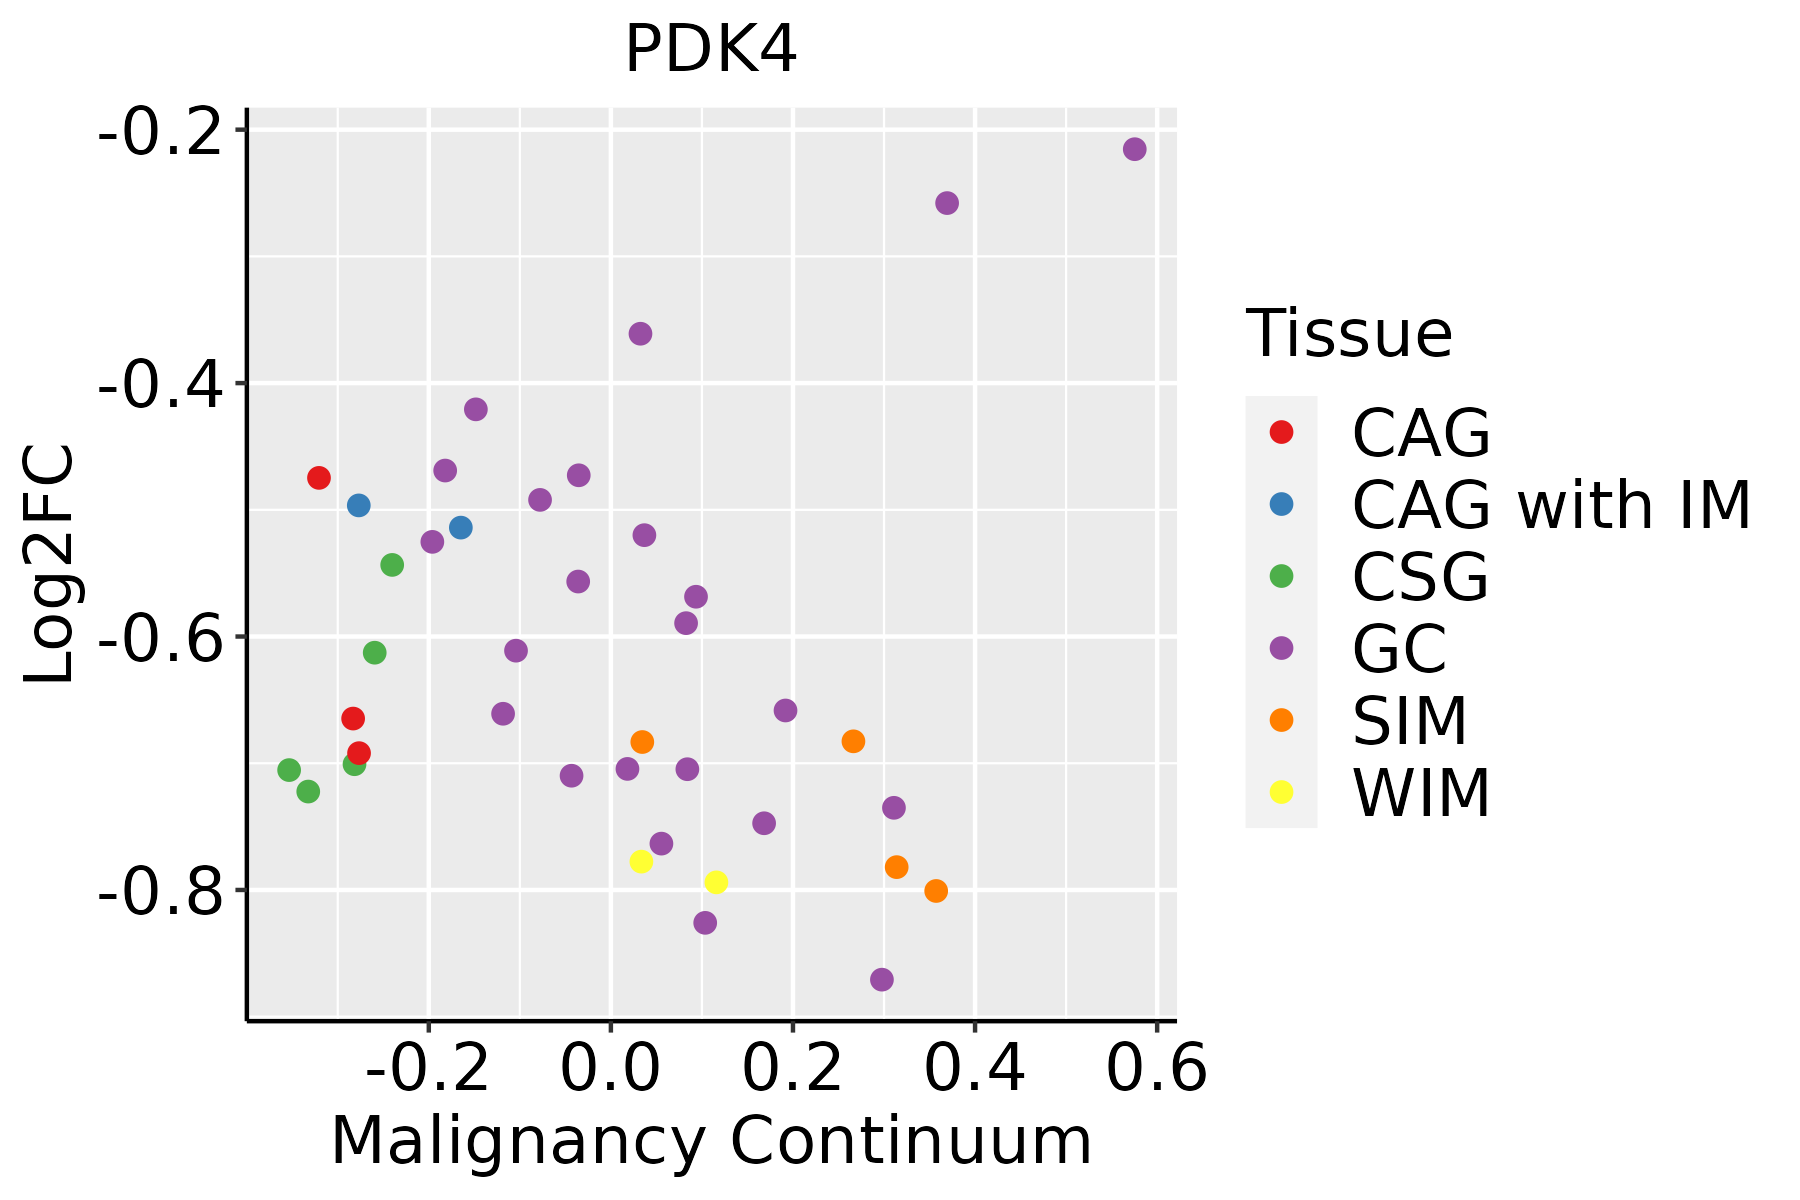 | CAG: Chronic atrophic gastritis |
| CAG with IM: Chronic atrophic gastritis with intestinal metaplasia | ||
| CSG: Chronic superficial gastritis | ||
| GC: Gastric cancer | ||
| SIM: Severe intestinal metaplasia | ||
| WIM: Wild intestinal metaplasia | ||
| Liver | 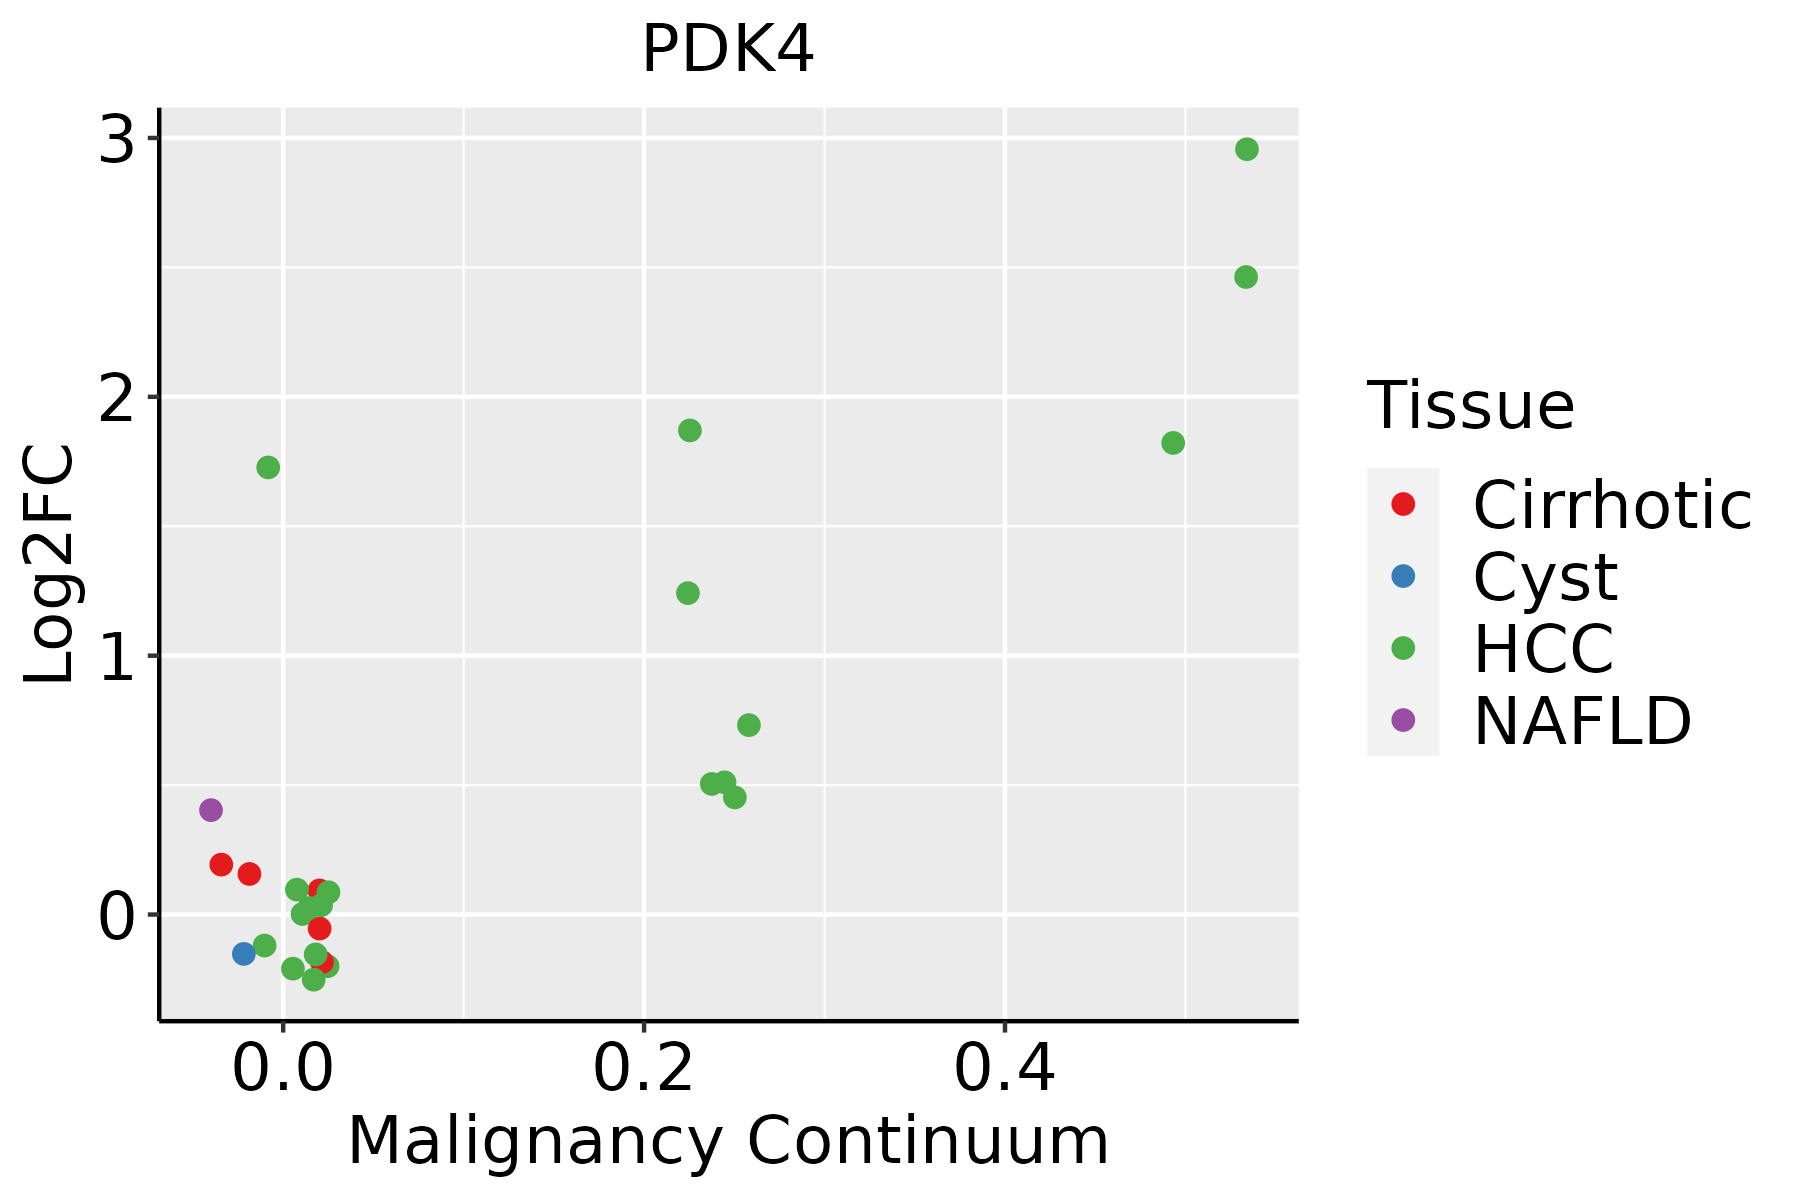 | HCC: Hepatocellular carcinoma |
| NAFLD: Non-alcoholic fatty liver disease | ||
| Oral Cavity | 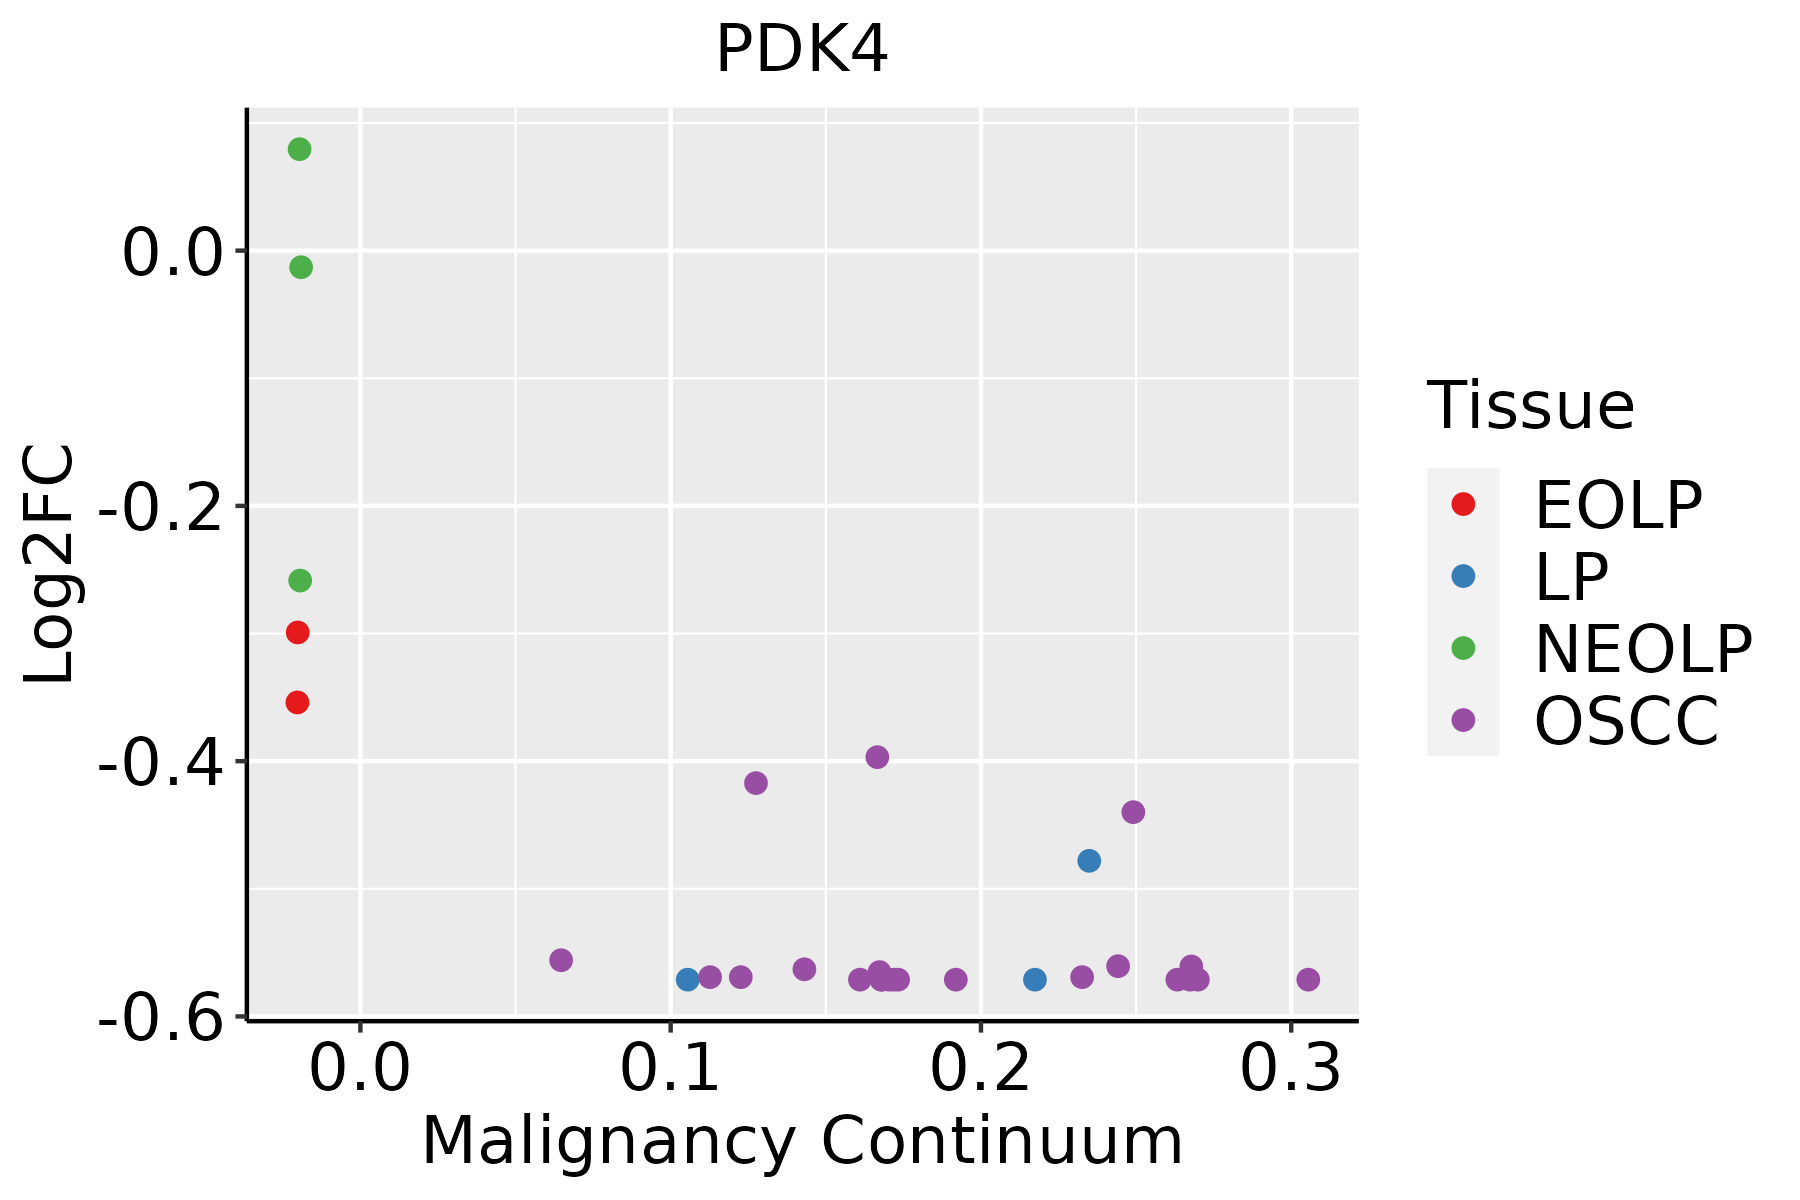 | EOLP: Erosive Oral lichen planus |
| LP: leukoplakia | ||
| NEOLP: Non-erosive oral lichen planus | ||
| OSCC: Oral squamous cell carcinoma | ||
| Prostate | 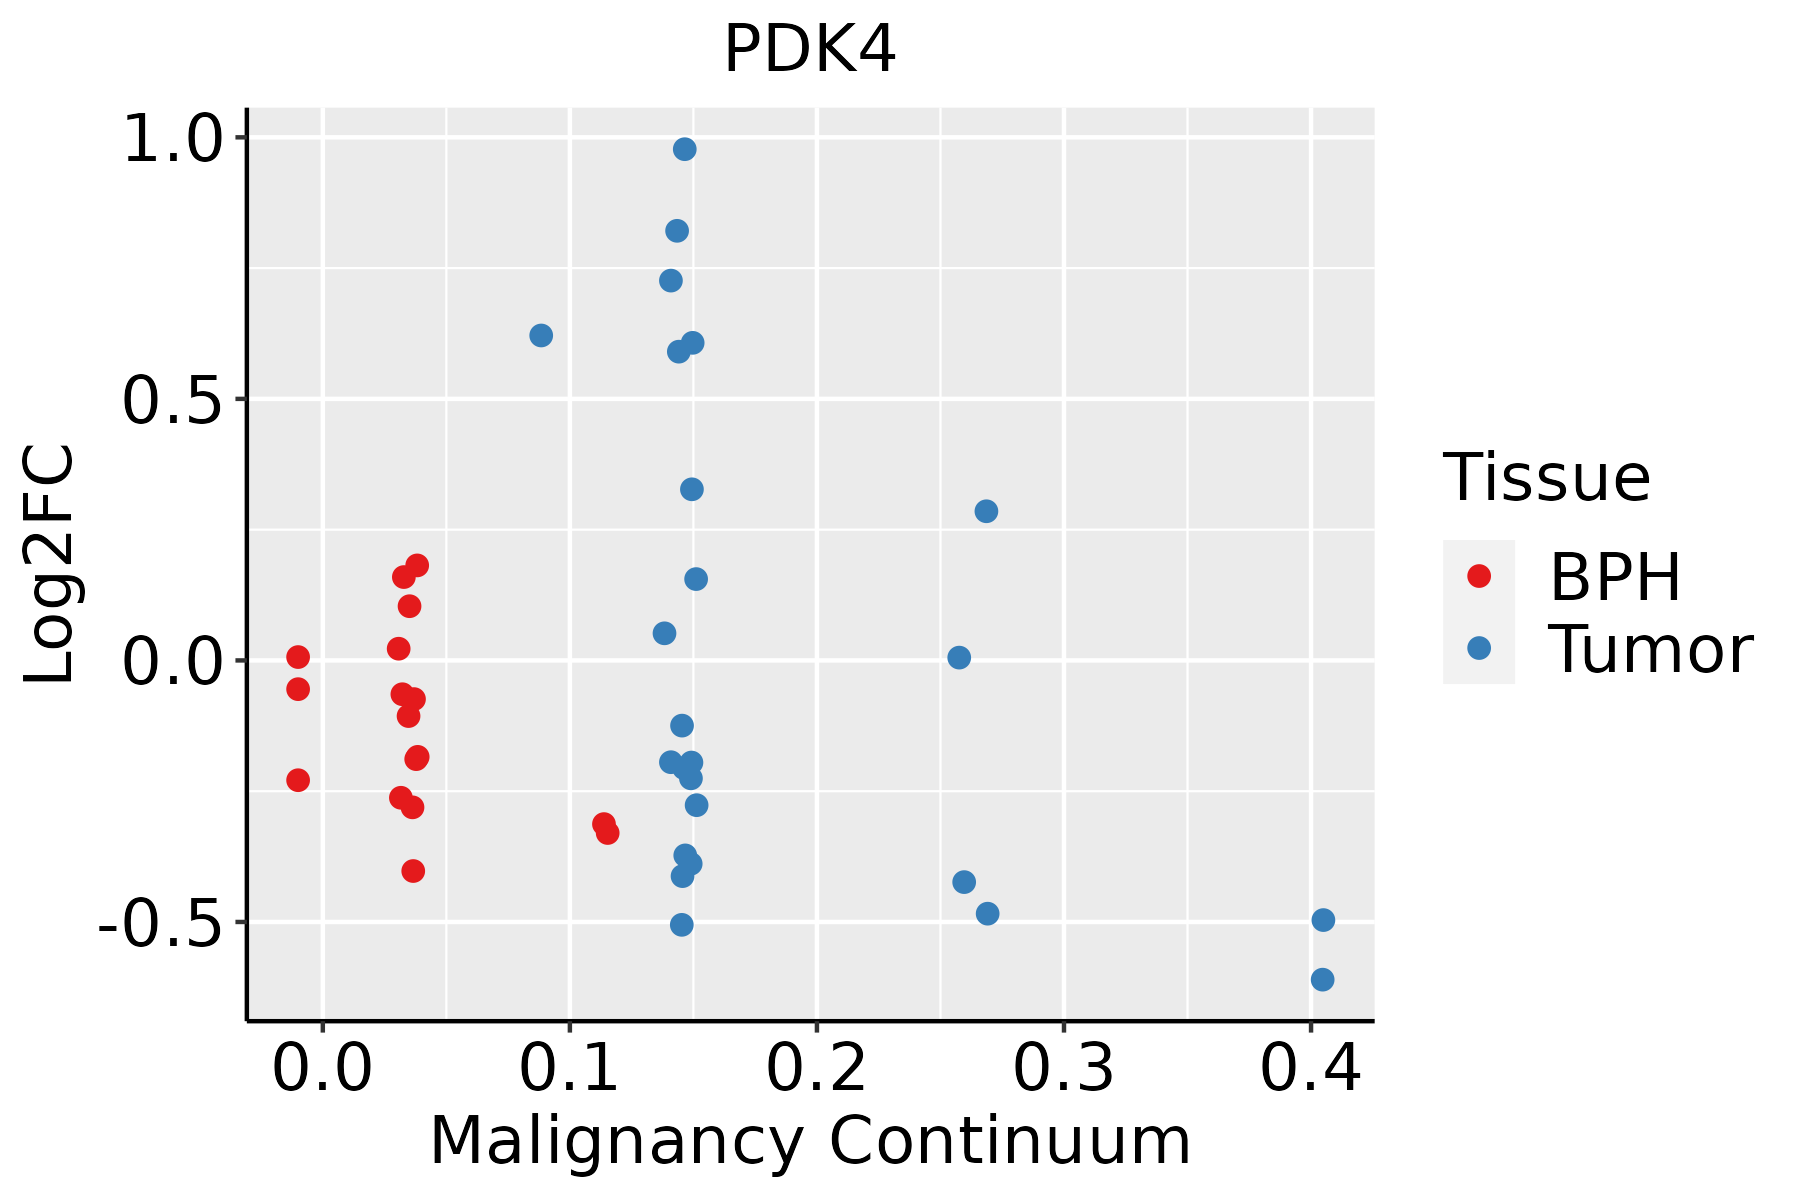 | BPH: Benign Prostatic Hyperplasia |
| Thyroid | 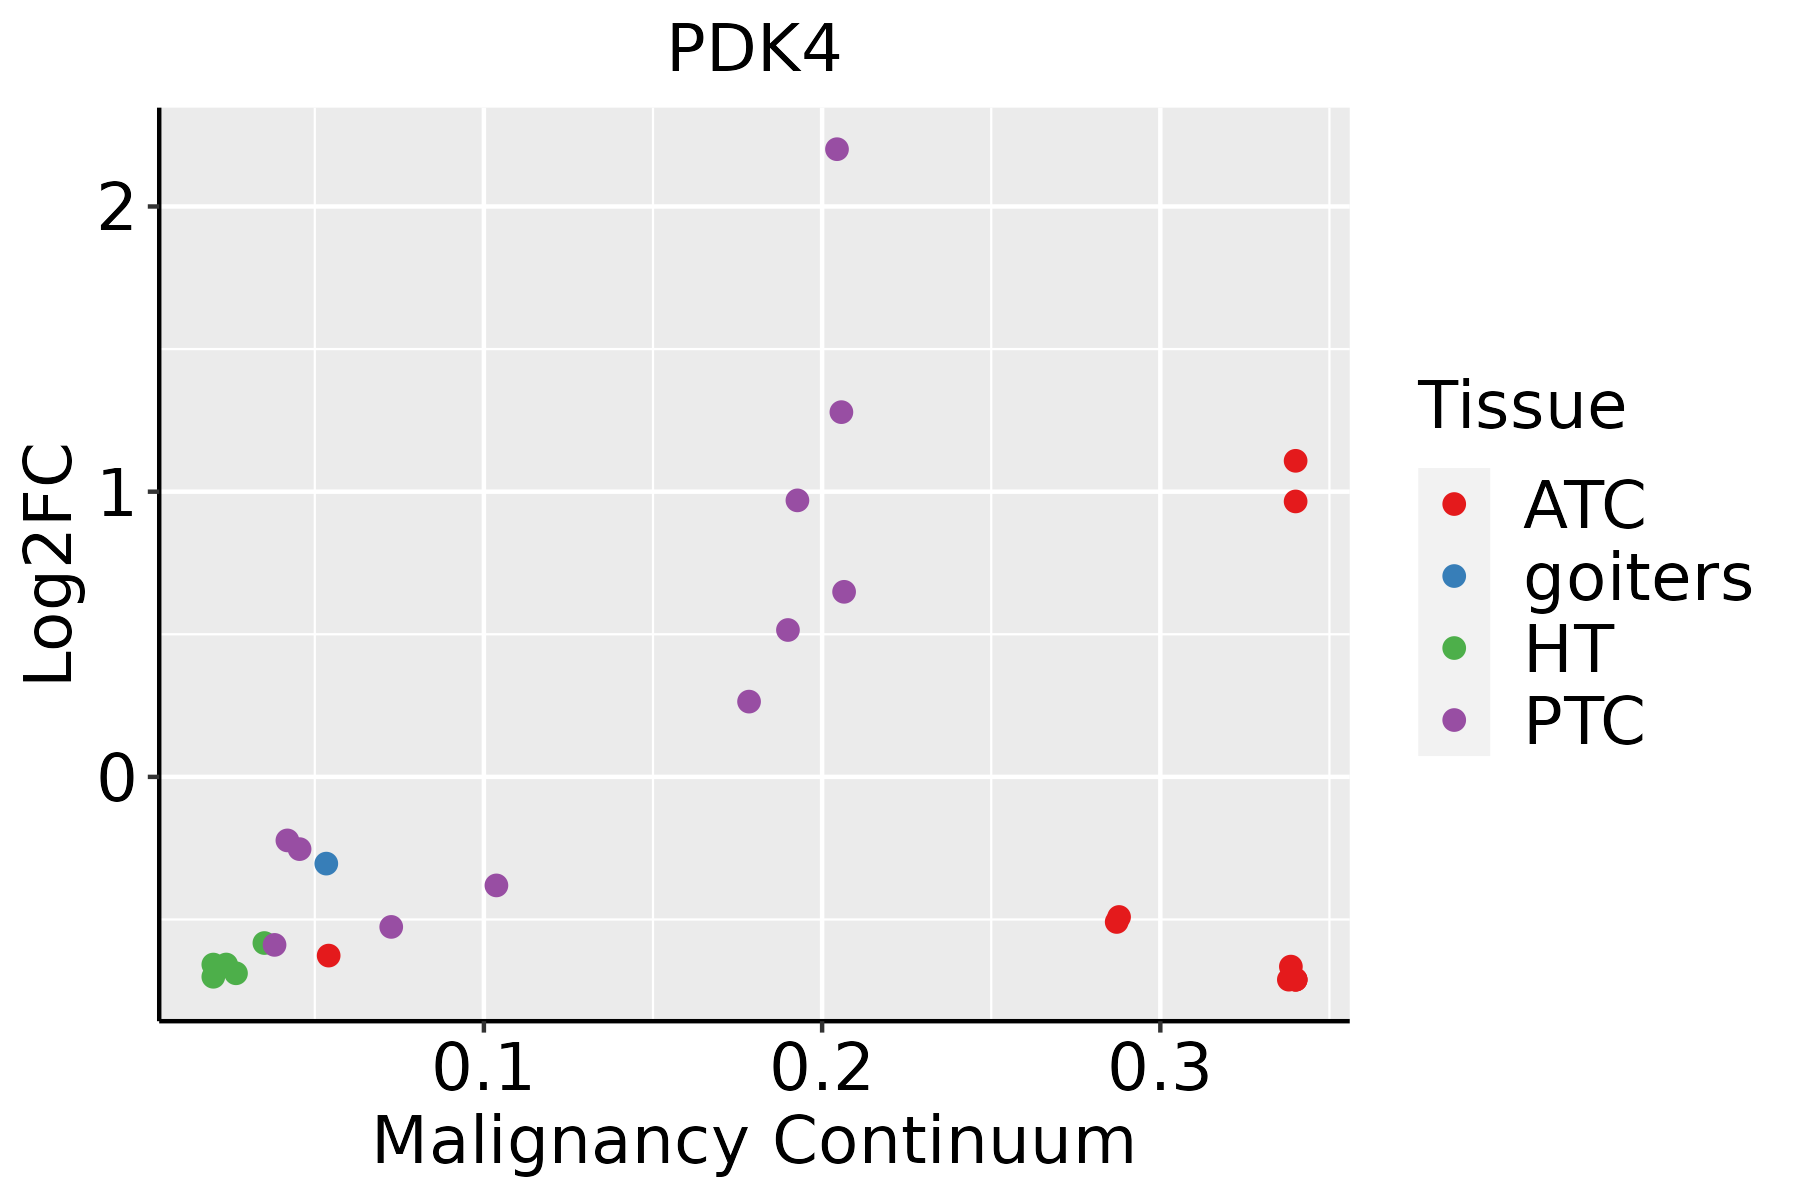 | ATC: Anaplastic thyroid cancer |
| HT: Hashimoto's thyroiditis | ||
| PTC: Papillary thyroid cancer |
| ∗log2FC in expression of this searched gene in stem-like cells from each diseased tissue sample relative to stem-like cells in normal samples in each tissue plotted against the malignancy continuum. Samples are colored based on if they are from different disease stage. |
Top |
Malignant transformation related pathway analysis |
| Find out the enriched GO biological processes and KEGG pathways involved in transition from healthy to precancer to cancer |
| Tissue | Disease Stage | Enriched GO biological Processes |
| Colorectum | AD |  |
| Colorectum | SER |  |
| Colorectum | MSS |  |
| Colorectum | MSI-H |  |
| Colorectum | FAP |  |
| ∗Top 15 enriched GO BP terms are showed in the bar plot of each disease state in each tissue. Each row represents a significant GO biological process which is colored according to the -log10(p.adjust). |
| Page: 1 2 3 4 5 6 7 8 9 |
| GO ID | Tissue | Disease Stage | Description | Gene Ratio | Bg Ratio | pvalue | p.adjust | Count |
| GO:003350013 | Breast | IDC | carbohydrate homeostasis | 34/1434 | 259/18723 | 1.43e-03 | 1.46e-02 | 34 |
| GO:007233012 | Breast | IDC | monocarboxylic acid biosynthetic process | 29/1434 | 214/18723 | 1.91e-03 | 1.83e-02 | 29 |
| GO:001605313 | Breast | IDC | organic acid biosynthetic process | 39/1434 | 316/18723 | 2.13e-03 | 1.99e-02 | 39 |
| GO:000189413 | Breast | IDC | tissue homeostasis | 34/1434 | 268/18723 | 2.54e-03 | 2.28e-02 | 34 |
| GO:000663312 | Breast | IDC | fatty acid biosynthetic process | 23/1434 | 163/18723 | 3.21e-03 | 2.70e-02 | 23 |
| GO:004639413 | Breast | IDC | carboxylic acid biosynthetic process | 38/1434 | 314/18723 | 3.39e-03 | 2.83e-02 | 38 |
| GO:004230411 | Breast | IDC | regulation of fatty acid biosynthetic process | 10/1434 | 49/18723 | 3.51e-03 | 2.90e-02 | 10 |
| GO:003166914 | Breast | IDC | cellular response to nutrient levels | 28/1434 | 215/18723 | 4.02e-03 | 3.25e-02 | 28 |
| GO:00328687 | Breast | IDC | response to insulin | 32/1434 | 264/18723 | 6.61e-03 | 4.62e-02 | 32 |
| GO:00328697 | Breast | IDC | cellular response to insulin stimulus | 26/1434 | 203/18723 | 6.74e-03 | 4.68e-02 | 26 |
| GO:000915223 | Breast | DCIS | purine ribonucleotide biosynthetic process | 34/1390 | 169/18723 | 7.77e-08 | 4.47e-06 | 34 |
| GO:004639022 | Breast | DCIS | ribose phosphate biosynthetic process | 36/1390 | 190/18723 | 1.59e-07 | 8.19e-06 | 36 |
| GO:000926022 | Breast | DCIS | ribonucleotide biosynthetic process | 35/1390 | 182/18723 | 1.62e-07 | 8.24e-06 | 35 |
| GO:001969324 | Breast | DCIS | ribose phosphate metabolic process | 58/1390 | 396/18723 | 4.80e-07 | 2.11e-05 | 58 |
| GO:000915024 | Breast | DCIS | purine ribonucleotide metabolic process | 55/1390 | 368/18723 | 4.92e-07 | 2.14e-05 | 55 |
| GO:000925924 | Breast | DCIS | ribonucleotide metabolic process | 56/1390 | 385/18723 | 9.44e-07 | 3.79e-05 | 56 |
| GO:000616422 | Breast | DCIS | purine nucleotide biosynthetic process | 34/1390 | 191/18723 | 1.56e-06 | 5.88e-05 | 34 |
| GO:000616324 | Breast | DCIS | purine nucleotide metabolic process | 56/1390 | 396/18723 | 2.31e-06 | 8.29e-05 | 56 |
| GO:000911723 | Breast | DCIS | nucleotide metabolic process | 65/1390 | 489/18723 | 3.19e-06 | 1.03e-04 | 65 |
| GO:007252222 | Breast | DCIS | purine-containing compound biosynthetic process | 34/1390 | 200/18723 | 4.51e-06 | 1.34e-04 | 34 |
| Page: 1 2 3 4 5 6 7 8 9 10 11 12 13 14 15 16 17 18 19 20 21 22 23 24 25 26 27 28 29 30 31 32 33 34 35 36 |
| Pathway ID | Tissue | Disease Stage | Description | Gene Ratio | Bg Ratio | pvalue | p.adjust | qvalue | Count |
| hsa0541518 | Breast | Precancer | Diabetic cardiomyopathy | 63/684 | 203/8465 | 5.63e-22 | 1.48e-20 | 1.14e-20 | 63 |
| hsa0541519 | Breast | Precancer | Diabetic cardiomyopathy | 63/684 | 203/8465 | 5.63e-22 | 1.48e-20 | 1.14e-20 | 63 |
| hsa0541523 | Breast | IDC | Diabetic cardiomyopathy | 67/867 | 203/8465 | 3.17e-19 | 8.59e-18 | 6.43e-18 | 67 |
| hsa0541533 | Breast | IDC | Diabetic cardiomyopathy | 67/867 | 203/8465 | 3.17e-19 | 8.59e-18 | 6.43e-18 | 67 |
| hsa0541543 | Breast | DCIS | Diabetic cardiomyopathy | 65/846 | 203/8465 | 1.81e-18 | 4.87e-17 | 3.59e-17 | 65 |
| hsa0541553 | Breast | DCIS | Diabetic cardiomyopathy | 65/846 | 203/8465 | 1.81e-18 | 4.87e-17 | 3.59e-17 | 65 |
| hsa0541514 | Liver | Cirrhotic | Diabetic cardiomyopathy | 108/2530 | 203/8465 | 1.99e-12 | 4.41e-11 | 2.72e-11 | 108 |
| hsa0541515 | Liver | Cirrhotic | Diabetic cardiomyopathy | 108/2530 | 203/8465 | 1.99e-12 | 4.41e-11 | 2.72e-11 | 108 |
| hsa0541522 | Liver | HCC | Diabetic cardiomyopathy | 151/4020 | 203/8465 | 2.72e-15 | 1.01e-13 | 5.63e-14 | 151 |
| hsa0541532 | Liver | HCC | Diabetic cardiomyopathy | 151/4020 | 203/8465 | 2.72e-15 | 1.01e-13 | 5.63e-14 | 151 |
| hsa0541529 | Oral cavity | OSCC | Diabetic cardiomyopathy | 131/3704 | 203/8465 | 1.33e-09 | 1.49e-08 | 7.57e-09 | 131 |
| hsa05415113 | Oral cavity | OSCC | Diabetic cardiomyopathy | 131/3704 | 203/8465 | 1.33e-09 | 1.49e-08 | 7.57e-09 | 131 |
| hsa0541527 | Prostate | BPH | Diabetic cardiomyopathy | 102/1718 | 203/8465 | 6.06e-22 | 2.00e-20 | 1.24e-20 | 102 |
| hsa05415112 | Prostate | BPH | Diabetic cardiomyopathy | 102/1718 | 203/8465 | 6.06e-22 | 2.00e-20 | 1.24e-20 | 102 |
| hsa0541528 | Prostate | Tumor | Diabetic cardiomyopathy | 103/1791 | 203/8465 | 4.04e-21 | 1.22e-19 | 7.54e-20 | 103 |
| hsa0541536 | Prostate | Tumor | Diabetic cardiomyopathy | 103/1791 | 203/8465 | 4.04e-21 | 1.22e-19 | 7.54e-20 | 103 |
| hsa0541512 | Stomach | GC | Diabetic cardiomyopathy | 56/708 | 203/8465 | 2.48e-16 | 1.14e-14 | 8.00e-15 | 56 |
| hsa0541513 | Stomach | GC | Diabetic cardiomyopathy | 56/708 | 203/8465 | 2.48e-16 | 1.14e-14 | 8.00e-15 | 56 |
| hsa0541521 | Stomach | CAG with IM | Diabetic cardiomyopathy | 56/640 | 203/8465 | 2.41e-18 | 1.10e-16 | 7.69e-17 | 56 |
| hsa0541531 | Stomach | CAG with IM | Diabetic cardiomyopathy | 56/640 | 203/8465 | 2.41e-18 | 1.10e-16 | 7.69e-17 | 56 |
| Page: 1 2 |
Top |
Cell-cell communication analysis |
| Identification of potential cell-cell interactions between two cell types and their ligand-receptor pairs for different disease states |
| Ligand | Receptor | LRpair | Pathway | Tissue | Disease Stage |
| Page: 1 |
Top |
Single-cell gene regulatory network inference analysis |
| Find out the significant the regulons (TFs) and the target genes of each regulon across cell types for different disease states |
| TF | Cell Type | Tissue | Disease Stage | Target Gene | RSS | Regulon Activity |
| ∗The dot plots of a searched regulon are shown for all cell subpopulations in each disease state of each tissue based on the regulon specific score inferred using pySCENIC and by calculating the average expression. |
| Page: 1 |
Top |
Somatic mutation of malignant transformation related genes |
| Annotation of somatic variants for genes involved in malignant transformation |
| Hugo Symbol | Variant Class | Variant Classification | dbSNP RS | HGVSc | HGVSp | HGVSp Short | SWISSPROT | BIOTYPE | SIFT | PolyPhen | Tumor Sample Barcode | Tissue | Histology | Sex | Age | Stage | Therapy Types | Drugs | Outcome |
| PDK4 | SNV | Missense_Mutation | c.1034A>T | p.Gln345Leu | p.Q345L | Q16654 | protein_coding | tolerated(0.07) | benign(0.014) | TCGA-A8-A090-01 | Breast | breast invasive carcinoma | Female | >=65 | I/II | Unknown | Unknown | SD | |
| PDK4 | SNV | Missense_Mutation | c.905N>G | p.Ile302Ser | p.I302S | Q16654 | protein_coding | tolerated(0.07) | benign(0.076) | TCGA-A8-A092-01 | Breast | breast invasive carcinoma | Female | <65 | III/IV | Chemotherapy | paclitaxel | CR | |
| PDK4 | SNV | Missense_Mutation | c.884G>A | p.Gly295Glu | p.G295E | Q16654 | protein_coding | deleterious(0) | probably_damaging(1) | TCGA-AN-A046-01 | Breast | breast invasive carcinoma | Female | >=65 | I/II | Unknown | Unknown | SD | |
| PDK4 | SNV | Missense_Mutation | rs778644301 | c.477N>T | p.Leu159Phe | p.L159F | Q16654 | protein_coding | deleterious(0) | probably_damaging(0.999) | TCGA-GI-A2C8-01 | Breast | breast invasive carcinoma | Female | <65 | III/IV | Unspecific | Adriamycin | SD |
| PDK4 | deletion | Frame_Shift_Del | novel | c.517delN | p.Met173Ter | p.M173* | Q16654 | protein_coding | TCGA-D8-A27V-01 | Breast | breast invasive carcinoma | Female | <65 | I/II | Hormone Therapy | tamoxiphen | SD | ||
| PDK4 | SNV | Missense_Mutation | novel | c.875N>T | p.Ser292Leu | p.S292L | Q16654 | protein_coding | deleterious(0) | probably_damaging(0.989) | TCGA-JW-A5VL-01 | Cervix | cervical & endocervical cancer | Female | <65 | I/II | Unknown | Unknown | SD |
| PDK4 | SNV | Missense_Mutation | c.997N>A | p.Gly333Ser | p.G333S | Q16654 | protein_coding | deleterious(0) | probably_damaging(0.978) | TCGA-AA-3864-01 | Colorectum | colon adenocarcinoma | Male | >=65 | I/II | Unknown | Unknown | SD | |
| PDK4 | SNV | Missense_Mutation | rs142890516 | c.768N>G | p.Phe256Leu | p.F256L | Q16654 | protein_coding | tolerated(0.21) | benign(0.229) | TCGA-AA-A00N-01 | Colorectum | colon adenocarcinoma | Male | >=65 | I/II | Unknown | Unknown | PD |
| PDK4 | SNV | Missense_Mutation | novel | c.680N>G | p.Leu227Arg | p.L227R | Q16654 | protein_coding | deleterious(0) | possibly_damaging(0.747) | TCGA-AA-A00N-01 | Colorectum | colon adenocarcinoma | Male | >=65 | I/II | Unknown | Unknown | PD |
| PDK4 | SNV | Missense_Mutation | novel | c.565A>C | p.Ser189Arg | p.S189R | Q16654 | protein_coding | tolerated(0.94) | benign(0) | TCGA-CA-6717-01 | Colorectum | colon adenocarcinoma | Male | <65 | I/II | Chemotherapy | oxaliplatin | CR |
| Page: 1 2 3 4 5 6 |
Top |
Related drugs of malignant transformation related genes |
| Identification of chemicals and drugs interact with genes involved in malignant transfromation |
| (DGIdb 4.0) |
| Entrez ID | Symbol | Category | Interaction Types | Drug Claim Name | Drug Name | PMIDs |
| 5166 | PDK4 | DRUGGABLE GENOME, SERINE THREONINE KINASE, KINASE, ENZYME | CPI-613 | |||
| 5166 | PDK4 | DRUGGABLE GENOME, SERINE THREONINE KINASE, KINASE, ENZYME | inhibitor | 328083452 |
| Page: 1 |

Copyright 2023-Present -The University of Texas Health Science Center at Houston |