
|
|||||
|
 | |
| |
| |
| |
| |
| |
|
Gene: PCSK1N |
Gene summary for PCSK1N |
| Gene information | Species | Human | Gene symbol | PCSK1N | Gene ID | 27344 |
| Gene name | proprotein convertase subtilisin/kexin type 1 inhibitor | |
| Gene Alias | BigLEN | |
| Cytomap | Xp11.23 | |
| Gene Type | protein-coding | GO ID | GO:0002021 | UniProtAcc | Q9UHG2 |
Top |
Malignant transformation analysis |
| Identification of the aberrant gene expression in precancerous and cancerous lesions by comparing the gene expression of stem-like cells in diseased tissues with normal stem cells |
| Entrez ID | Symbol | Replicates | Species | Organ | Tissue | Adj P-value | Log2FC | Malignancy |
| 27344 | PCSK1N | GSM4909281 | Human | Breast | IDC | 1.43e-65 | 9.98e-01 | 0.21 |
| 27344 | PCSK1N | GSM4909286 | Human | Breast | IDC | 4.74e-71 | 8.93e-01 | 0.1081 |
| 27344 | PCSK1N | GSM4909291 | Human | Breast | IDC | 4.34e-14 | 4.95e-01 | 0.1753 |
| 27344 | PCSK1N | GSM4909295 | Human | Breast | IDC | 4.30e-12 | 4.80e-01 | 0.0898 |
| 27344 | PCSK1N | GSM4909297 | Human | Breast | IDC | 4.90e-18 | 6.22e-01 | 0.1517 |
| 27344 | PCSK1N | GSM4909304 | Human | Breast | IDC | 2.01e-29 | 5.57e-01 | 0.1636 |
| 27344 | PCSK1N | GSM4909315 | Human | Breast | IDC | 1.60e-07 | 2.46e-01 | 0.21 |
| 27344 | PCSK1N | GSM4909317 | Human | Breast | IDC | 7.17e-06 | 2.18e-01 | 0.1355 |
| 27344 | PCSK1N | GSM4909320 | Human | Breast | IDC | 1.37e-07 | 5.33e-01 | 0.1575 |
| 27344 | PCSK1N | CA_HPV_2 | Human | Cervix | CC | 1.68e-05 | 1.46e-01 | 0.0391 |
| 27344 | PCSK1N | sample1 | Human | Cervix | CC | 5.58e-14 | 6.37e-01 | 0.0959 |
| 27344 | PCSK1N | T1 | Human | Cervix | CC | 4.83e-22 | 5.65e-01 | 0.0918 |
| 27344 | PCSK1N | LZE4T | Human | Esophagus | ESCC | 1.43e-02 | 2.00e-01 | 0.0811 |
| 27344 | PCSK1N | P2T-E | Human | Esophagus | ESCC | 2.03e-09 | 2.56e-01 | 0.1177 |
| 27344 | PCSK1N | P5T-E | Human | Esophagus | ESCC | 2.02e-06 | 1.47e-01 | 0.1327 |
| 27344 | PCSK1N | P8T-E | Human | Esophagus | ESCC | 9.74e-22 | 6.20e-01 | 0.0889 |
| 27344 | PCSK1N | P10T-E | Human | Esophagus | ESCC | 5.68e-24 | 3.73e-01 | 0.116 |
| 27344 | PCSK1N | P11T-E | Human | Esophagus | ESCC | 7.72e-26 | 1.51e+00 | 0.1426 |
| 27344 | PCSK1N | P12T-E | Human | Esophagus | ESCC | 1.62e-13 | 3.76e-01 | 0.1122 |
| 27344 | PCSK1N | P15T-E | Human | Esophagus | ESCC | 2.78e-42 | 1.24e+00 | 0.1149 |
| Page: 1 2 3 4 5 6 |
| Tissue | Expression Dynamics | Abbreviation |
| Breast | 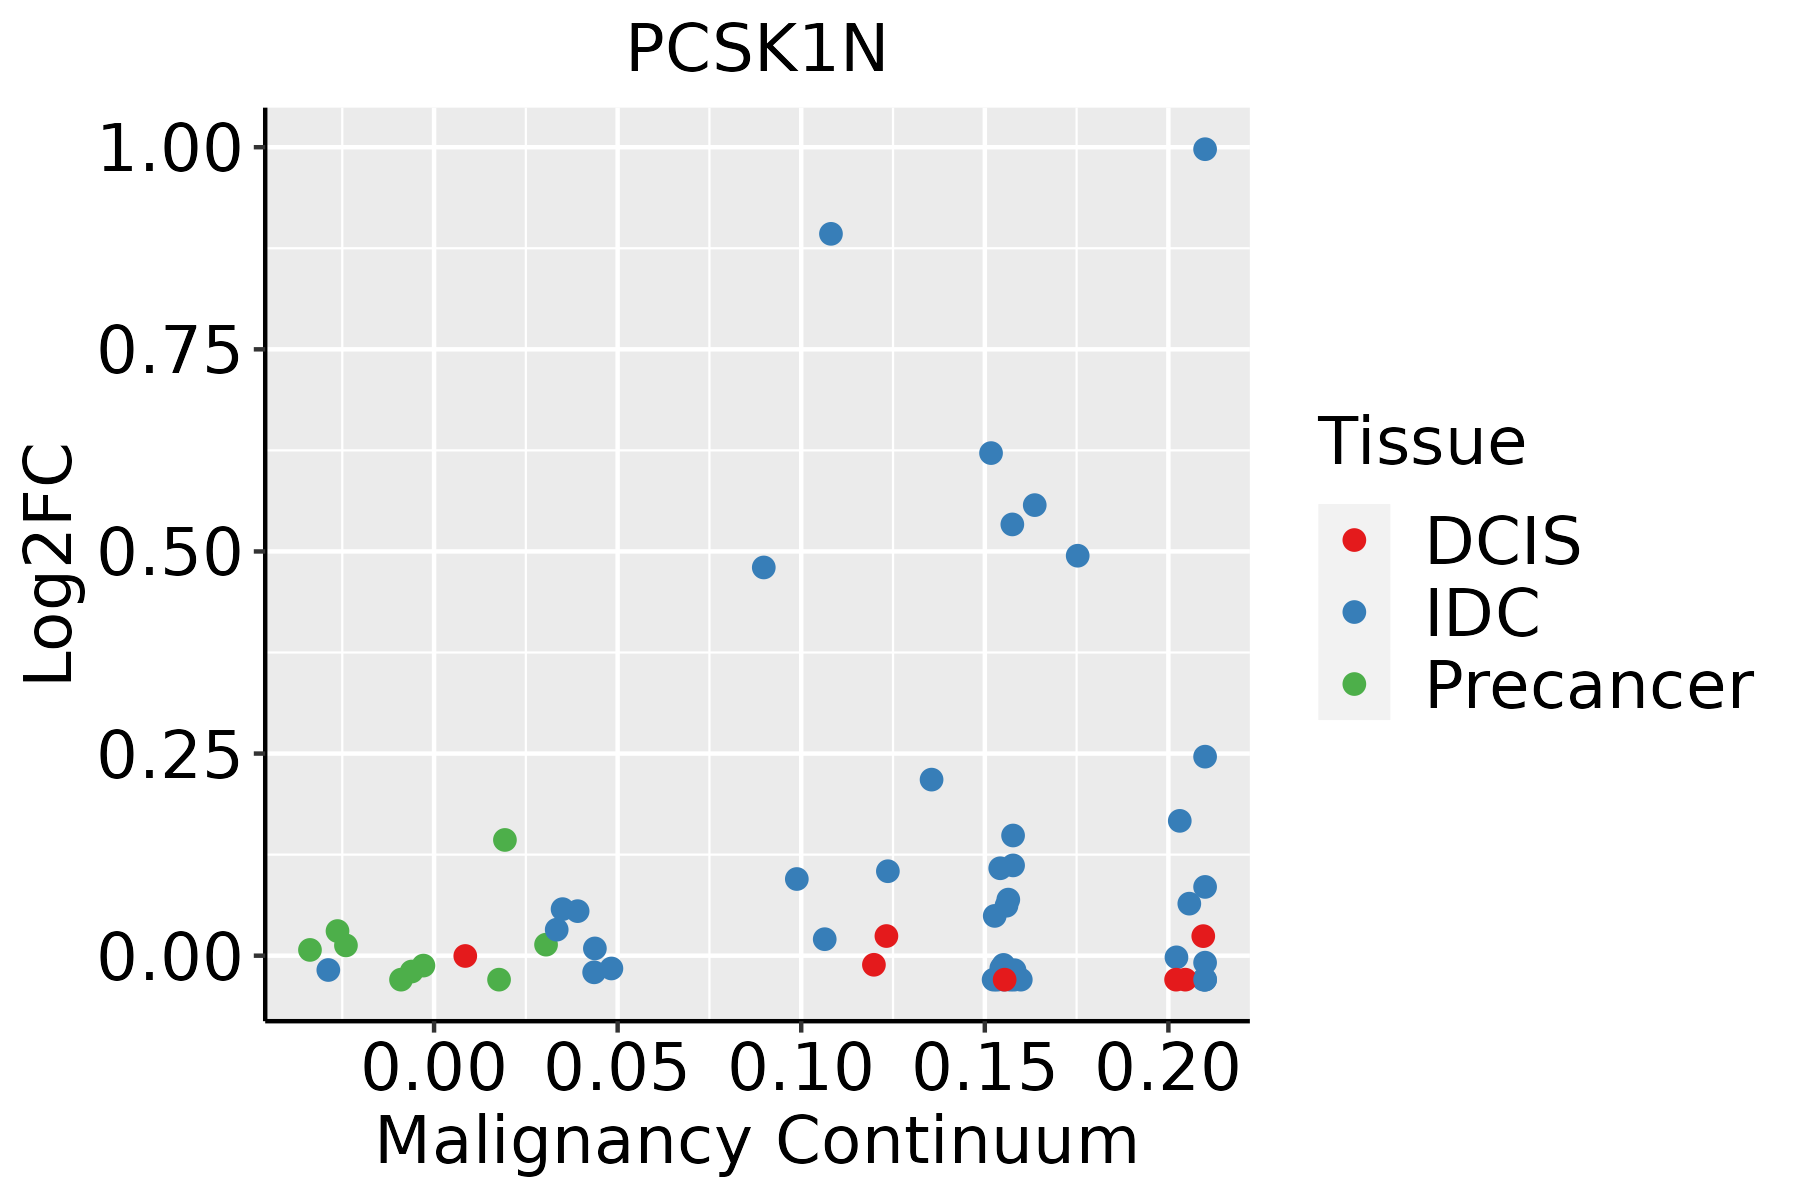 | IDC: Invasive ductal carcinoma |
| DCIS: Ductal carcinoma in situ | ||
| Precancer(BRCA1-mut): Precancerous lesion from BRCA1 mutation carriers | ||
| Cervix | 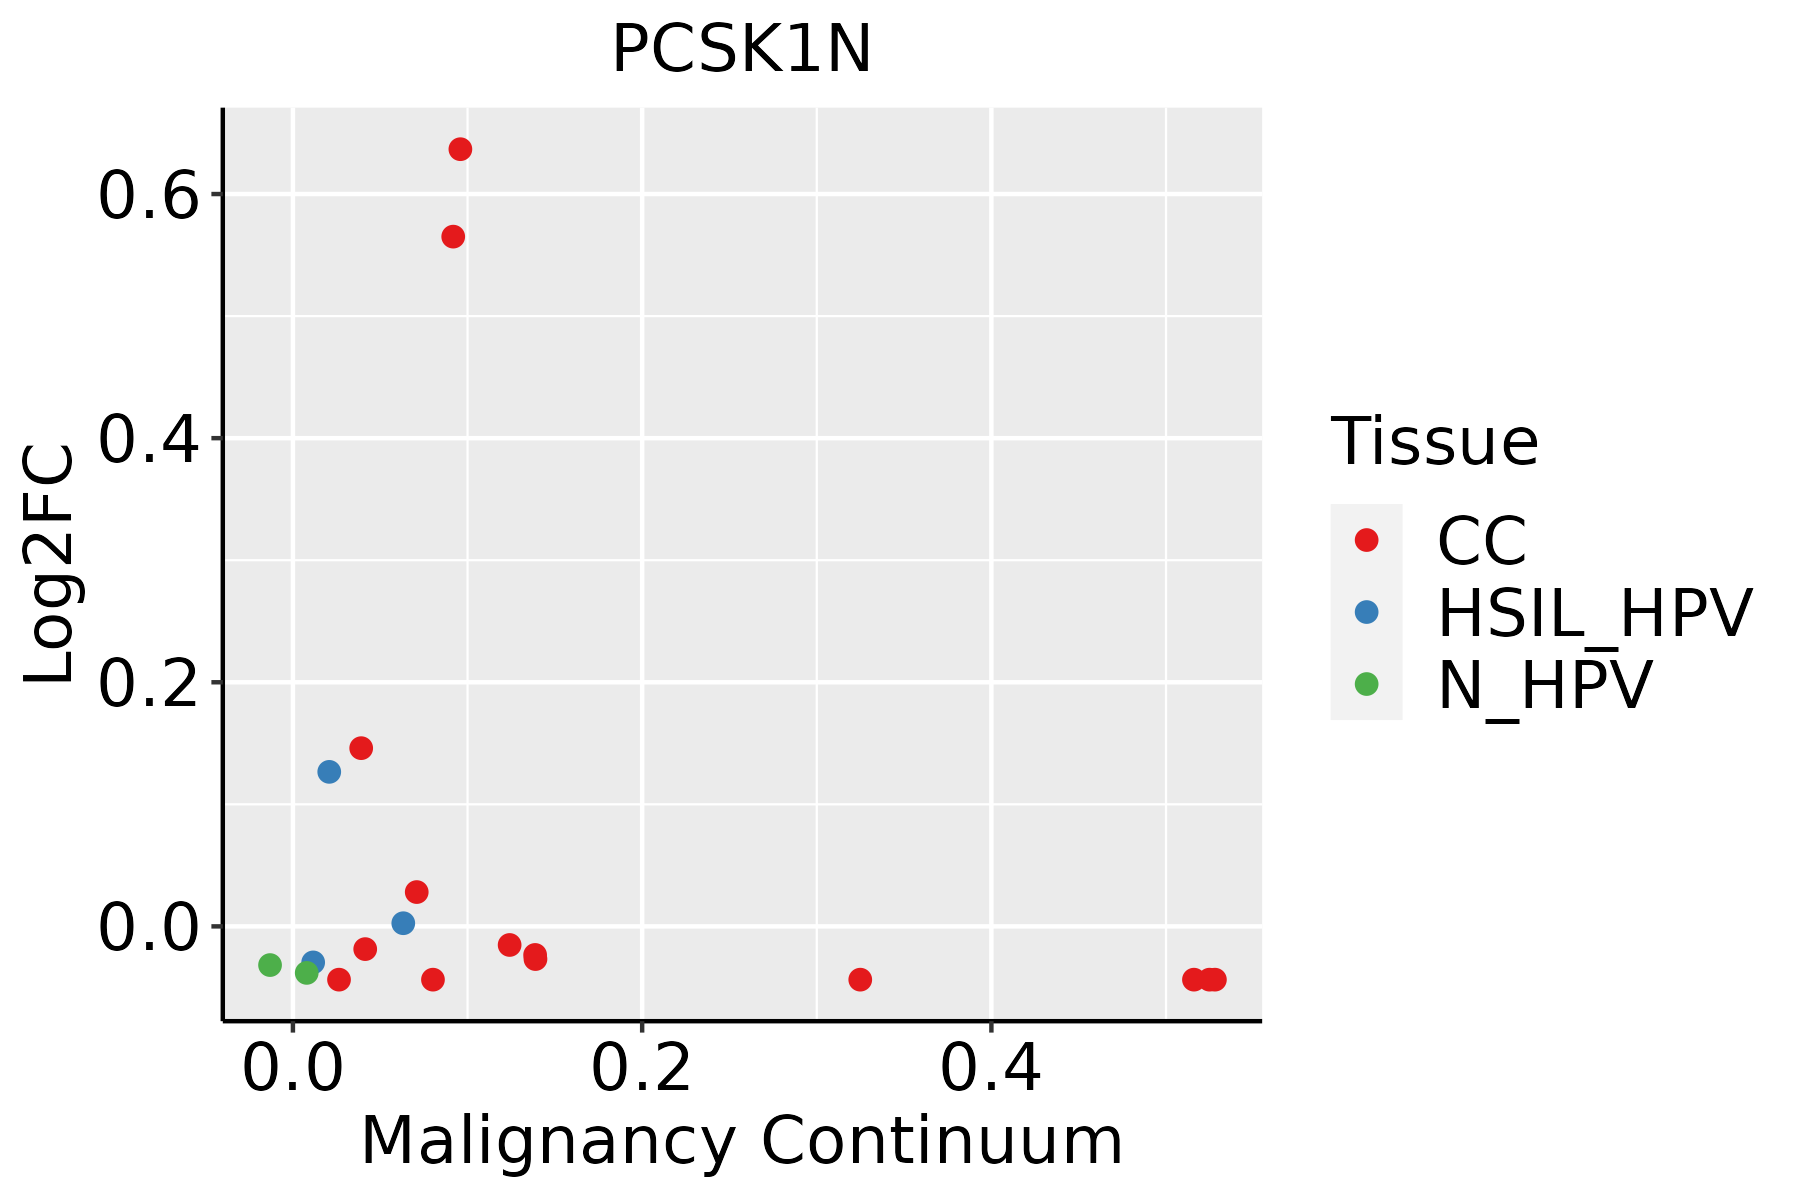 | CC: Cervix cancer |
| HSIL_HPV: HPV-infected high-grade squamous intraepithelial lesions | ||
| N_HPV: HPV-infected normal cervix | ||
| Esophagus |  | ESCC: Esophageal squamous cell carcinoma |
| HGIN: High-grade intraepithelial neoplasias | ||
| LGIN: Low-grade intraepithelial neoplasias | ||
| Liver |  | HCC: Hepatocellular carcinoma |
| NAFLD: Non-alcoholic fatty liver disease | ||
| Lung | 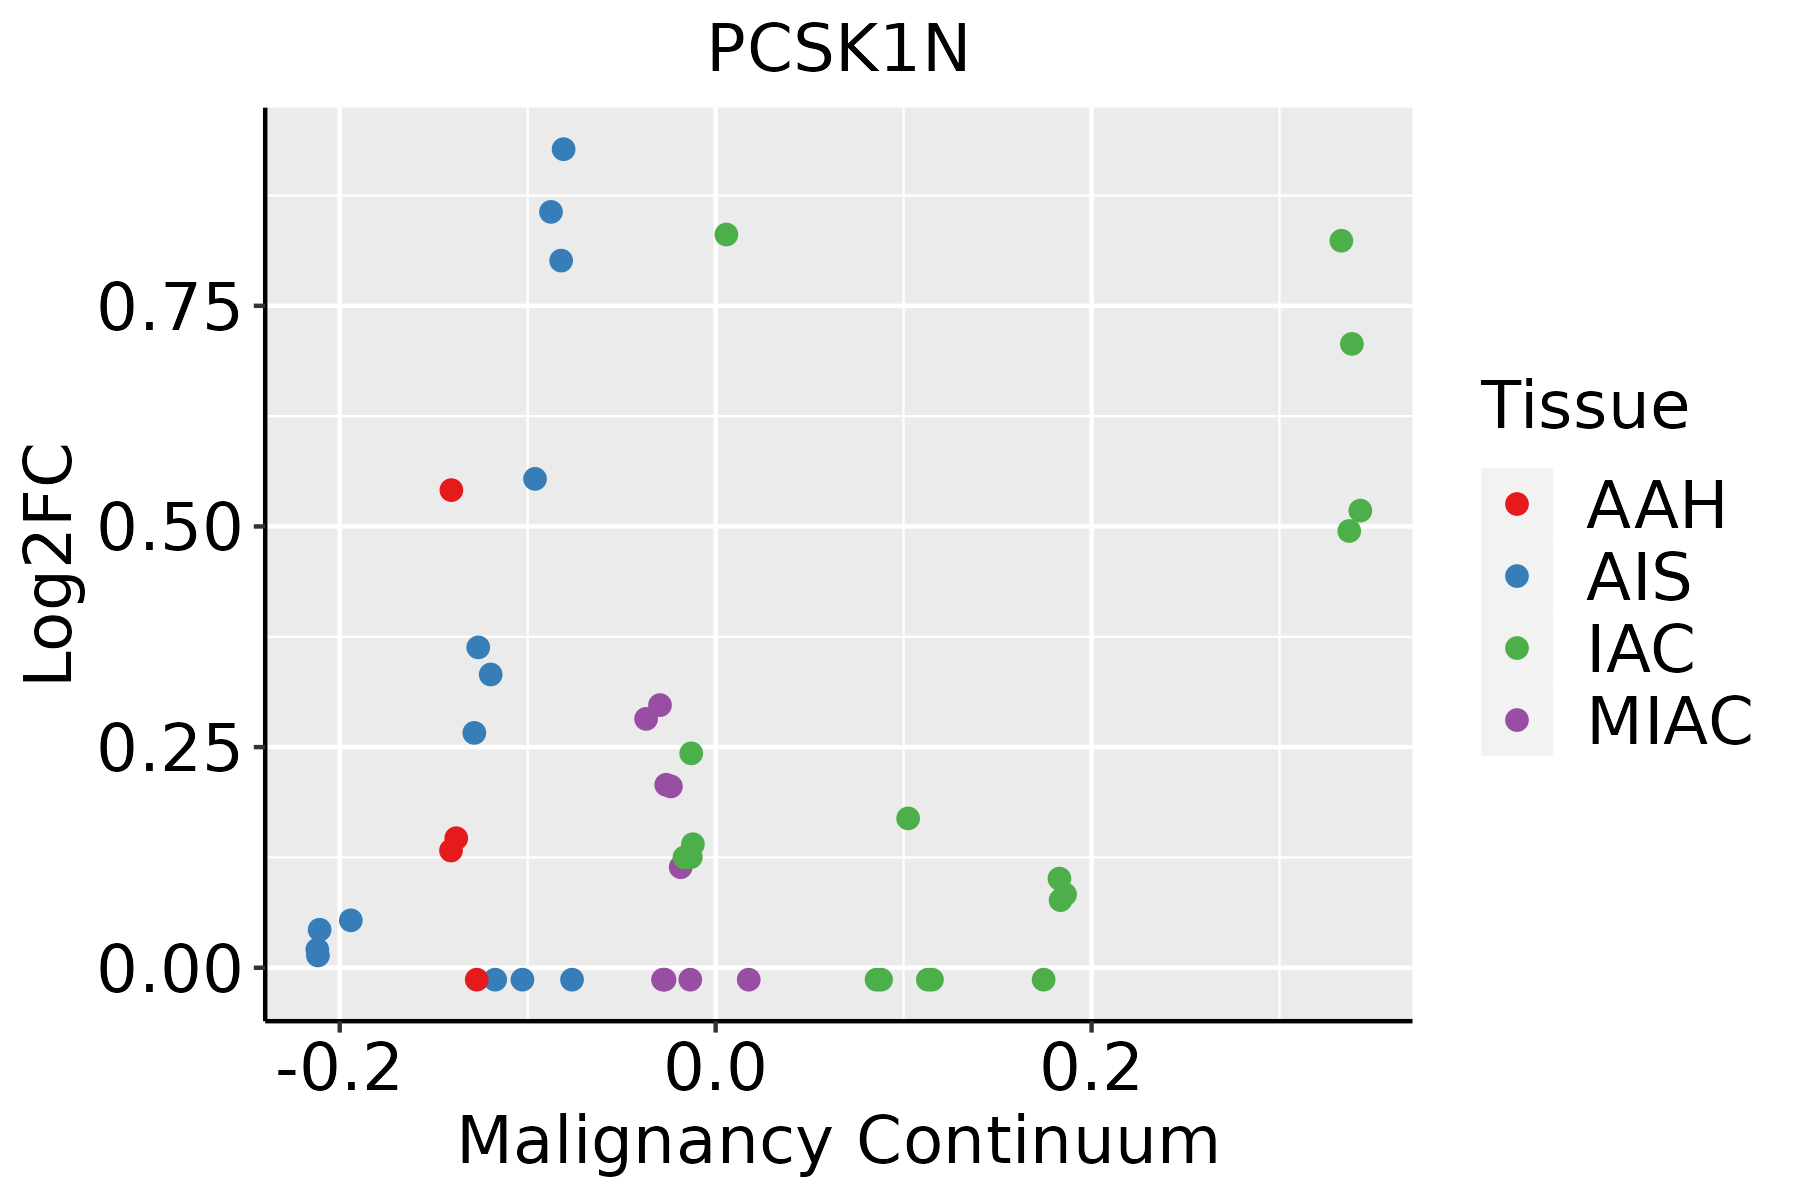 | AAH: Atypical adenomatous hyperplasia |
| AIS: Adenocarcinoma in situ | ||
| IAC: Invasive lung adenocarcinoma | ||
| MIA: Minimally invasive adenocarcinoma | ||
| Oral Cavity | 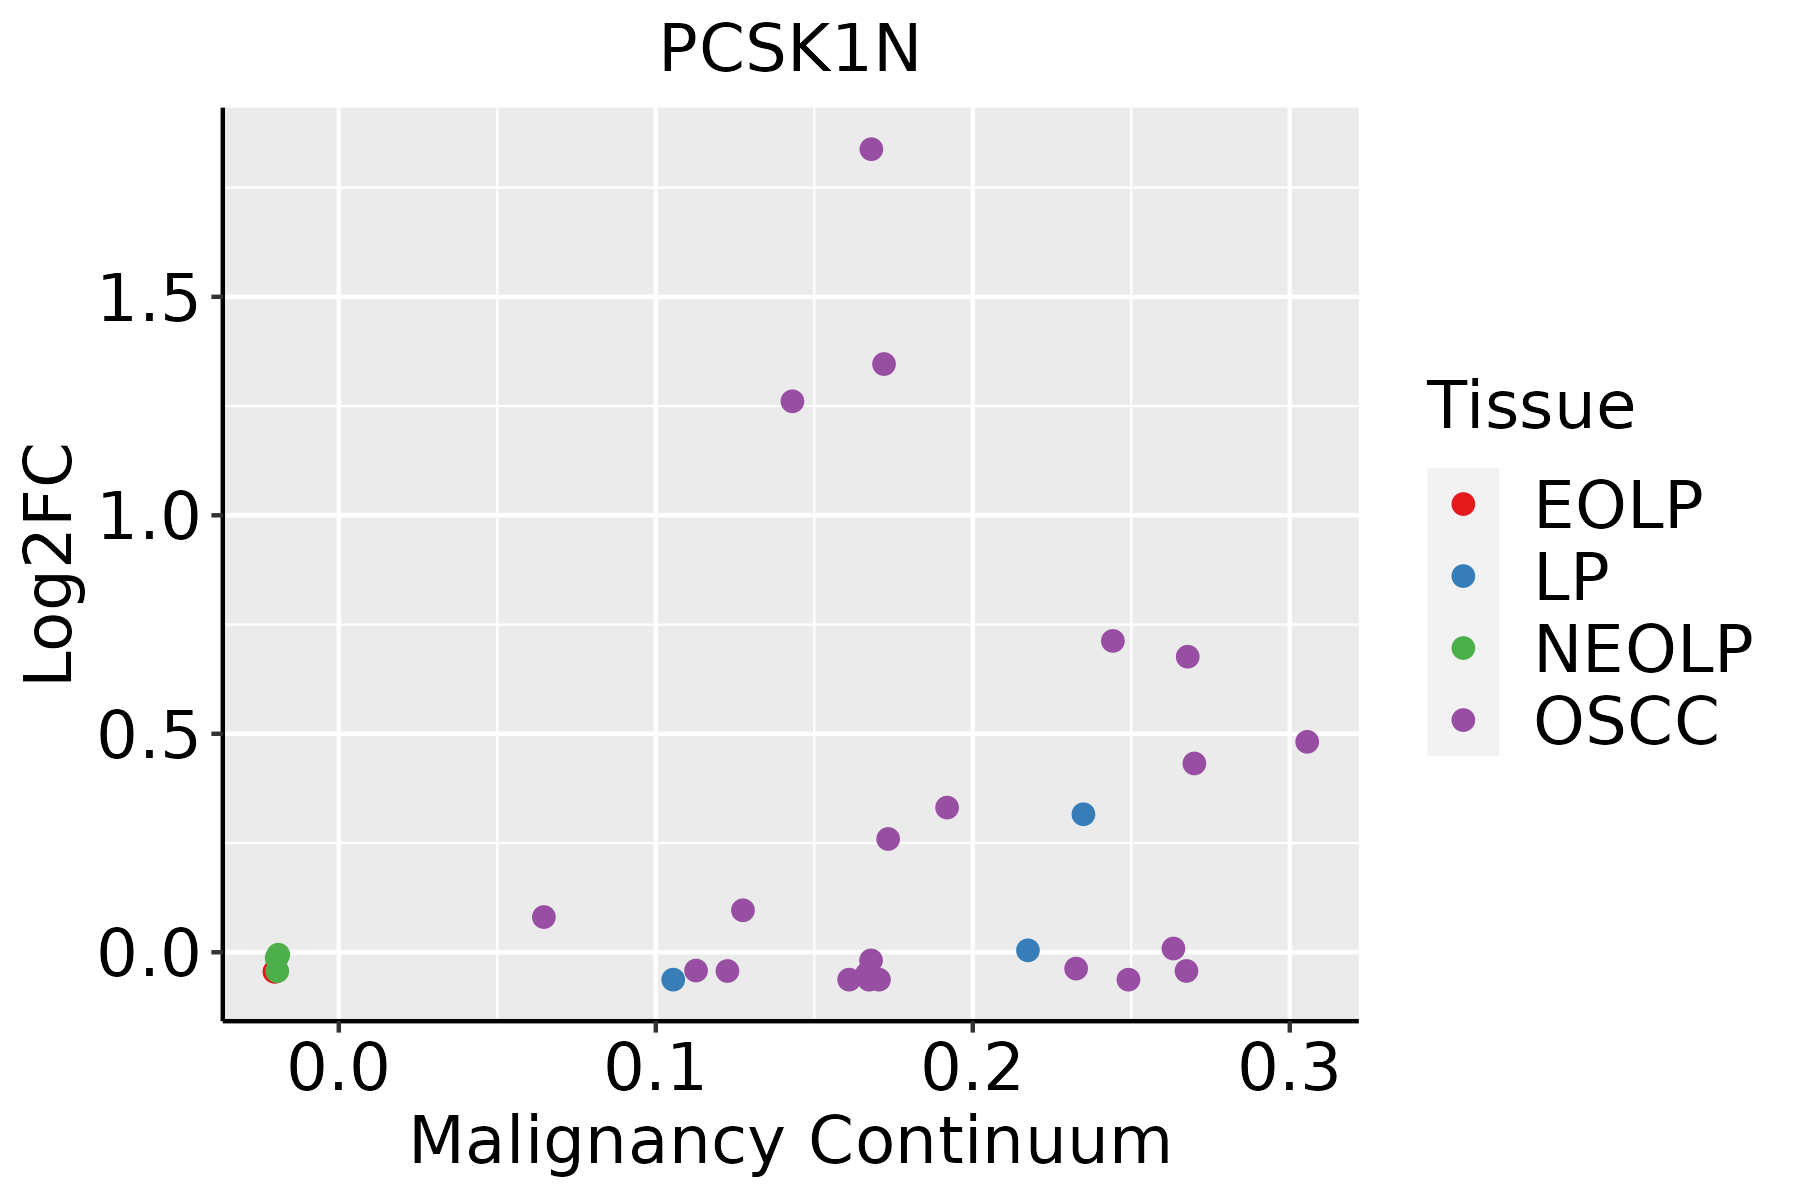 | EOLP: Erosive Oral lichen planus |
| LP: leukoplakia | ||
| NEOLP: Non-erosive oral lichen planus | ||
| OSCC: Oral squamous cell carcinoma | ||
| Prostate | 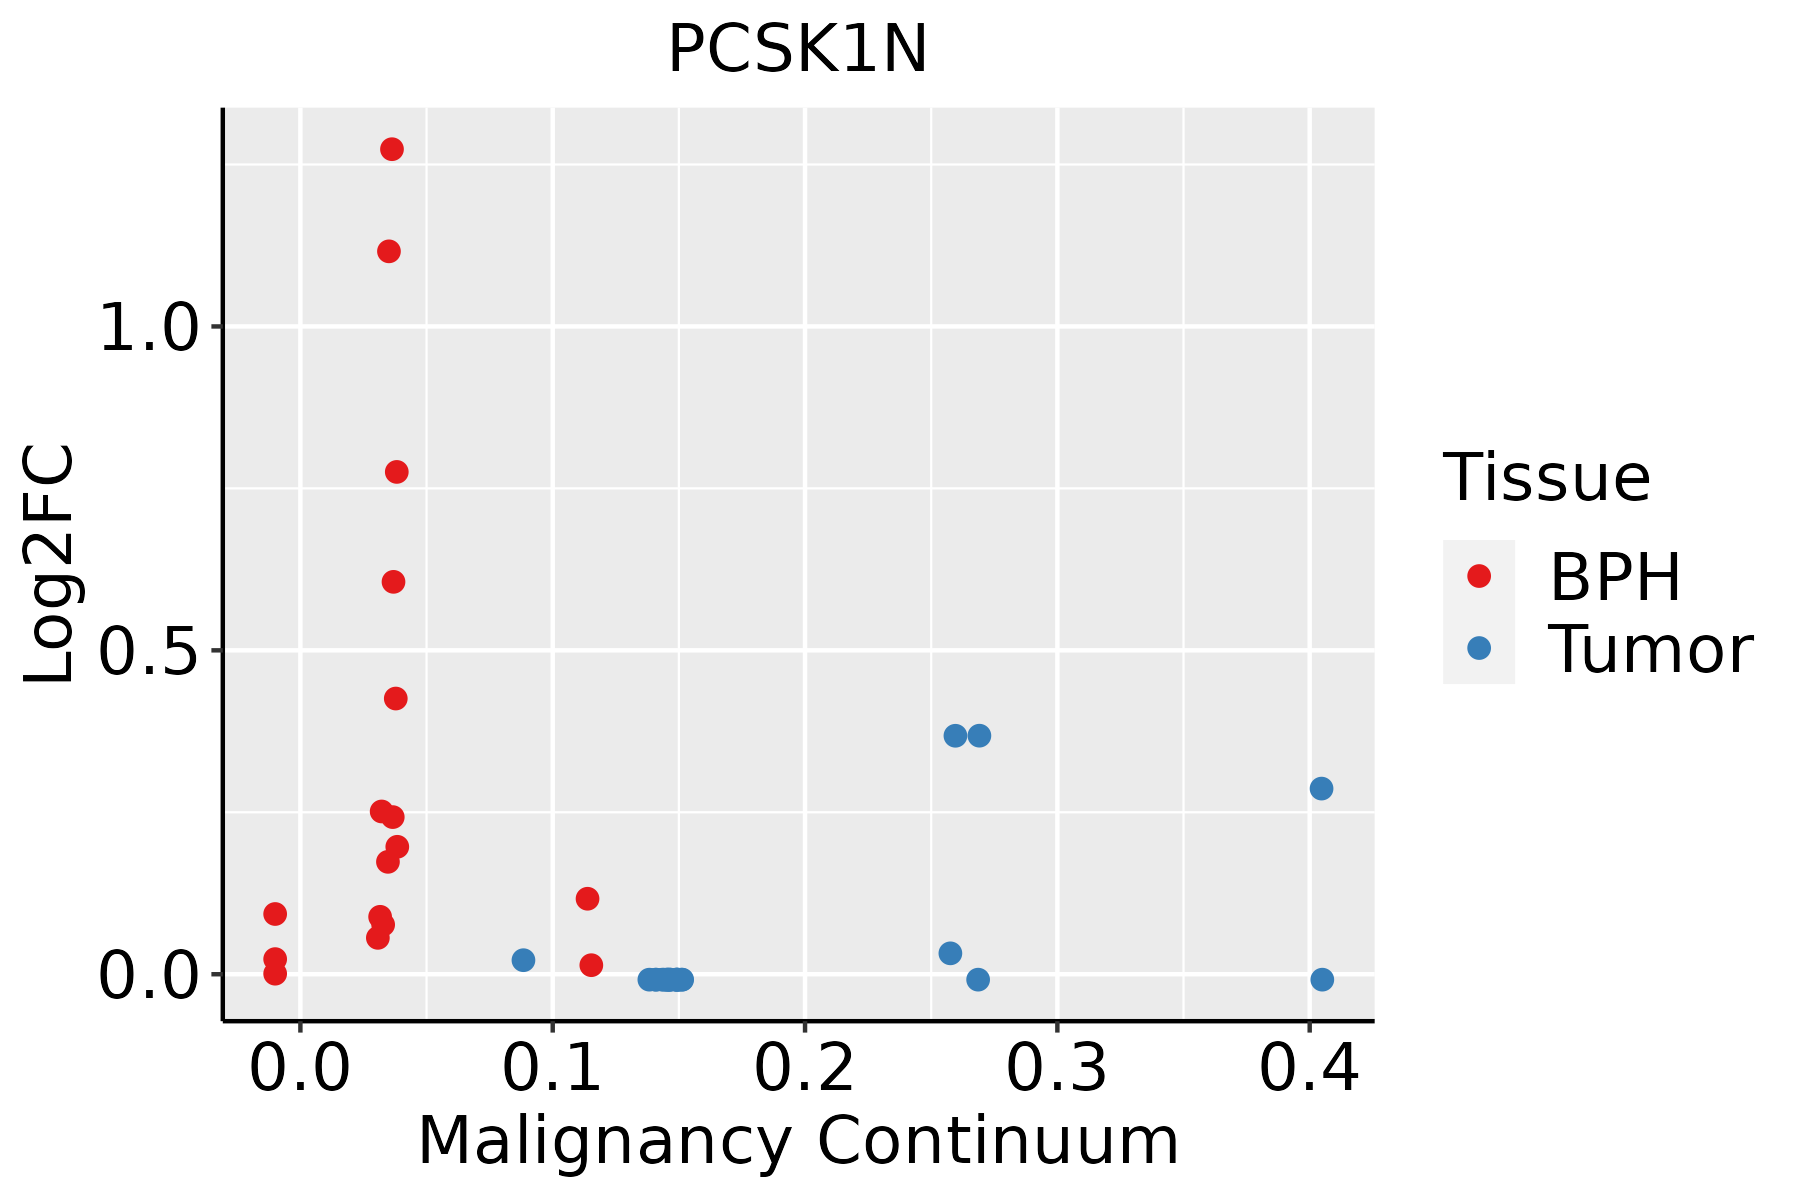 | BPH: Benign Prostatic Hyperplasia |
| Thyroid | 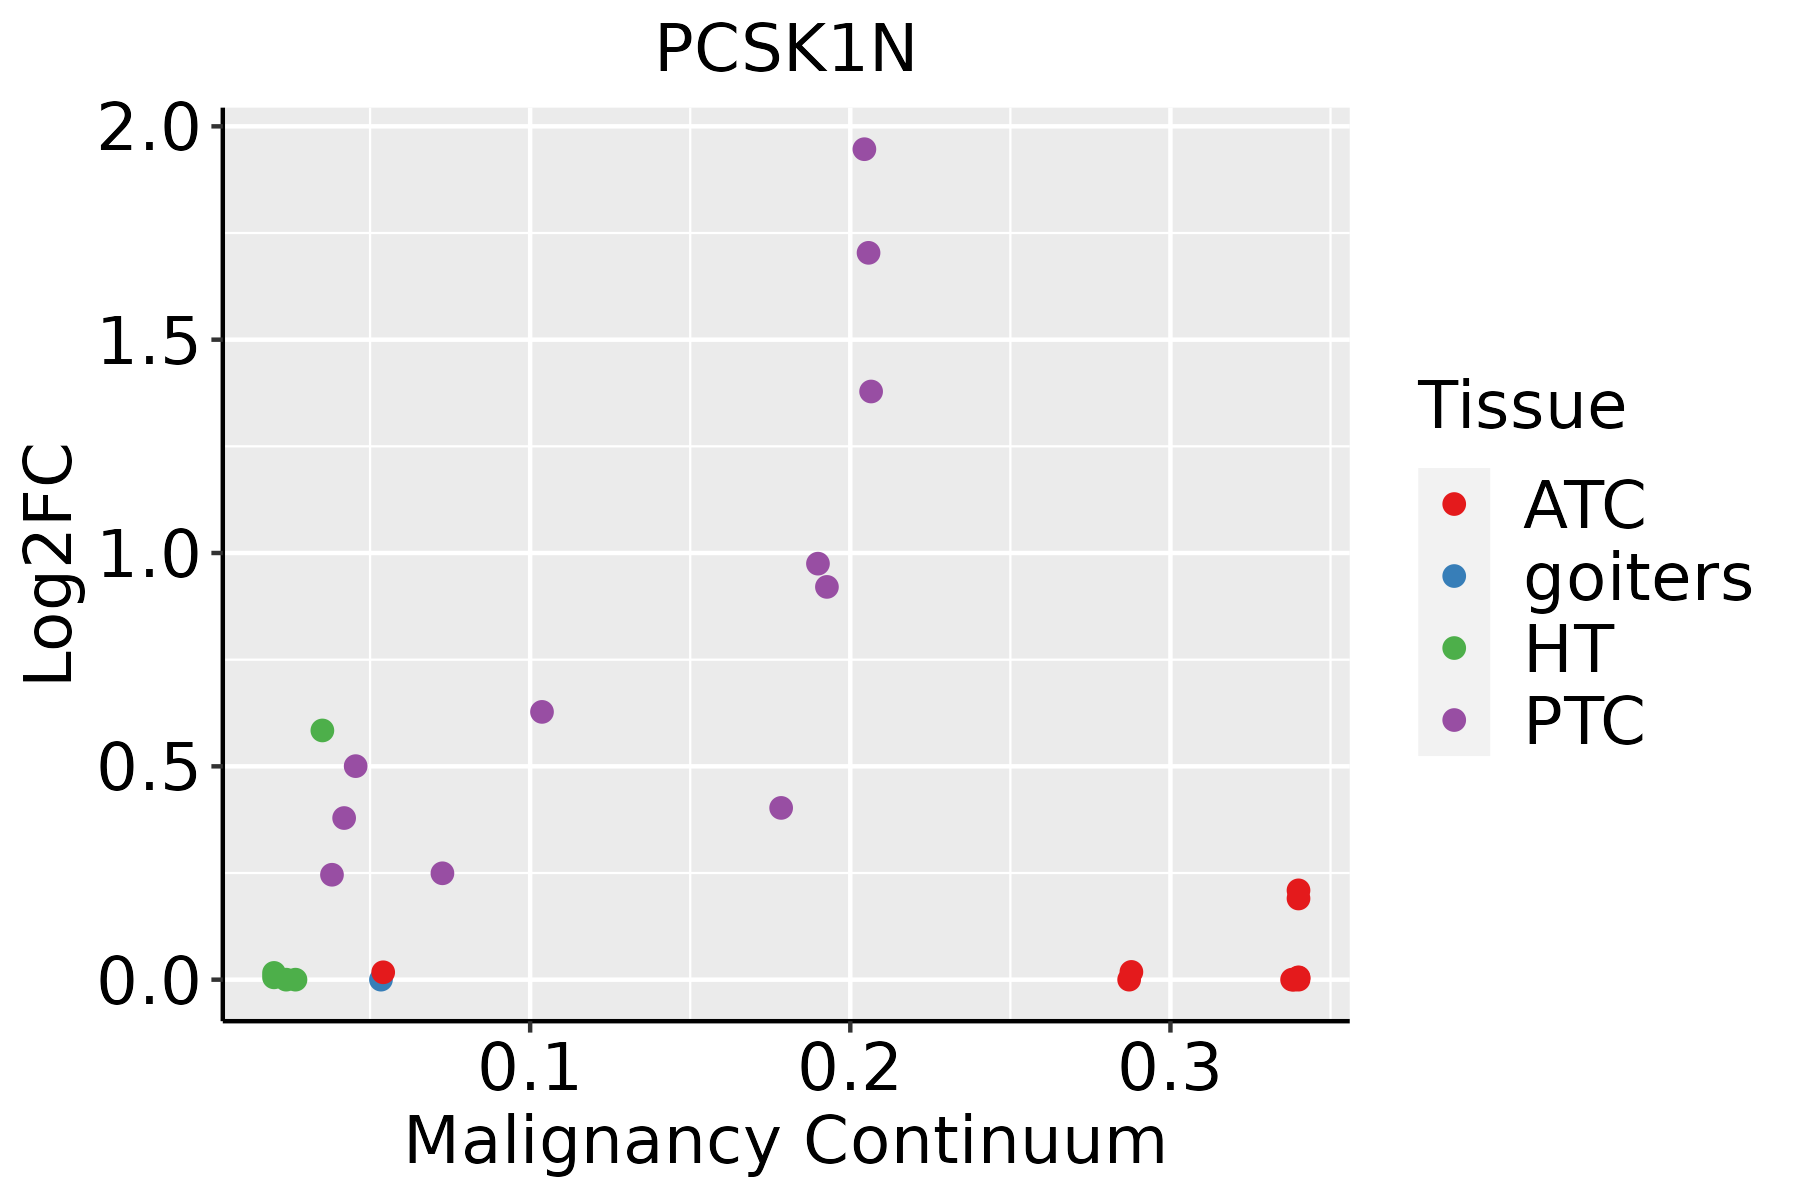 | ATC: Anaplastic thyroid cancer |
| HT: Hashimoto's thyroiditis | ||
| PTC: Papillary thyroid cancer |
| ∗log2FC in expression of this searched gene in stem-like cells from each diseased tissue sample relative to stem-like cells in normal samples in each tissue plotted against the malignancy continuum. Samples are colored based on if they are from different disease stage. |
Top |
Malignant transformation related pathway analysis |
| Find out the enriched GO biological processes and KEGG pathways involved in transition from healthy to precancer to cancer |
| Tissue | Disease Stage | Enriched GO biological Processes |
| Colorectum | AD |  |
| Colorectum | SER |  |
| Colorectum | MSS |  |
| Colorectum | MSI-H |  |
| Colorectum | FAP |  |
| ∗Top 15 enriched GO BP terms are showed in the bar plot of each disease state in each tissue. Each row represents a significant GO biological process which is colored according to the -log10(p.adjust). |
| Page: 1 2 3 4 5 6 7 8 9 |
| GO ID | Tissue | Disease Stage | Description | Gene Ratio | Bg Ratio | pvalue | p.adjust | Count |
| GO:005254720 | Oral cavity | OSCC | regulation of peptidase activity | 255/7305 | 461/18723 | 5.78e-13 | 2.75e-11 | 255 |
| GO:005160410 | Oral cavity | OSCC | protein maturation | 170/7305 | 294/18723 | 3.97e-11 | 1.28e-09 | 170 |
| GO:005254820 | Oral cavity | OSCC | regulation of endopeptidase activity | 235/7305 | 432/18723 | 4.35e-11 | 1.40e-09 | 235 |
| GO:003166720 | Oral cavity | OSCC | response to nutrient levels | 245/7305 | 474/18723 | 1.02e-08 | 2.10e-07 | 245 |
| GO:004586120 | Oral cavity | OSCC | negative regulation of proteolysis | 181/7305 | 351/18723 | 1.01e-06 | 1.37e-05 | 181 |
| GO:00164856 | Oral cavity | OSCC | protein processing | 121/7305 | 225/18723 | 4.56e-06 | 5.23e-05 | 121 |
| GO:000926616 | Oral cavity | OSCC | response to temperature stimulus | 98/7305 | 178/18723 | 9.78e-06 | 1.03e-04 | 98 |
| GO:005134618 | Oral cavity | OSCC | negative regulation of hydrolase activity | 182/7305 | 379/18723 | 1.98e-04 | 1.32e-03 | 182 |
| GO:001095117 | Oral cavity | OSCC | negative regulation of endopeptidase activity | 126/7305 | 252/18723 | 2.37e-04 | 1.54e-03 | 126 |
| GO:001046618 | Oral cavity | OSCC | negative regulation of peptidase activity | 130/7305 | 262/18723 | 2.89e-04 | 1.82e-03 | 130 |
| GO:005254718 | Prostate | BPH | regulation of peptidase activity | 133/3107 | 461/18723 | 2.08e-11 | 1.43e-09 | 133 |
| GO:005254818 | Prostate | BPH | regulation of endopeptidase activity | 122/3107 | 432/18723 | 6.10e-10 | 2.91e-08 | 122 |
| GO:004586118 | Prostate | BPH | negative regulation of proteolysis | 98/3107 | 351/18723 | 5.43e-08 | 1.49e-06 | 98 |
| GO:003166718 | Prostate | BPH | response to nutrient levels | 121/3107 | 474/18723 | 3.68e-07 | 7.70e-06 | 121 |
| GO:000926610 | Prostate | BPH | response to temperature stimulus | 56/3107 | 178/18723 | 6.74e-07 | 1.30e-05 | 56 |
| GO:00516049 | Prostate | BPH | protein maturation | 80/3107 | 294/18723 | 2.64e-06 | 4.23e-05 | 80 |
| GO:00164855 | Prostate | BPH | protein processing | 62/3107 | 225/18723 | 2.22e-05 | 2.67e-04 | 62 |
| GO:005134616 | Prostate | BPH | negative regulation of hydrolase activity | 94/3107 | 379/18723 | 2.46e-05 | 2.94e-04 | 94 |
| GO:001095115 | Prostate | BPH | negative regulation of endopeptidase activity | 66/3107 | 252/18723 | 6.87e-05 | 6.78e-04 | 66 |
| GO:001046616 | Prostate | BPH | negative regulation of peptidase activity | 68/3107 | 262/18723 | 7.28e-05 | 7.13e-04 | 68 |
| Page: 1 2 3 4 5 6 |
| Pathway ID | Tissue | Disease Stage | Description | Gene Ratio | Bg Ratio | pvalue | p.adjust | qvalue | Count |
| Page: 1 |
Top |
Cell-cell communication analysis |
| Identification of potential cell-cell interactions between two cell types and their ligand-receptor pairs for different disease states |
| Ligand | Receptor | LRpair | Pathway | Tissue | Disease Stage |
| Page: 1 |
Top |
Single-cell gene regulatory network inference analysis |
| Find out the significant the regulons (TFs) and the target genes of each regulon across cell types for different disease states |
| TF | Cell Type | Tissue | Disease Stage | Target Gene | RSS | Regulon Activity |
| ∗The dot plots of a searched regulon are shown for all cell subpopulations in each disease state of each tissue based on the regulon specific score inferred using pySCENIC and by calculating the average expression. |
| Page: 1 |
Top |
Somatic mutation of malignant transformation related genes |
| Annotation of somatic variants for genes involved in malignant transformation |
| Hugo Symbol | Variant Class | Variant Classification | dbSNP RS | HGVSc | HGVSp | HGVSp Short | SWISSPROT | BIOTYPE | SIFT | PolyPhen | Tumor Sample Barcode | Tissue | Histology | Sex | Age | Stage | Therapy Types | Drugs | Outcome |
| PCSK1N | SNV | Missense_Mutation | c.643C>T | p.Pro215Ser | p.P215S | Q9UHG2 | protein_coding | deleterious_low_confidence(0.02) | benign(0.099) | TCGA-AX-A2HD-01 | Endometrium | uterine corpus endometrioid carcinoma | Female | >=65 | III/IV | Unknown | Unknown | SD | |
| PCSK1N | SNV | Missense_Mutation | novel | c.767N>A | p.Arg256His | p.R256H | Q9UHG2 | protein_coding | deleterious_low_confidence(0) | probably_damaging(0.958) | TCGA-DF-A2KU-01 | Endometrium | uterine corpus endometrioid carcinoma | Female | Unknown | I/II | Unknown | Unknown | SD |
| PCSK1N | SNV | Missense_Mutation | novel | c.767N>A | p.Arg256His | p.R256H | Q9UHG2 | protein_coding | deleterious_low_confidence(0) | probably_damaging(0.958) | TCGA-FI-A2D5-01 | Endometrium | uterine corpus endometrioid carcinoma | Female | <65 | III/IV | Chemotherapy | carboplatinum | PD |
| PCSK1N | SNV | Missense_Mutation | novel | c.152N>T | p.Ala51Val | p.A51V | Q9UHG2 | protein_coding | tolerated_low_confidence(0.12) | benign(0.003) | TCGA-55-1595-01 | Lung | lung adenocarcinoma | Female | >=65 | I/II | Unknown | Unknown | SD |
| PCSK1N | SNV | Missense_Mutation | novel | c.767G>A | p.Arg256His | p.R256H | Q9UHG2 | protein_coding | deleterious_low_confidence(0) | probably_damaging(0.958) | TCGA-HU-A4G8-01 | Stomach | stomach adenocarcinoma | Female | >=65 | I/II | Chemotherapy | 5-fluorouracil | SD |
| Page: 1 |
Top |
Related drugs of malignant transformation related genes |
| Identification of chemicals and drugs interact with genes involved in malignant transfromation |
| (DGIdb 4.0) |
| Entrez ID | Symbol | Category | Interaction Types | Drug Claim Name | Drug Name | PMIDs |
| Page: 1 |

Copyright 2023-Present -The University of Texas Health Science Center at Houston |