
|
|||||
|
 | |
| |
| |
| |
| |
| |
|
Gene: PAPSS2 |
Gene summary for PAPSS2 |
| Gene information | Species | Human | Gene symbol | PAPSS2 | Gene ID | 9060 |
| Gene name | 3'-phosphoadenosine 5'-phosphosulfate synthase 2 | |
| Gene Alias | ATPSK2 | |
| Cytomap | 10q23.2-q23.31 | |
| Gene Type | protein-coding | GO ID | GO:0000103 | UniProtAcc | O95340 |
Top |
Malignant transformation analysis |
| Identification of the aberrant gene expression in precancerous and cancerous lesions by comparing the gene expression of stem-like cells in diseased tissues with normal stem cells |
| Entrez ID | Symbol | Replicates | Species | Organ | Tissue | Adj P-value | Log2FC | Malignancy |
| 9060 | PAPSS2 | HTA11_3410_2000001011 | Human | Colorectum | AD | 9.25e-20 | -6.18e-01 | 0.0155 |
| 9060 | PAPSS2 | HTA11_2951_2000001011 | Human | Colorectum | AD | 1.46e-03 | -6.82e-01 | 0.0216 |
| 9060 | PAPSS2 | HTA11_78_2000001011 | Human | Colorectum | AD | 1.40e-05 | 7.76e-01 | -0.1088 |
| 9060 | PAPSS2 | HTA11_347_2000001011 | Human | Colorectum | AD | 1.90e-38 | 1.41e+00 | -0.1954 |
| 9060 | PAPSS2 | HTA11_411_2000001011 | Human | Colorectum | SER | 2.04e-07 | 9.70e-01 | -0.2602 |
| 9060 | PAPSS2 | HTA11_83_2000001011 | Human | Colorectum | SER | 1.37e-04 | 6.98e-01 | -0.1526 |
| 9060 | PAPSS2 | HTA11_866_3004761011 | Human | Colorectum | AD | 5.51e-04 | -4.85e-01 | 0.096 |
| 9060 | PAPSS2 | HTA11_6801_2000001011 | Human | Colorectum | SER | 3.30e-02 | 7.00e-01 | 0.0171 |
| 9060 | PAPSS2 | HTA11_10711_2000001011 | Human | Colorectum | AD | 8.05e-07 | -5.79e-01 | 0.0338 |
| 9060 | PAPSS2 | HTA11_7696_3000711011 | Human | Colorectum | AD | 5.92e-16 | -5.99e-01 | 0.0674 |
| 9060 | PAPSS2 | HTA11_6818_2000001011 | Human | Colorectum | AD | 1.72e-02 | -6.07e-01 | 0.0112 |
| 9060 | PAPSS2 | HTA11_99999965104_69814 | Human | Colorectum | MSS | 1.33e-02 | -4.96e-01 | 0.281 |
| 9060 | PAPSS2 | HTA11_99999973899_84307 | Human | Colorectum | MSS | 3.31e-11 | -8.38e-01 | 0.2585 |
| 9060 | PAPSS2 | HTA11_99999974143_84620 | Human | Colorectum | MSS | 7.41e-31 | -7.80e-01 | 0.3005 |
| 9060 | PAPSS2 | F007 | Human | Colorectum | FAP | 7.11e-16 | -8.11e-01 | 0.1176 |
| 9060 | PAPSS2 | A002-C-010 | Human | Colorectum | FAP | 1.99e-09 | -4.37e-01 | 0.242 |
| 9060 | PAPSS2 | A001-C-207 | Human | Colorectum | FAP | 3.78e-04 | -3.32e-01 | 0.1278 |
| 9060 | PAPSS2 | A015-C-203 | Human | Colorectum | FAP | 2.40e-31 | -7.00e-01 | -0.1294 |
| 9060 | PAPSS2 | A015-C-204 | Human | Colorectum | FAP | 1.09e-02 | -2.60e-01 | -0.0228 |
| 9060 | PAPSS2 | A014-C-040 | Human | Colorectum | FAP | 5.17e-11 | -8.80e-01 | -0.1184 |
| Page: 1 2 3 4 5 |
| Tissue | Expression Dynamics | Abbreviation |
| Colorectum (GSE201348) | 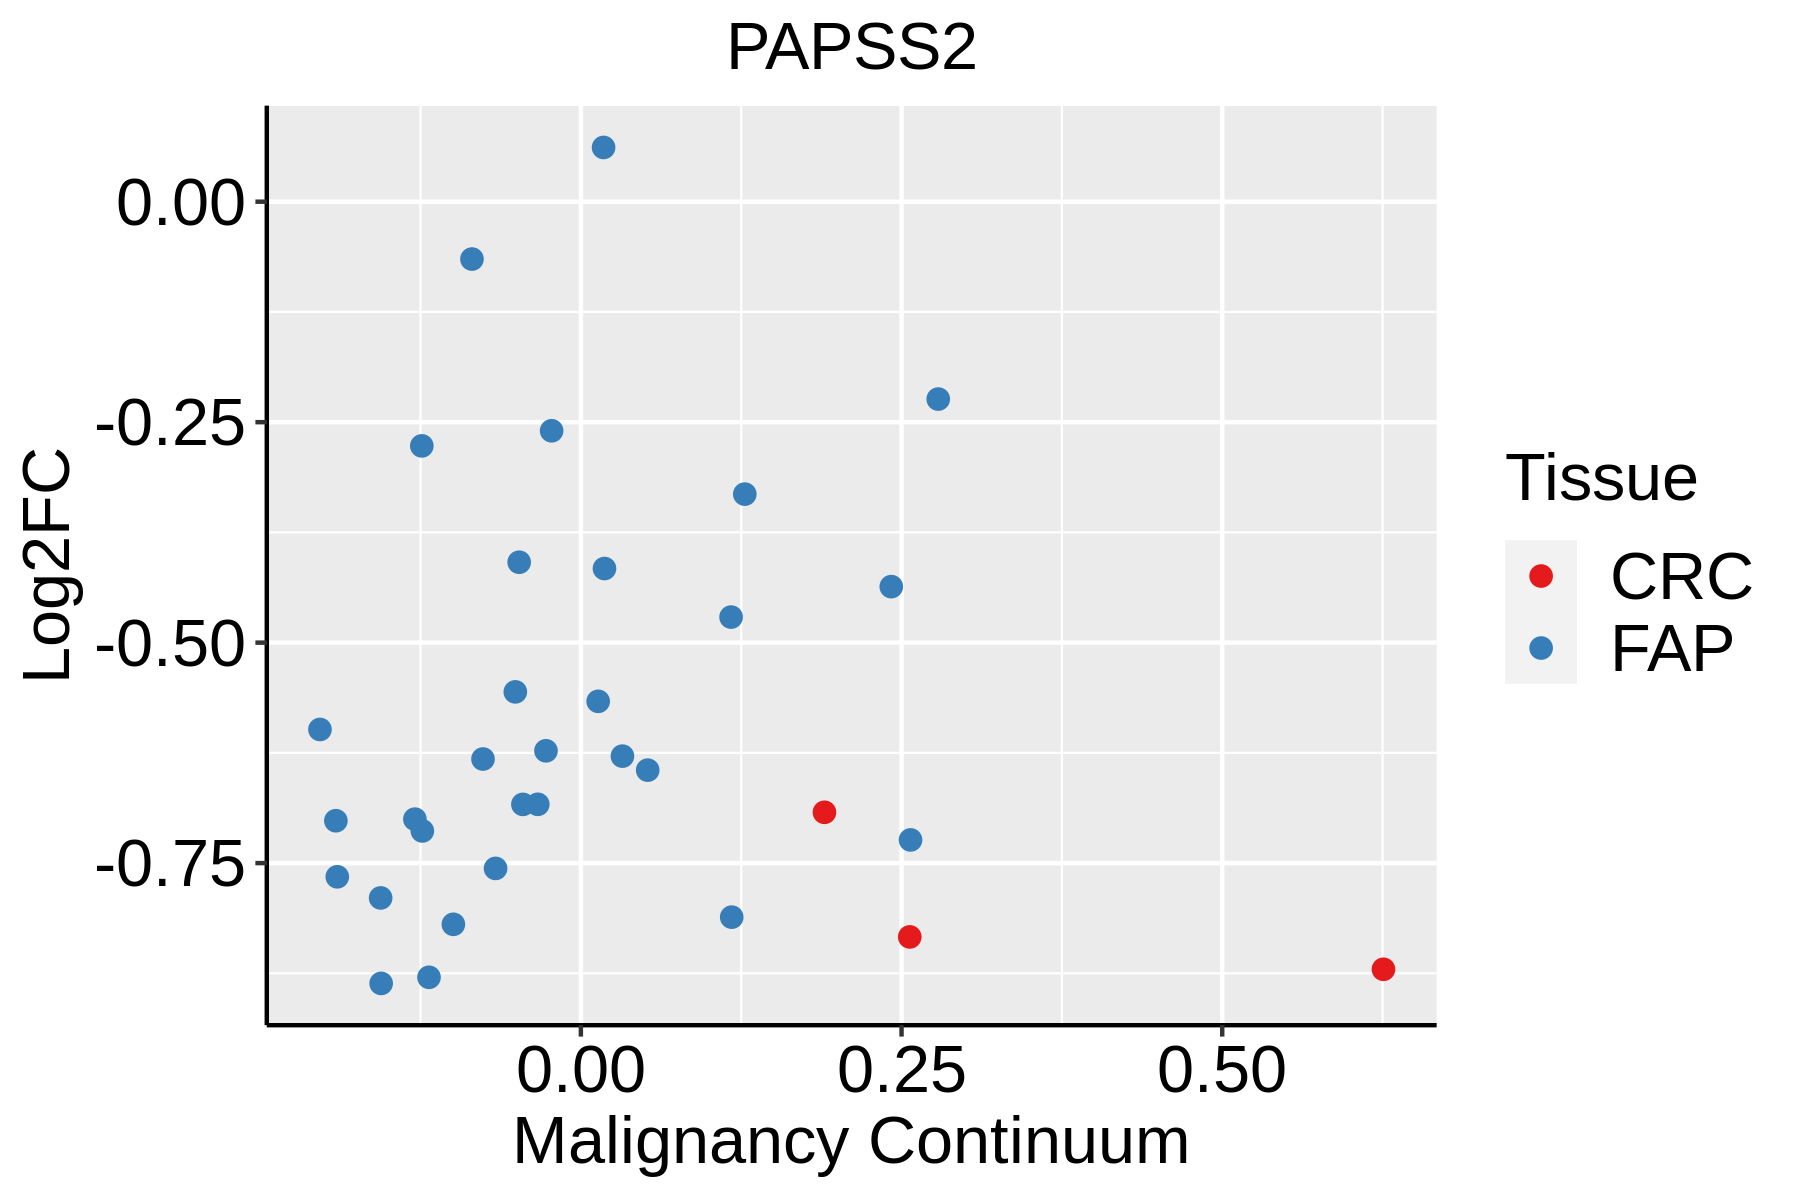 | FAP: Familial adenomatous polyposis |
| CRC: Colorectal cancer | ||
| Colorectum (HTA11) |  | AD: Adenomas |
| SER: Sessile serrated lesions | ||
| MSI-H: Microsatellite-high colorectal cancer | ||
| MSS: Microsatellite stable colorectal cancer | ||
| Esophagus |  | ESCC: Esophageal squamous cell carcinoma |
| HGIN: High-grade intraepithelial neoplasias | ||
| LGIN: Low-grade intraepithelial neoplasias | ||
| Liver |  | HCC: Hepatocellular carcinoma |
| NAFLD: Non-alcoholic fatty liver disease | ||
| Lung | 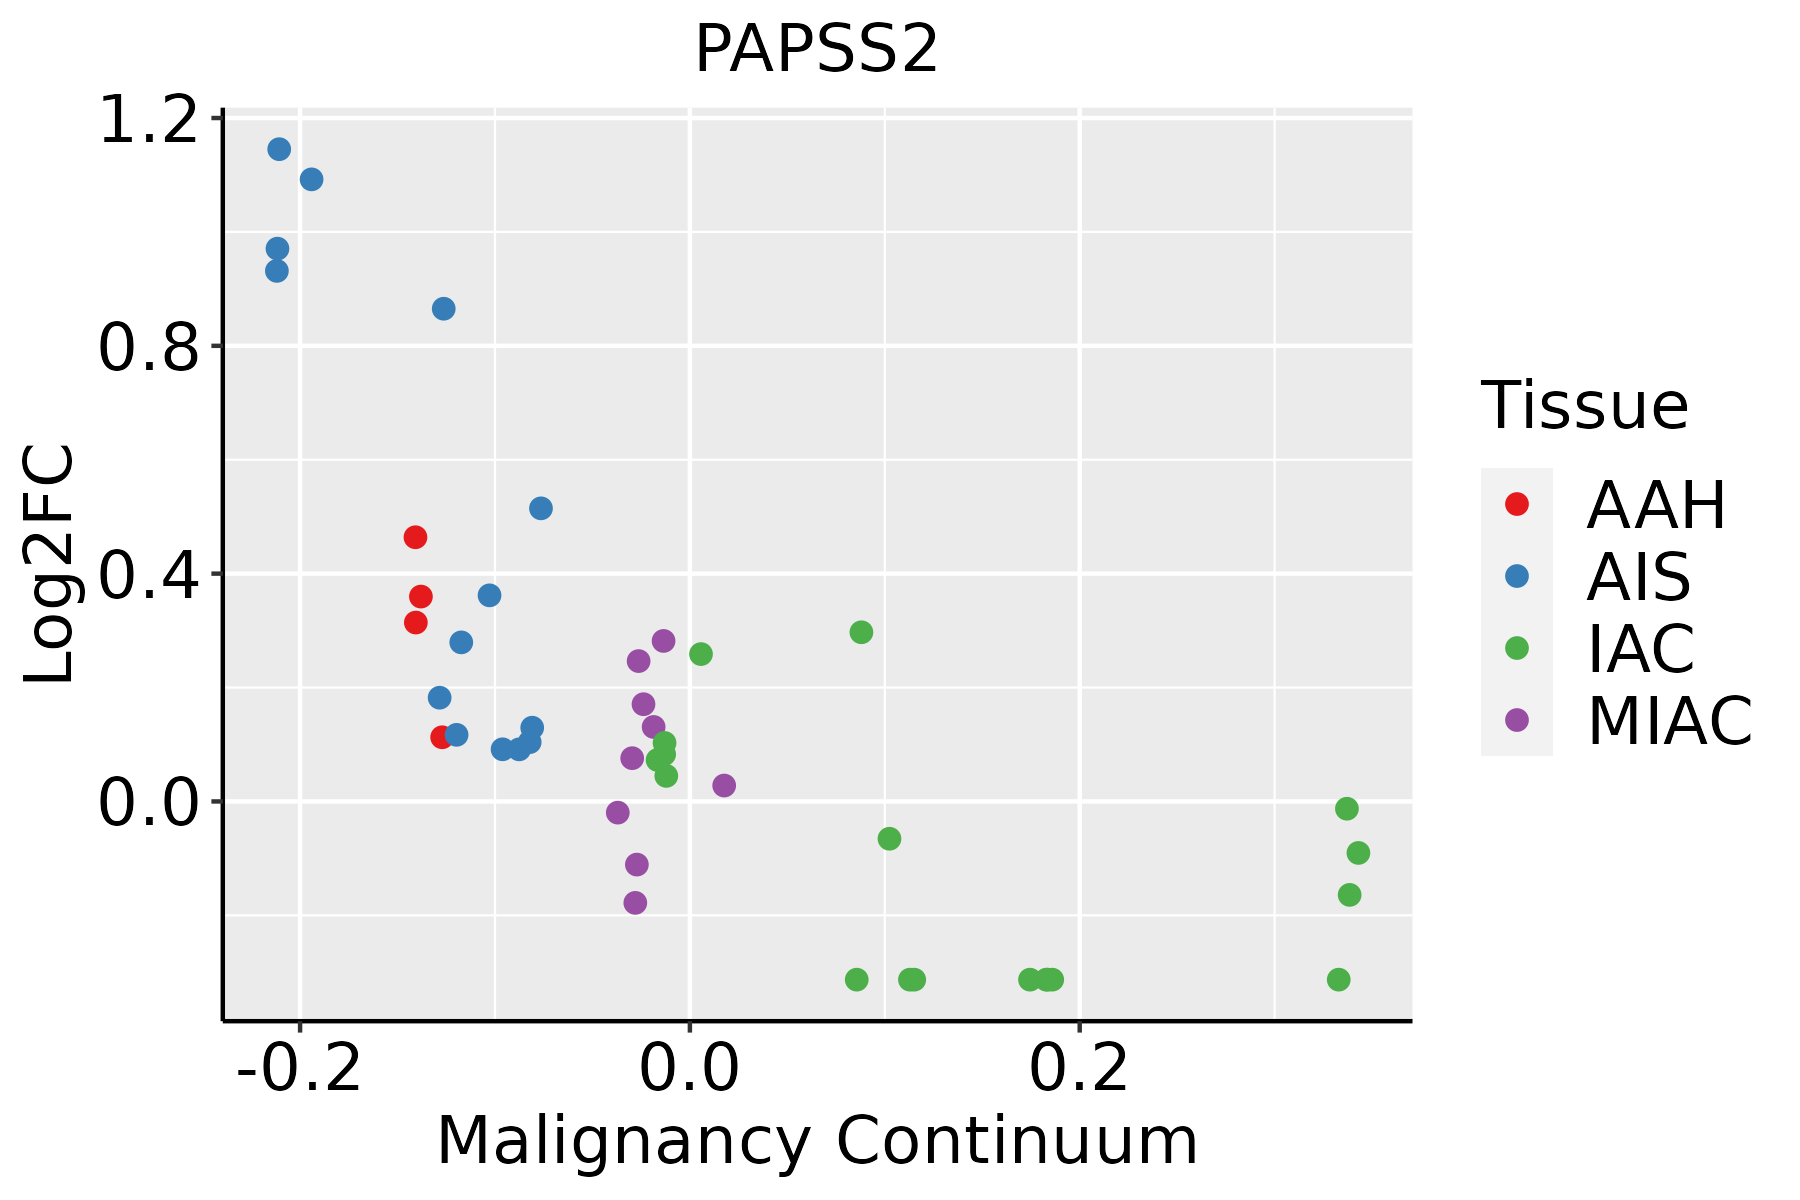 | AAH: Atypical adenomatous hyperplasia |
| AIS: Adenocarcinoma in situ | ||
| IAC: Invasive lung adenocarcinoma | ||
| MIA: Minimally invasive adenocarcinoma |
| ∗log2FC in expression of this searched gene in stem-like cells from each diseased tissue sample relative to stem-like cells in normal samples in each tissue plotted against the malignancy continuum. Samples are colored based on if they are from different disease stage. |
Top |
Malignant transformation related pathway analysis |
| Find out the enriched GO biological processes and KEGG pathways involved in transition from healthy to precancer to cancer |
| Tissue | Disease Stage | Enriched GO biological Processes |
| Colorectum | AD |  |
| Colorectum | SER |  |
| Colorectum | MSS |  |
| Colorectum | MSI-H |  |
| Colorectum | FAP |  |
| ∗Top 15 enriched GO BP terms are showed in the bar plot of each disease state in each tissue. Each row represents a significant GO biological process which is colored according to the -log10(p.adjust). |
| Page: 1 2 3 4 5 6 7 8 9 |
| GO ID | Tissue | Disease Stage | Description | Gene Ratio | Bg Ratio | pvalue | p.adjust | Count |
| GO:00092603 | Colorectum | FAP | ribonucleotide biosynthetic process | 43/2622 | 182/18723 | 3.23e-04 | 4.15e-03 | 43 |
| GO:00061643 | Colorectum | FAP | purine nucleotide biosynthetic process | 44/2622 | 191/18723 | 4.96e-04 | 5.71e-03 | 44 |
| GO:00463903 | Colorectum | FAP | ribose phosphate biosynthetic process | 43/2622 | 190/18723 | 8.40e-04 | 8.72e-03 | 43 |
| GO:00725223 | Colorectum | FAP | purine-containing compound biosynthetic process | 44/2622 | 200/18723 | 1.35e-03 | 1.24e-02 | 44 |
| GO:00091505 | Colorectum | CRC | purine ribonucleotide metabolic process | 74/2078 | 368/18723 | 2.58e-07 | 2.38e-05 | 74 |
| GO:00061635 | Colorectum | CRC | purine nucleotide metabolic process | 78/2078 | 396/18723 | 2.98e-07 | 2.59e-05 | 78 |
| GO:00092594 | Colorectum | CRC | ribonucleotide metabolic process | 75/2078 | 385/18723 | 7.83e-07 | 5.04e-05 | 75 |
| GO:00725215 | Colorectum | CRC | purine-containing compound metabolic process | 79/2078 | 416/18723 | 1.15e-06 | 6.75e-05 | 79 |
| GO:00196934 | Colorectum | CRC | ribose phosphate metabolic process | 75/2078 | 396/18723 | 2.36e-06 | 1.13e-04 | 75 |
| GO:00091175 | Colorectum | CRC | nucleotide metabolic process | 81/2078 | 489/18723 | 1.45e-04 | 2.65e-03 | 81 |
| GO:00067535 | Colorectum | CRC | nucleoside phosphate metabolic process | 81/2078 | 497/18723 | 2.48e-04 | 4.06e-03 | 81 |
| GO:00091524 | Colorectum | CRC | purine ribonucleotide biosynthetic process | 30/2078 | 169/18723 | 6.31e-03 | 4.60e-02 | 30 |
| GO:0006753110 | Esophagus | ESCC | nucleoside phosphate metabolic process | 288/8552 | 497/18723 | 1.80e-08 | 3.50e-07 | 288 |
| GO:0019693111 | Esophagus | ESCC | ribose phosphate metabolic process | 234/8552 | 396/18723 | 4.24e-08 | 7.76e-07 | 234 |
| GO:0009117111 | Esophagus | ESCC | nucleotide metabolic process | 282/8552 | 489/18723 | 4.70e-08 | 8.50e-07 | 282 |
| GO:00067906 | Esophagus | ESCC | sulfur compound metabolic process | 201/8552 | 339/18723 | 2.64e-07 | 3.94e-06 | 201 |
| GO:0009259111 | Esophagus | ESCC | ribonucleotide metabolic process | 224/8552 | 385/18723 | 4.41e-07 | 6.00e-06 | 224 |
| GO:0072521111 | Esophagus | ESCC | purine-containing compound metabolic process | 238/8552 | 416/18723 | 1.20e-06 | 1.49e-05 | 238 |
| GO:0009150111 | Esophagus | ESCC | purine ribonucleotide metabolic process | 213/8552 | 368/18723 | 1.40e-06 | 1.69e-05 | 213 |
| GO:0046390110 | Esophagus | ESCC | ribose phosphate biosynthetic process | 119/8552 | 190/18723 | 1.73e-06 | 2.06e-05 | 119 |
| Page: 1 2 3 4 5 6 7 8 9 |
| Pathway ID | Tissue | Disease Stage | Description | Gene Ratio | Bg Ratio | pvalue | p.adjust | qvalue | Count |
| hsa00920 | Colorectum | AD | Sulfur metabolism | 8/2092 | 10/8465 | 3.78e-04 | 2.82e-03 | 1.80e-03 | 8 |
| hsa009201 | Colorectum | AD | Sulfur metabolism | 8/2092 | 10/8465 | 3.78e-04 | 2.82e-03 | 1.80e-03 | 8 |
| hsa009202 | Colorectum | SER | Sulfur metabolism | 8/1580 | 10/8465 | 4.56e-05 | 5.22e-04 | 3.79e-04 | 8 |
| hsa009203 | Colorectum | SER | Sulfur metabolism | 8/1580 | 10/8465 | 4.56e-05 | 5.22e-04 | 3.79e-04 | 8 |
| hsa009204 | Colorectum | MSS | Sulfur metabolism | 6/1875 | 10/8465 | 1.07e-02 | 3.74e-02 | 2.29e-02 | 6 |
| hsa009205 | Colorectum | MSS | Sulfur metabolism | 6/1875 | 10/8465 | 1.07e-02 | 3.74e-02 | 2.29e-02 | 6 |
| hsa009206 | Colorectum | FAP | Sulfur metabolism | 6/1404 | 10/8465 | 2.36e-03 | 1.13e-02 | 6.85e-03 | 6 |
| hsa009207 | Colorectum | FAP | Sulfur metabolism | 6/1404 | 10/8465 | 2.36e-03 | 1.13e-02 | 6.85e-03 | 6 |
| hsa0092010 | Esophagus | ESCC | Sulfur metabolism | 9/4205 | 10/8465 | 1.01e-02 | 2.38e-02 | 1.22e-02 | 9 |
| hsa0092011 | Esophagus | ESCC | Sulfur metabolism | 9/4205 | 10/8465 | 1.01e-02 | 2.38e-02 | 1.22e-02 | 9 |
| Page: 1 |
Top |
Cell-cell communication analysis |
| Identification of potential cell-cell interactions between two cell types and their ligand-receptor pairs for different disease states |
| Ligand | Receptor | LRpair | Pathway | Tissue | Disease Stage |
| Page: 1 |
Top |
Single-cell gene regulatory network inference analysis |
| Find out the significant the regulons (TFs) and the target genes of each regulon across cell types for different disease states |
| TF | Cell Type | Tissue | Disease Stage | Target Gene | RSS | Regulon Activity |
| ∗The dot plots of a searched regulon are shown for all cell subpopulations in each disease state of each tissue based on the regulon specific score inferred using pySCENIC and by calculating the average expression. |
| Page: 1 |
Top |
Somatic mutation of malignant transformation related genes |
| Annotation of somatic variants for genes involved in malignant transformation |
| Hugo Symbol | Variant Class | Variant Classification | dbSNP RS | HGVSc | HGVSp | HGVSp Short | SWISSPROT | BIOTYPE | SIFT | PolyPhen | Tumor Sample Barcode | Tissue | Histology | Sex | Age | Stage | Therapy Types | Drugs | Outcome |
| PAPSS2 | SNV | Missense_Mutation | rs373228712 | c.1351N>A | p.Gly451Ser | p.G451S | O95340 | protein_coding | deleterious(0) | probably_damaging(1) | TCGA-AC-A5XU-01 | Breast | breast invasive carcinoma | Female | >=65 | I/II | Hormone Therapy | letrozole | SD |
| PAPSS2 | SNV | Missense_Mutation | novel | c.385N>T | p.Arg129Cys | p.R129C | O95340 | protein_coding | deleterious(0) | probably_damaging(1) | TCGA-AN-A046-01 | Breast | breast invasive carcinoma | Female | >=65 | I/II | Unknown | Unknown | SD |
| PAPSS2 | SNV | Missense_Mutation | rs756961458 | c.1387N>T | p.Arg463Trp | p.R463W | O95340 | protein_coding | deleterious(0) | probably_damaging(1) | TCGA-AN-A046-01 | Breast | breast invasive carcinoma | Female | >=65 | I/II | Unknown | Unknown | SD |
| PAPSS2 | SNV | Missense_Mutation | novel | c.952T>G | p.Cys318Gly | p.C318G | O95340 | protein_coding | tolerated(0.33) | benign(0.024) | TCGA-AR-A1AP-01 | Breast | breast invasive carcinoma | Female | >=65 | I/II | Hormone Therapy | anastrozole | SD |
| PAPSS2 | SNV | Missense_Mutation | novel | c.952T>G | p.Cys318Gly | p.C318G | O95340 | protein_coding | tolerated(0.33) | benign(0.024) | TCGA-B6-A1KN-01 | Breast | breast invasive carcinoma | Female | <65 | III/IV | Unknown | Unknown | SD |
| PAPSS2 | SNV | Missense_Mutation | c.443T>A | p.Val148Glu | p.V148E | O95340 | protein_coding | deleterious(0) | possibly_damaging(0.627) | TCGA-E9-A22H-01 | Breast | breast invasive carcinoma | Female | <65 | I/II | Chemotherapy | doxorubicin | SD | |
| PAPSS2 | insertion | Nonsense_Mutation | novel | c.266_267insGATCATTGTGCTTTGAAACCATGGTGGAAGCCACATGGTAA | p.Gly90IlefsTer5 | p.G90Ifs*5 | O95340 | protein_coding | TCGA-AN-A0FF-01 | Breast | breast invasive carcinoma | Female | <65 | I/II | Unknown | Unknown | SD | ||
| PAPSS2 | insertion | Nonsense_Mutation | novel | c.1300_1301insATCCCAGCTACTCAGGAGGCTGAGGCAGGAGAA | p.Leu434delinsHisProSerTyrSerGlyGlyTerGlyArgArgIle | p.L434delinsHPSYSGG*GRRI | O95340 | protein_coding | TCGA-B6-A0IN-01 | Breast | breast invasive carcinoma | Female | <65 | I/II | Unknown | Unknown | PD | ||
| PAPSS2 | deletion | Frame_Shift_Del | novel | c.1461delG | p.Ser488LeufsTer19 | p.S488Lfs*19 | O95340 | protein_coding | TCGA-D8-A27V-01 | Breast | breast invasive carcinoma | Female | <65 | I/II | Hormone Therapy | tamoxiphen | SD | ||
| PAPSS2 | SNV | Missense_Mutation | c.12C>G | p.Ile4Met | p.I4M | O95340 | protein_coding | tolerated_low_confidence(0.23) | benign(0) | TCGA-IR-A3LA-01 | Cervix | cervical & endocervical cancer | Female | <65 | I/II | Chemotherapy | cisplatin | CR |
| Page: 1 2 3 4 5 6 7 |
Top |
Related drugs of malignant transformation related genes |
| Identification of chemicals and drugs interact with genes involved in malignant transfromation |
| (DGIdb 4.0) |
| Entrez ID | Symbol | Category | Interaction Types | Drug Claim Name | Drug Name | PMIDs |
| Page: 1 |

Copyright 2023-Present -The University of Texas Health Science Center at Houston |