
|
|||||
|
 | |
| |
| |
| |
| |
| |
|
Gene: PAFAH1B2 |
Gene summary for PAFAH1B2 |
| Gene information | Species | Human | Gene symbol | PAFAH1B2 | Gene ID | 5049 |
| Gene name | platelet activating factor acetylhydrolase 1b catalytic subunit 2 | |
| Gene Alias | HEL-S-303 | |
| Cytomap | 11q23.3 | |
| Gene Type | protein-coding | GO ID | GO:0000003 | UniProtAcc | P68402 |
Top |
Malignant transformation analysis |
| Identification of the aberrant gene expression in precancerous and cancerous lesions by comparing the gene expression of stem-like cells in diseased tissues with normal stem cells |
| Entrez ID | Symbol | Replicates | Species | Organ | Tissue | Adj P-value | Log2FC | Malignancy |
| 5049 | PAFAH1B2 | HTA11_2487_2000001011 | Human | Colorectum | SER | 5.87e-08 | 4.94e-01 | -0.1808 |
| 5049 | PAFAH1B2 | HTA11_1938_2000001011 | Human | Colorectum | AD | 5.36e-15 | 7.73e-01 | -0.0811 |
| 5049 | PAFAH1B2 | HTA11_78_2000001011 | Human | Colorectum | AD | 3.23e-05 | 4.36e-01 | -0.1088 |
| 5049 | PAFAH1B2 | HTA11_347_2000001011 | Human | Colorectum | AD | 1.36e-18 | 6.29e-01 | -0.1954 |
| 5049 | PAFAH1B2 | HTA11_411_2000001011 | Human | Colorectum | SER | 2.20e-02 | 6.47e-01 | -0.2602 |
| 5049 | PAFAH1B2 | HTA11_3361_2000001011 | Human | Colorectum | AD | 1.94e-03 | 3.42e-01 | -0.1207 |
| 5049 | PAFAH1B2 | HTA11_83_2000001011 | Human | Colorectum | SER | 2.02e-02 | 3.56e-01 | -0.1526 |
| 5049 | PAFAH1B2 | HTA11_696_2000001011 | Human | Colorectum | AD | 3.09e-04 | 3.65e-01 | -0.1464 |
| 5049 | PAFAH1B2 | HTA11_1391_2000001011 | Human | Colorectum | AD | 1.15e-16 | 6.88e-01 | -0.059 |
| 5049 | PAFAH1B2 | HTA11_546_2000001011 | Human | Colorectum | AD | 1.48e-02 | 2.01e-01 | -0.0842 |
| 5049 | PAFAH1B2 | HTA11_7469_2000001011 | Human | Colorectum | AD | 1.88e-03 | 5.60e-01 | -0.0124 |
| 5049 | PAFAH1B2 | HTA11_99999970781_79442 | Human | Colorectum | MSS | 5.52e-10 | 4.98e-01 | 0.294 |
| 5049 | PAFAH1B2 | HTA11_99999965104_69814 | Human | Colorectum | MSS | 1.61e-07 | 5.30e-01 | 0.281 |
| 5049 | PAFAH1B2 | HTA11_99999971662_82457 | Human | Colorectum | MSS | 7.44e-16 | 7.18e-01 | 0.3859 |
| 5049 | PAFAH1B2 | HTA11_99999973899_84307 | Human | Colorectum | MSS | 9.42e-06 | 5.15e-01 | 0.2585 |
| 5049 | PAFAH1B2 | A015-C-203 | Human | Colorectum | FAP | 3.70e-10 | -1.69e-01 | -0.1294 |
| 5049 | PAFAH1B2 | A002-C-201 | Human | Colorectum | FAP | 1.80e-03 | -2.06e-01 | 0.0324 |
| 5049 | PAFAH1B2 | A002-C-203 | Human | Colorectum | FAP | 1.31e-03 | -7.27e-02 | 0.2786 |
| 5049 | PAFAH1B2 | A001-C-119 | Human | Colorectum | FAP | 1.50e-03 | -3.08e-01 | -0.1557 |
| 5049 | PAFAH1B2 | A001-C-108 | Human | Colorectum | FAP | 1.29e-06 | -1.62e-01 | -0.0272 |
| Page: 1 2 3 4 5 6 7 8 |
| Tissue | Expression Dynamics | Abbreviation |
| Colorectum (GSE201348) |  | FAP: Familial adenomatous polyposis |
| CRC: Colorectal cancer | ||
| Colorectum (HTA11) |  | AD: Adenomas |
| SER: Sessile serrated lesions | ||
| MSI-H: Microsatellite-high colorectal cancer | ||
| MSS: Microsatellite stable colorectal cancer | ||
| Esophagus | 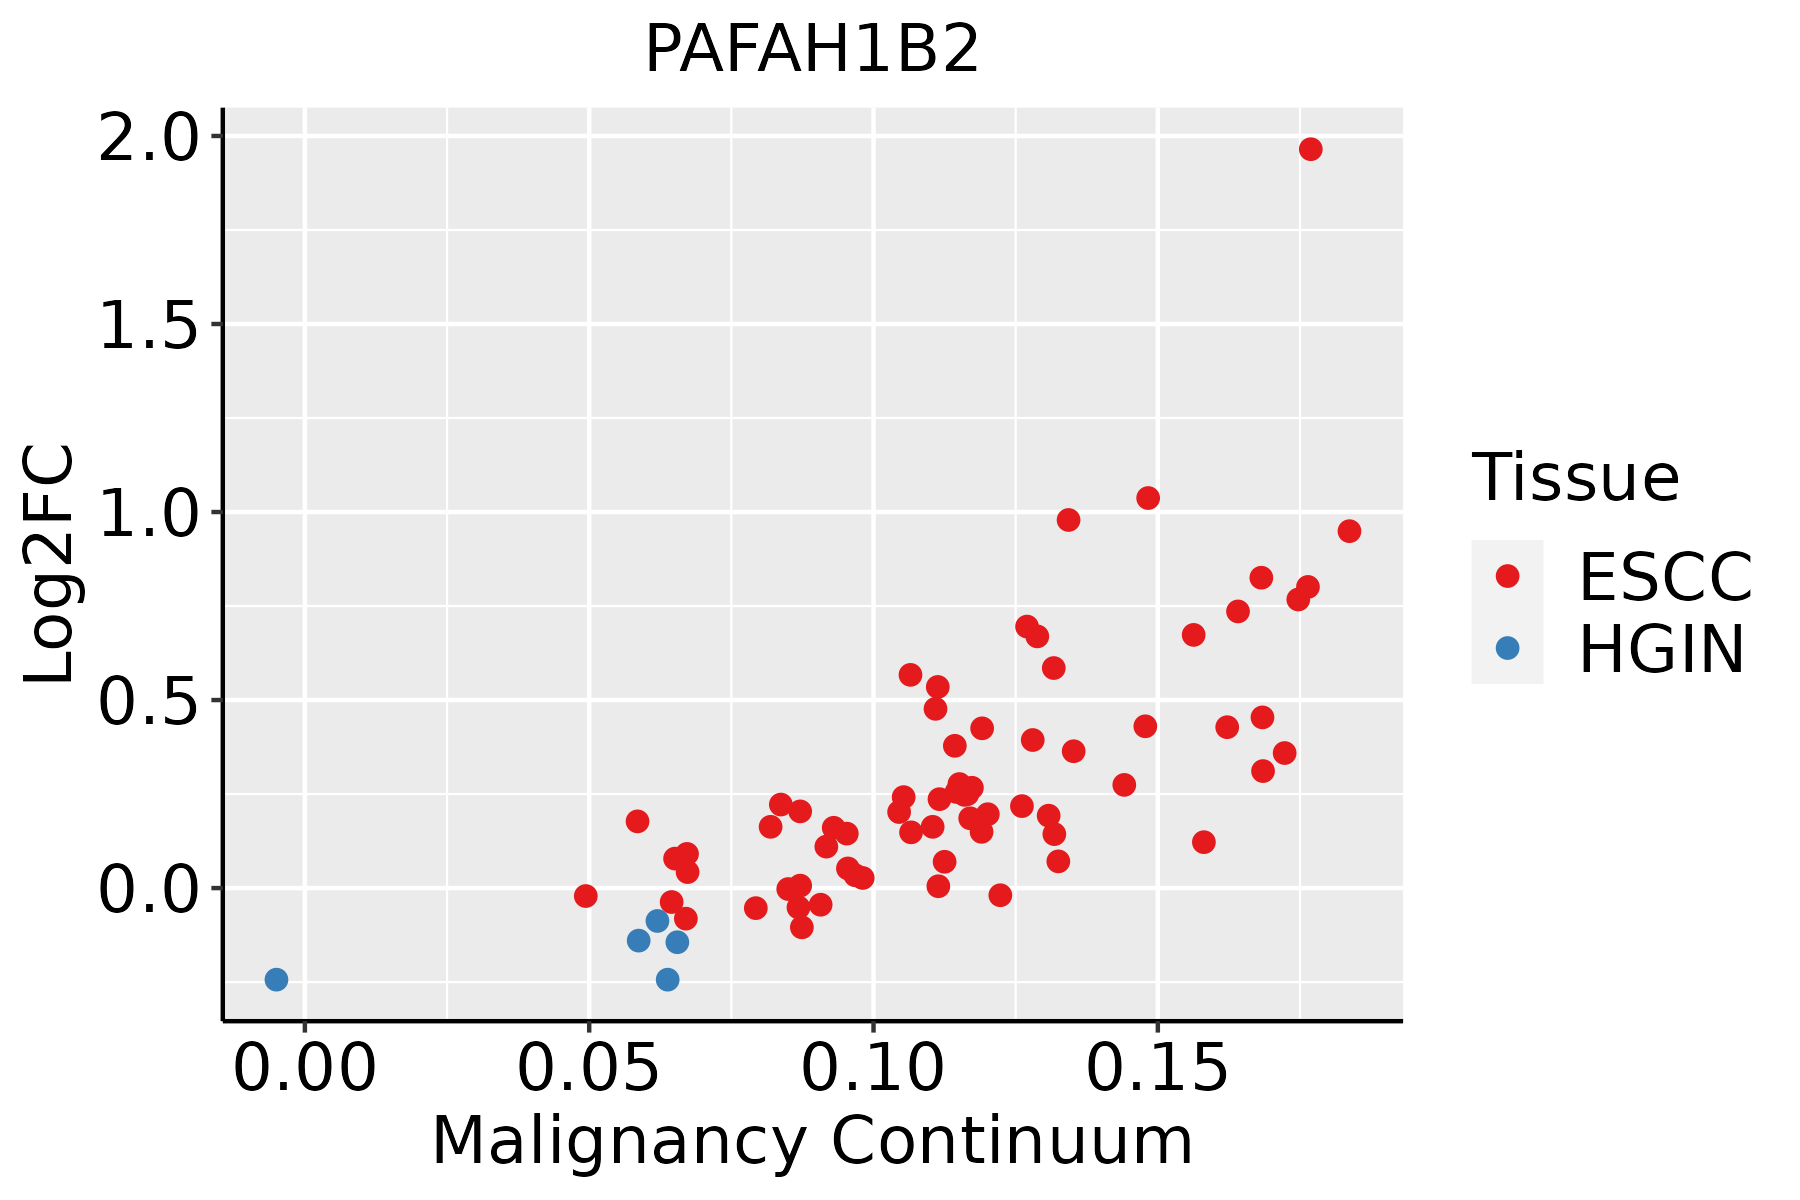 | ESCC: Esophageal squamous cell carcinoma |
| HGIN: High-grade intraepithelial neoplasias | ||
| LGIN: Low-grade intraepithelial neoplasias | ||
| Liver |  | HCC: Hepatocellular carcinoma |
| NAFLD: Non-alcoholic fatty liver disease | ||
| Oral Cavity | 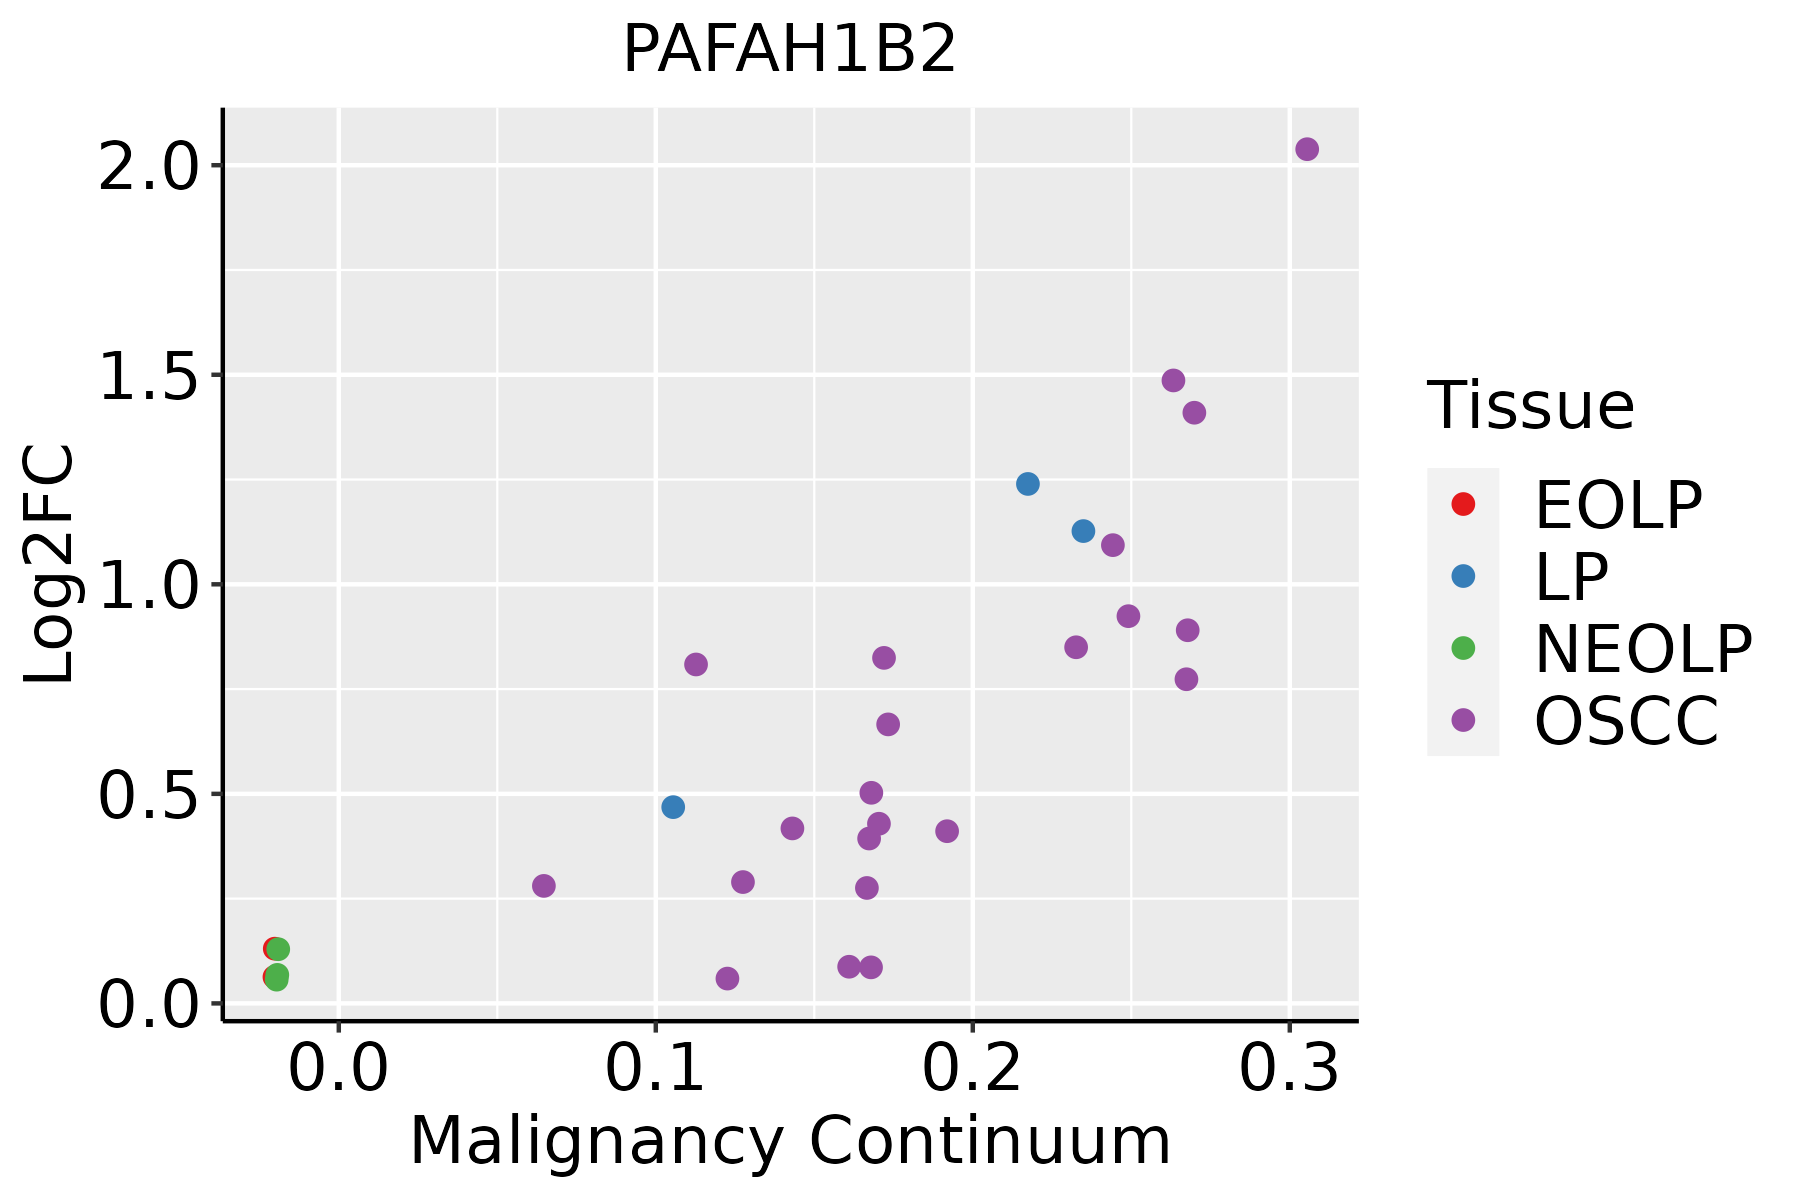 | EOLP: Erosive Oral lichen planus |
| LP: leukoplakia | ||
| NEOLP: Non-erosive oral lichen planus | ||
| OSCC: Oral squamous cell carcinoma | ||
| Skin | 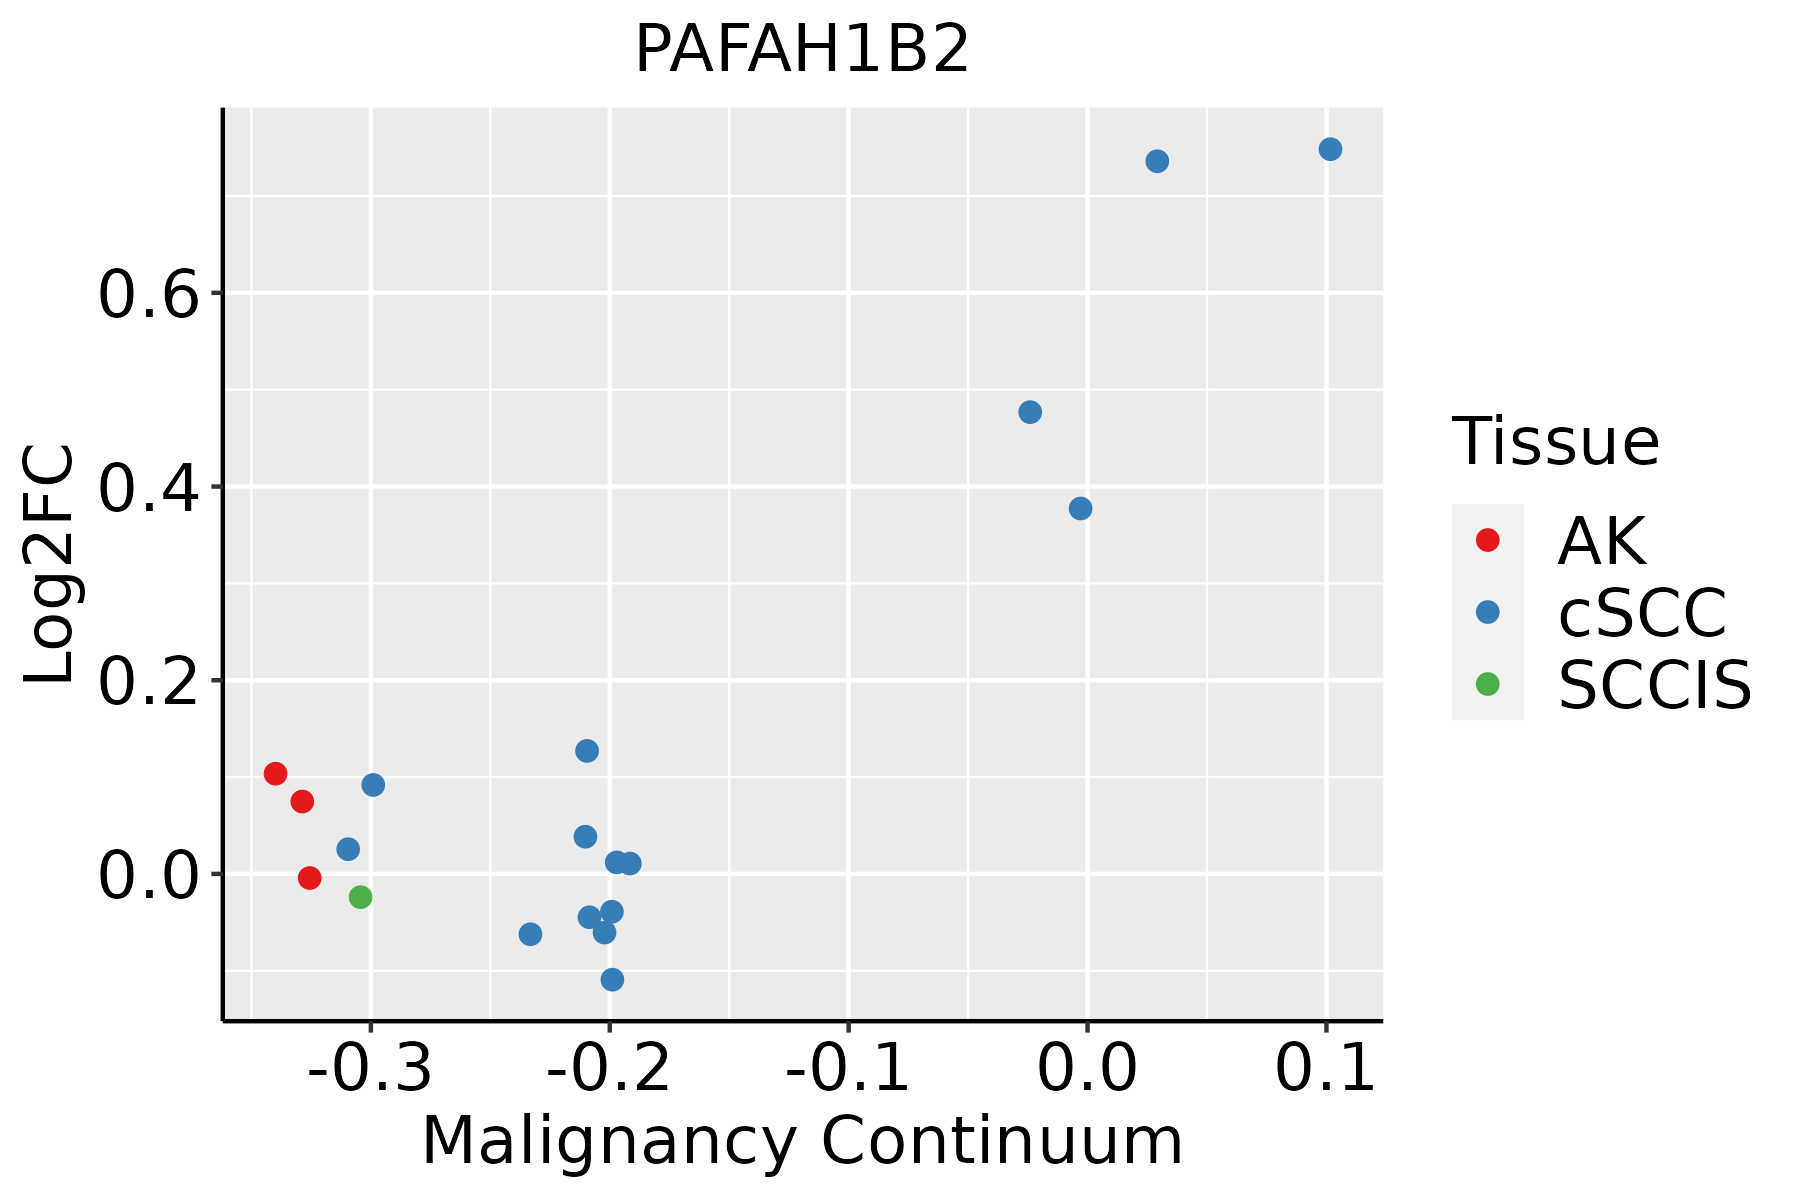 | AK: Actinic keratosis |
| cSCC: Cutaneous squamous cell carcinoma | ||
| SCCIS:squamous cell carcinoma in situ | ||
| Thyroid | 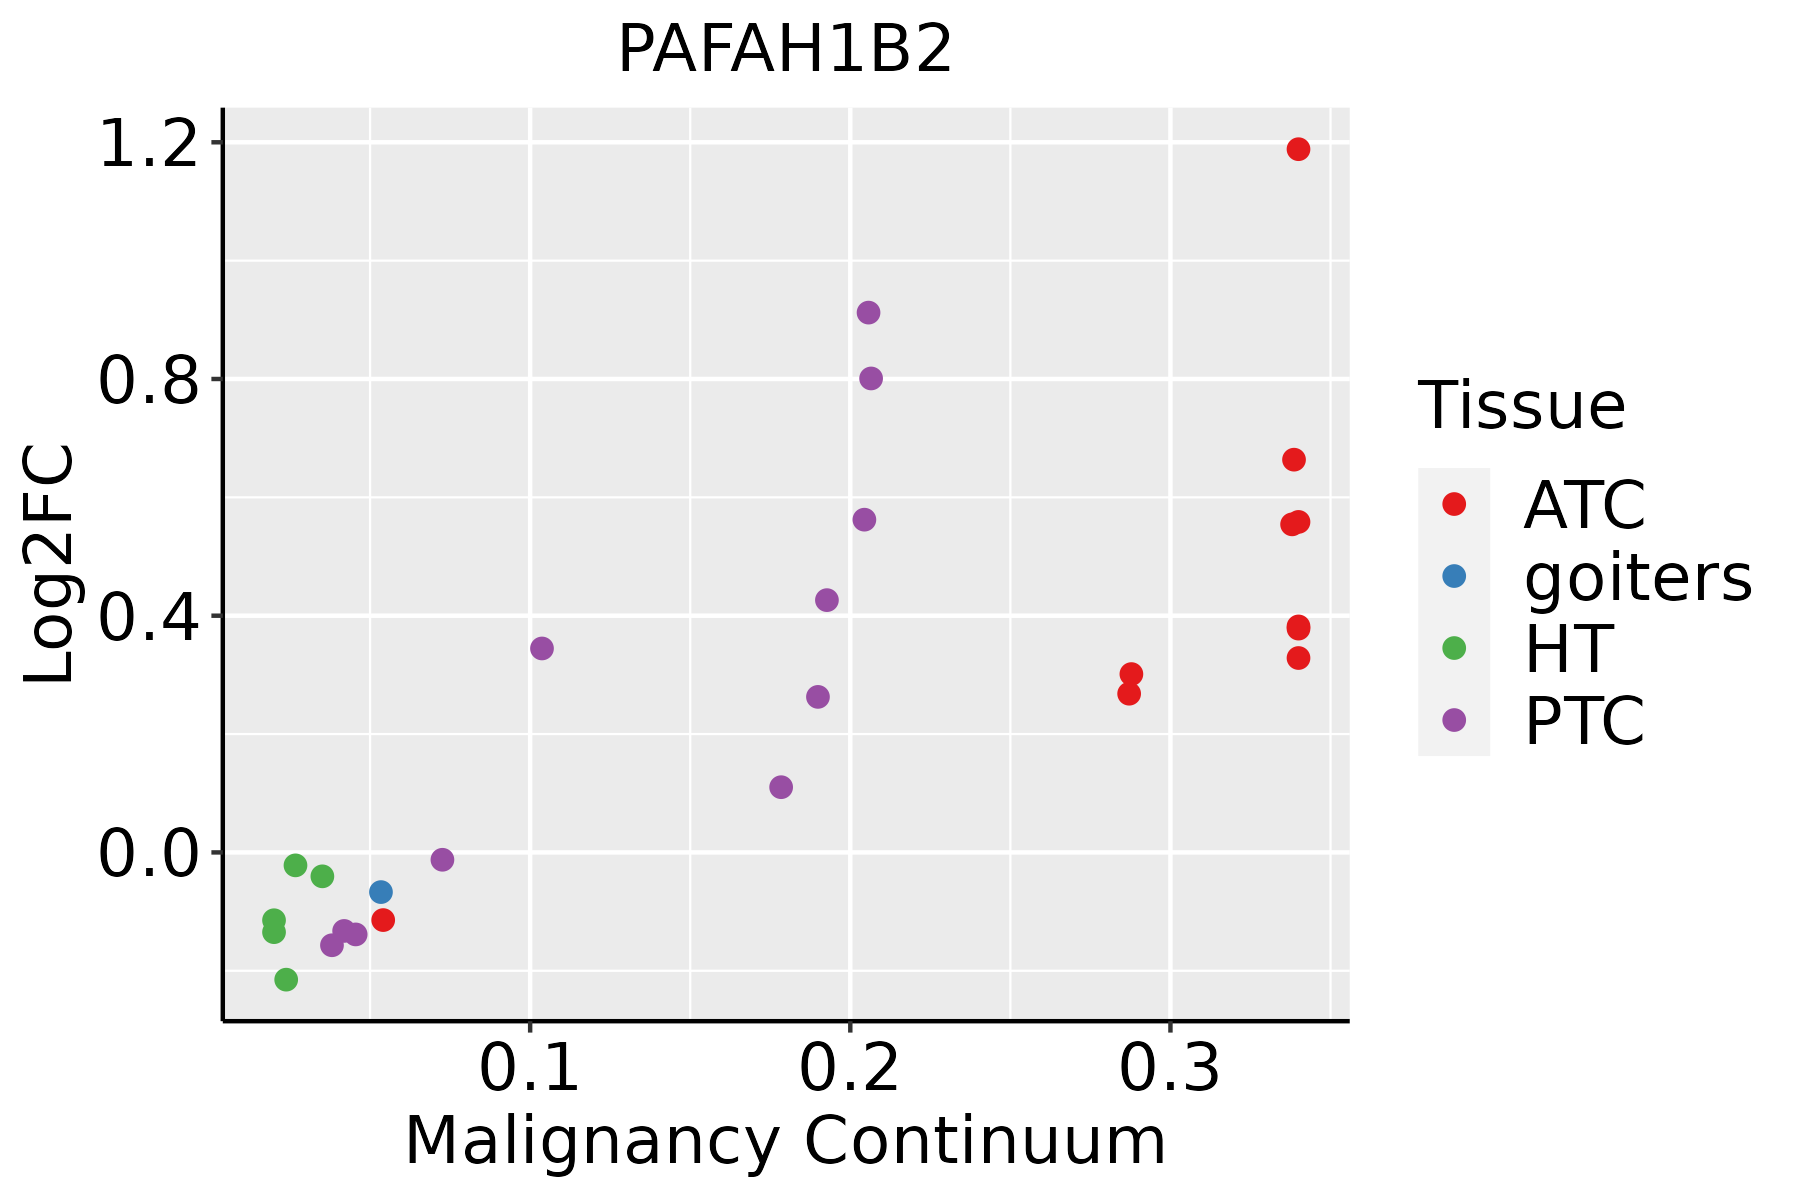 | ATC: Anaplastic thyroid cancer |
| HT: Hashimoto's thyroiditis | ||
| PTC: Papillary thyroid cancer |
| ∗log2FC in expression of this searched gene in stem-like cells from each diseased tissue sample relative to stem-like cells in normal samples in each tissue plotted against the malignancy continuum. Samples are colored based on if they are from different disease stage. |
Top |
Malignant transformation related pathway analysis |
| Find out the enriched GO biological processes and KEGG pathways involved in transition from healthy to precancer to cancer |
| Tissue | Disease Stage | Enriched GO biological Processes |
| Colorectum | AD |  |
| Colorectum | SER |  |
| Colorectum | MSS |  |
| Colorectum | MSI-H |  |
| Colorectum | FAP |  |
| ∗Top 15 enriched GO BP terms are showed in the bar plot of each disease state in each tissue. Each row represents a significant GO biological process which is colored according to the -log10(p.adjust). |
| Page: 1 2 3 4 5 6 7 8 9 |
| GO ID | Tissue | Disease Stage | Description | Gene Ratio | Bg Ratio | pvalue | p.adjust | Count |
| GO:001624113 | Oral cavity | LP | regulation of macroautophagy | 61/4623 | 141/18723 | 1.00e-06 | 2.50e-05 | 61 |
| GO:001050815 | Oral cavity | LP | positive regulation of autophagy | 44/4623 | 124/18723 | 4.61e-03 | 2.93e-02 | 44 |
| GO:000989628 | Skin | cSCC | positive regulation of catabolic process | 206/4864 | 492/18723 | 6.06e-15 | 4.64e-13 | 206 |
| GO:001623619 | Skin | cSCC | macroautophagy | 136/4864 | 291/18723 | 1.36e-14 | 9.78e-13 | 136 |
| GO:003133128 | Skin | cSCC | positive regulation of cellular catabolic process | 182/4864 | 427/18723 | 3.29e-14 | 2.22e-12 | 182 |
| GO:001050619 | Skin | cSCC | regulation of autophagy | 127/4864 | 317/18723 | 2.36e-08 | 6.71e-07 | 127 |
| GO:00162419 | Skin | cSCC | regulation of macroautophagy | 63/4864 | 141/18723 | 1.13e-06 | 1.97e-05 | 63 |
| GO:00105089 | Skin | cSCC | positive regulation of autophagy | 45/4864 | 124/18723 | 7.08e-03 | 3.40e-02 | 45 |
| GO:0009896113 | Thyroid | PTC | positive regulation of catabolic process | 278/5968 | 492/18723 | 3.35e-30 | 2.64e-27 | 278 |
| GO:0031331113 | Thyroid | PTC | positive regulation of cellular catabolic process | 249/5968 | 427/18723 | 5.28e-30 | 3.58e-27 | 249 |
| GO:0016236110 | Thyroid | PTC | macroautophagy | 167/5968 | 291/18723 | 1.51e-19 | 1.91e-17 | 167 |
| GO:0010506110 | Thyroid | PTC | regulation of autophagy | 172/5968 | 317/18723 | 8.76e-17 | 7.57e-15 | 172 |
| GO:001624110 | Thyroid | PTC | regulation of macroautophagy | 84/5968 | 141/18723 | 1.04e-11 | 4.27e-10 | 84 |
| GO:001050810 | Thyroid | PTC | positive regulation of autophagy | 70/5968 | 124/18723 | 1.30e-08 | 3.08e-07 | 70 |
| GO:00162395 | Thyroid | PTC | positive regulation of macroautophagy | 36/5968 | 63/18723 | 2.98e-05 | 2.86e-04 | 36 |
| GO:0009896210 | Thyroid | ATC | positive regulation of catabolic process | 290/6293 | 492/18723 | 2.15e-31 | 1.94e-28 | 290 |
| GO:0031331210 | Thyroid | ATC | positive regulation of cellular catabolic process | 258/6293 | 427/18723 | 2.09e-30 | 1.65e-27 | 258 |
| GO:001623623 | Thyroid | ATC | macroautophagy | 169/6293 | 291/18723 | 6.56e-18 | 7.69e-16 | 169 |
| GO:001050632 | Thyroid | ATC | regulation of autophagy | 180/6293 | 317/18723 | 1.34e-17 | 1.46e-15 | 180 |
| GO:001624115 | Thyroid | ATC | regulation of macroautophagy | 86/6293 | 141/18723 | 2.35e-11 | 8.24e-10 | 86 |
| Page: 1 2 3 4 5 |
| Pathway ID | Tissue | Disease Stage | Description | Gene Ratio | Bg Ratio | pvalue | p.adjust | qvalue | Count |
| Page: 1 |
Top |
Cell-cell communication analysis |
| Identification of potential cell-cell interactions between two cell types and their ligand-receptor pairs for different disease states |
| Ligand | Receptor | LRpair | Pathway | Tissue | Disease Stage |
| Page: 1 |
Top |
Single-cell gene regulatory network inference analysis |
| Find out the significant the regulons (TFs) and the target genes of each regulon across cell types for different disease states |
| TF | Cell Type | Tissue | Disease Stage | Target Gene | RSS | Regulon Activity |
| ∗The dot plots of a searched regulon are shown for all cell subpopulations in each disease state of each tissue based on the regulon specific score inferred using pySCENIC and by calculating the average expression. |
| Page: 1 |
Top |
Somatic mutation of malignant transformation related genes |
| Annotation of somatic variants for genes involved in malignant transformation |
| Hugo Symbol | Variant Class | Variant Classification | dbSNP RS | HGVSc | HGVSp | HGVSp Short | SWISSPROT | BIOTYPE | SIFT | PolyPhen | Tumor Sample Barcode | Tissue | Histology | Sex | Age | Stage | Therapy Types | Drugs | Outcome |
| PAFAH1B2 | SNV | Missense_Mutation | c.185T>G | p.Leu62Arg | p.L62R | P68402 | protein_coding | tolerated(0.06) | benign(0.113) | TCGA-LL-A7SZ-01 | Breast | breast invasive carcinoma | Female | <65 | I/II | Chemotherapy | adriamycin | CR | |
| PAFAH1B2 | SNV | Missense_Mutation | novel | c.83A>T | p.His28Leu | p.H28L | P68402 | protein_coding | deleterious(0) | probably_damaging(0.992) | TCGA-A6-5657-01 | Colorectum | colon adenocarcinoma | Male | >=65 | III/IV | Ancillary | leucovorin | SD |
| PAFAH1B2 | insertion | Nonsense_Mutation | novel | c.372_373insTAGATGAAA | p.Leu124_Ile125insTer | p.L124_I125ins* | P68402 | protein_coding | TCGA-AM-5820-01 | Colorectum | colon adenocarcinoma | Female | <65 | I/II | Unknown | Unknown | SD | ||
| PAFAH1B2 | deletion | Frame_Shift_Del | c.190delT | p.Ser64ProfsTer6 | p.S64Pfs*6 | P68402 | protein_coding | TCGA-AZ-4615-01 | Colorectum | colon adenocarcinoma | Male | >=65 | III/IV | Chemotherapy | xeloda | PD | |||
| PAFAH1B2 | SNV | Missense_Mutation | c.77N>A | p.Ser26Tyr | p.S26Y | P68402 | protein_coding | deleterious(0) | probably_damaging(0.996) | TCGA-AP-A059-01 | Endometrium | uterine corpus endometrioid carcinoma | Female | >=65 | I/II | Unknown | Unknown | SD | |
| PAFAH1B2 | SNV | Missense_Mutation | rs747423610 | c.322G>A | p.Glu108Lys | p.E108K | P68402 | protein_coding | tolerated(0.33) | benign(0.018) | TCGA-AP-A0LM-01 | Endometrium | uterine corpus endometrioid carcinoma | Female | <65 | III/IV | Chemotherapy | cisplatin | SD |
| PAFAH1B2 | SNV | Missense_Mutation | novel | c.508N>A | p.Val170Met | p.V170M | P68402 | protein_coding | deleterious(0.04) | probably_damaging(0.959) | TCGA-AX-A2HC-01 | Endometrium | uterine corpus endometrioid carcinoma | Female | <65 | III/IV | Chemotherapy | paclitaxel | PD |
| PAFAH1B2 | SNV | Missense_Mutation | c.262G>A | p.Gly88Arg | p.G88R | P68402 | protein_coding | deleterious(0) | probably_damaging(0.999) | TCGA-B5-A0K6-01 | Endometrium | uterine corpus endometrioid carcinoma | Female | <65 | I/II | Unknown | Unknown | SD | |
| PAFAH1B2 | SNV | Missense_Mutation | novel | c.259A>C | p.Asn87His | p.N87H | P68402 | protein_coding | deleterious(0.03) | probably_damaging(0.959) | TCGA-B5-A1MR-01 | Endometrium | uterine corpus endometrioid carcinoma | Female | >=65 | III/IV | Unknown | Unknown | SD |
| PAFAH1B2 | SNV | Missense_Mutation | novel | c.358N>A | p.Ala120Thr | p.A120T | P68402 | protein_coding | tolerated(0.31) | benign(0.414) | TCGA-B5-A3FC-01 | Endometrium | uterine corpus endometrioid carcinoma | Female | <65 | I/II | Unknown | Unknown | SD |
| Page: 1 2 |
Top |
Related drugs of malignant transformation related genes |
| Identification of chemicals and drugs interact with genes involved in malignant transfromation |
| (DGIdb 4.0) |
| Entrez ID | Symbol | Category | Interaction Types | Drug Claim Name | Drug Name | PMIDs |
| Page: 1 |

Copyright 2023-Present -The University of Texas Health Science Center at Houston |