
|
|||||
|
 | |
| |
| |
| |
| |
| |
|
Gene: OXA1L |
Gene summary for OXA1L |
| Gene information | Species | Human | Gene symbol | OXA1L | Gene ID | 5018 |
| Gene name | OXA1L mitochondrial inner membrane protein | |
| Gene Alias | OXA1 | |
| Cytomap | 14q11.2 | |
| Gene Type | protein-coding | GO ID | GO:0006091 | UniProtAcc | J3KNA0 |
Top |
Malignant transformation analysis |
| Identification of the aberrant gene expression in precancerous and cancerous lesions by comparing the gene expression of stem-like cells in diseased tissues with normal stem cells |
| Entrez ID | Symbol | Replicates | Species | Organ | Tissue | Adj P-value | Log2FC | Malignancy |
| 5018 | OXA1L | HTA11_3410_2000001011 | Human | Colorectum | AD | 3.34e-12 | 4.04e-01 | 0.0155 |
| 5018 | OXA1L | HTA11_2487_2000001011 | Human | Colorectum | SER | 2.58e-02 | 3.20e-01 | -0.1808 |
| 5018 | OXA1L | HTA11_1938_2000001011 | Human | Colorectum | AD | 1.97e-02 | 3.82e-01 | -0.0811 |
| 5018 | OXA1L | HTA11_78_2000001011 | Human | Colorectum | AD | 8.51e-06 | 3.92e-01 | -0.1088 |
| 5018 | OXA1L | HTA11_347_2000001011 | Human | Colorectum | AD | 4.36e-19 | 5.99e-01 | -0.1954 |
| 5018 | OXA1L | HTA11_3361_2000001011 | Human | Colorectum | AD | 1.84e-03 | 3.85e-01 | -0.1207 |
| 5018 | OXA1L | HTA11_83_2000001011 | Human | Colorectum | SER | 4.16e-08 | 5.41e-01 | -0.1526 |
| 5018 | OXA1L | HTA11_696_2000001011 | Human | Colorectum | AD | 2.06e-12 | 3.94e-01 | -0.1464 |
| 5018 | OXA1L | HTA11_866_2000001011 | Human | Colorectum | AD | 1.18e-05 | 3.21e-01 | -0.1001 |
| 5018 | OXA1L | HTA11_1391_2000001011 | Human | Colorectum | AD | 5.00e-17 | 7.49e-01 | -0.059 |
| 5018 | OXA1L | HTA11_5216_2000001011 | Human | Colorectum | SER | 1.05e-05 | 7.01e-01 | -0.1462 |
| 5018 | OXA1L | HTA11_546_2000001011 | Human | Colorectum | AD | 1.10e-03 | 3.95e-01 | -0.0842 |
| 5018 | OXA1L | HTA11_7862_2000001011 | Human | Colorectum | AD | 1.71e-04 | 5.05e-01 | -0.0179 |
| 5018 | OXA1L | HTA11_866_3004761011 | Human | Colorectum | AD | 3.88e-18 | 6.29e-01 | 0.096 |
| 5018 | OXA1L | HTA11_4255_2000001011 | Human | Colorectum | SER | 2.70e-03 | 6.22e-01 | 0.0446 |
| 5018 | OXA1L | HTA11_8622_2000001021 | Human | Colorectum | SER | 1.03e-04 | 6.55e-01 | 0.0528 |
| 5018 | OXA1L | HTA11_7663_2000001011 | Human | Colorectum | SER | 1.99e-06 | 6.81e-01 | 0.0131 |
| 5018 | OXA1L | HTA11_6801_2000001011 | Human | Colorectum | SER | 2.19e-08 | 8.08e-01 | 0.0171 |
| 5018 | OXA1L | HTA11_10711_2000001011 | Human | Colorectum | AD | 1.53e-05 | 3.57e-01 | 0.0338 |
| 5018 | OXA1L | HTA11_7696_3000711011 | Human | Colorectum | AD | 4.87e-19 | 5.37e-01 | 0.0674 |
| Page: 1 2 3 4 5 6 7 8 |
| Tissue | Expression Dynamics | Abbreviation |
| Colorectum (GSE201348) |  | FAP: Familial adenomatous polyposis |
| CRC: Colorectal cancer | ||
| Colorectum (HTA11) |  | AD: Adenomas |
| SER: Sessile serrated lesions | ||
| MSI-H: Microsatellite-high colorectal cancer | ||
| MSS: Microsatellite stable colorectal cancer | ||
| Esophagus |  | ESCC: Esophageal squamous cell carcinoma |
| HGIN: High-grade intraepithelial neoplasias | ||
| LGIN: Low-grade intraepithelial neoplasias | ||
| Liver | 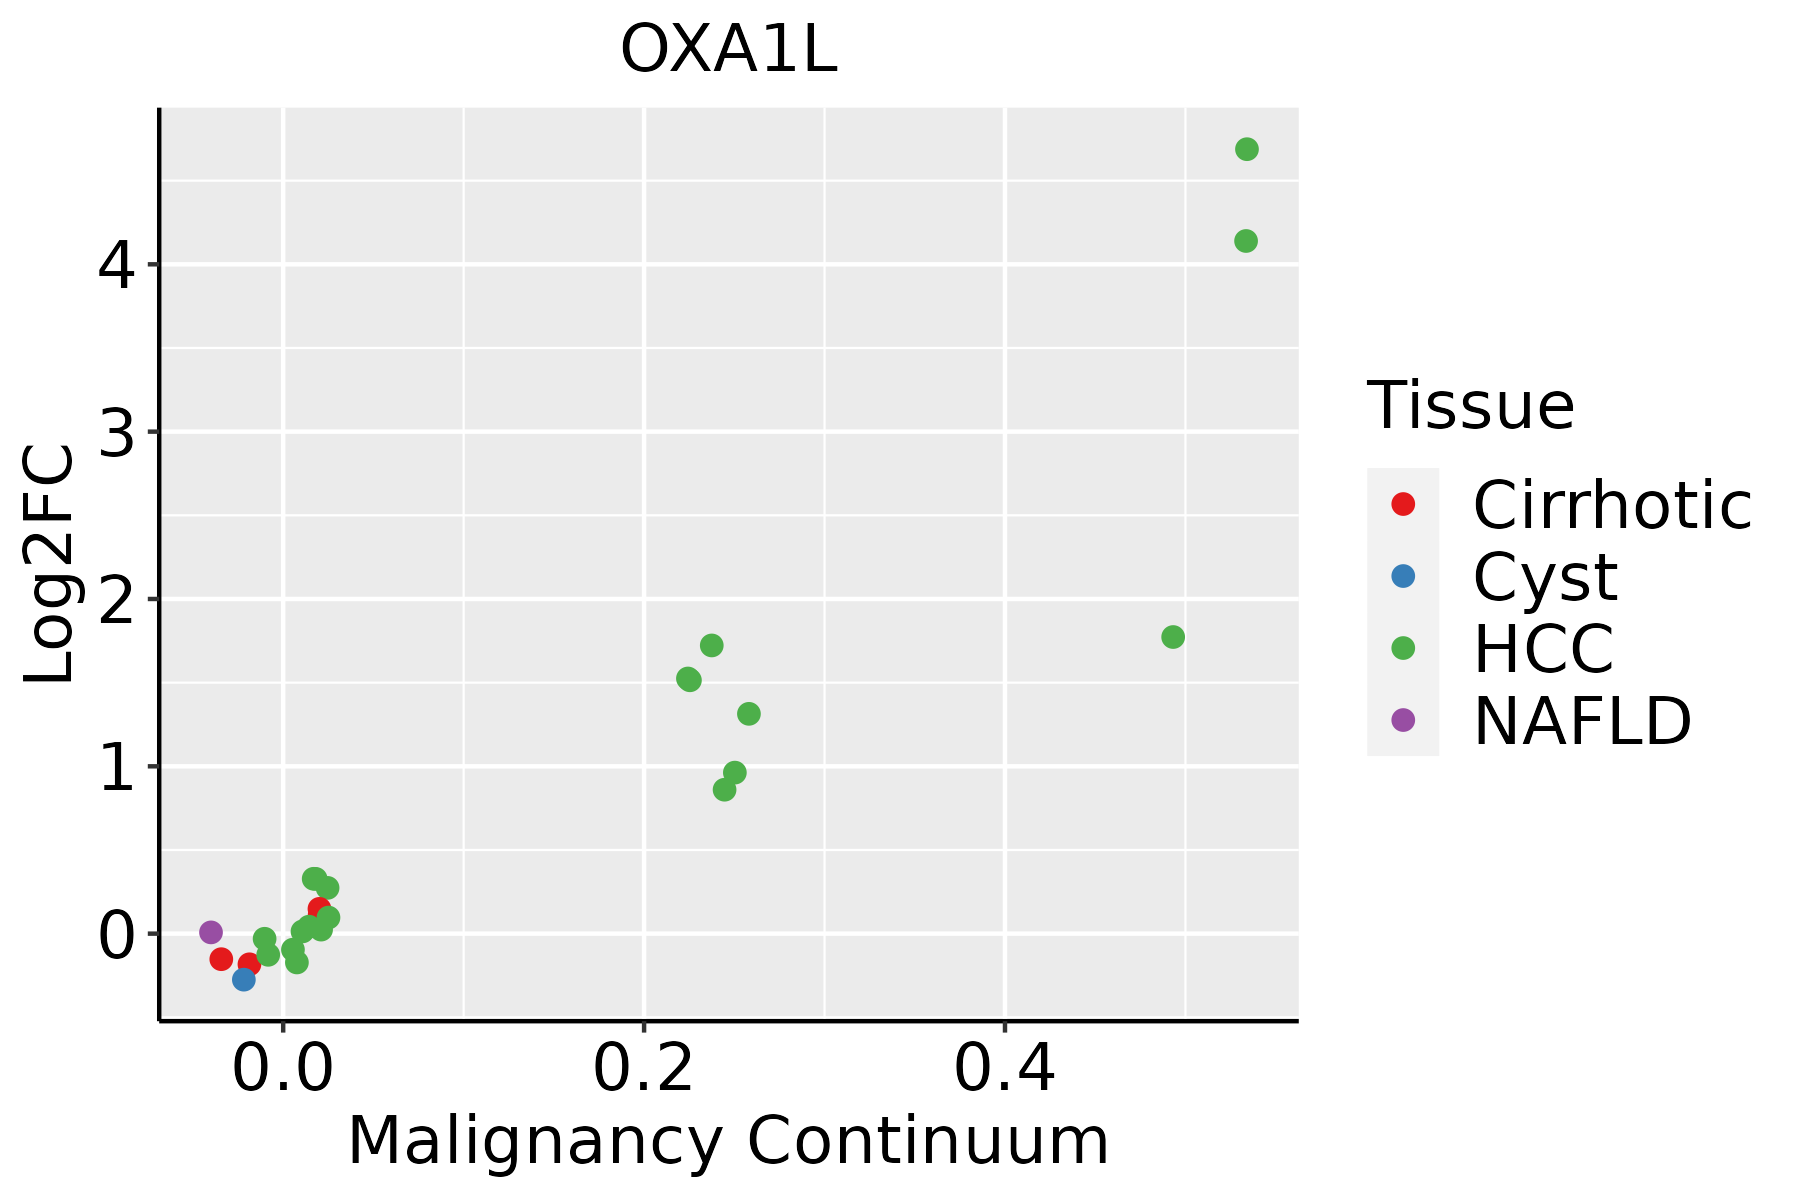 | HCC: Hepatocellular carcinoma |
| NAFLD: Non-alcoholic fatty liver disease | ||
| Oral Cavity |  | EOLP: Erosive Oral lichen planus |
| LP: leukoplakia | ||
| NEOLP: Non-erosive oral lichen planus | ||
| OSCC: Oral squamous cell carcinoma | ||
| Skin | 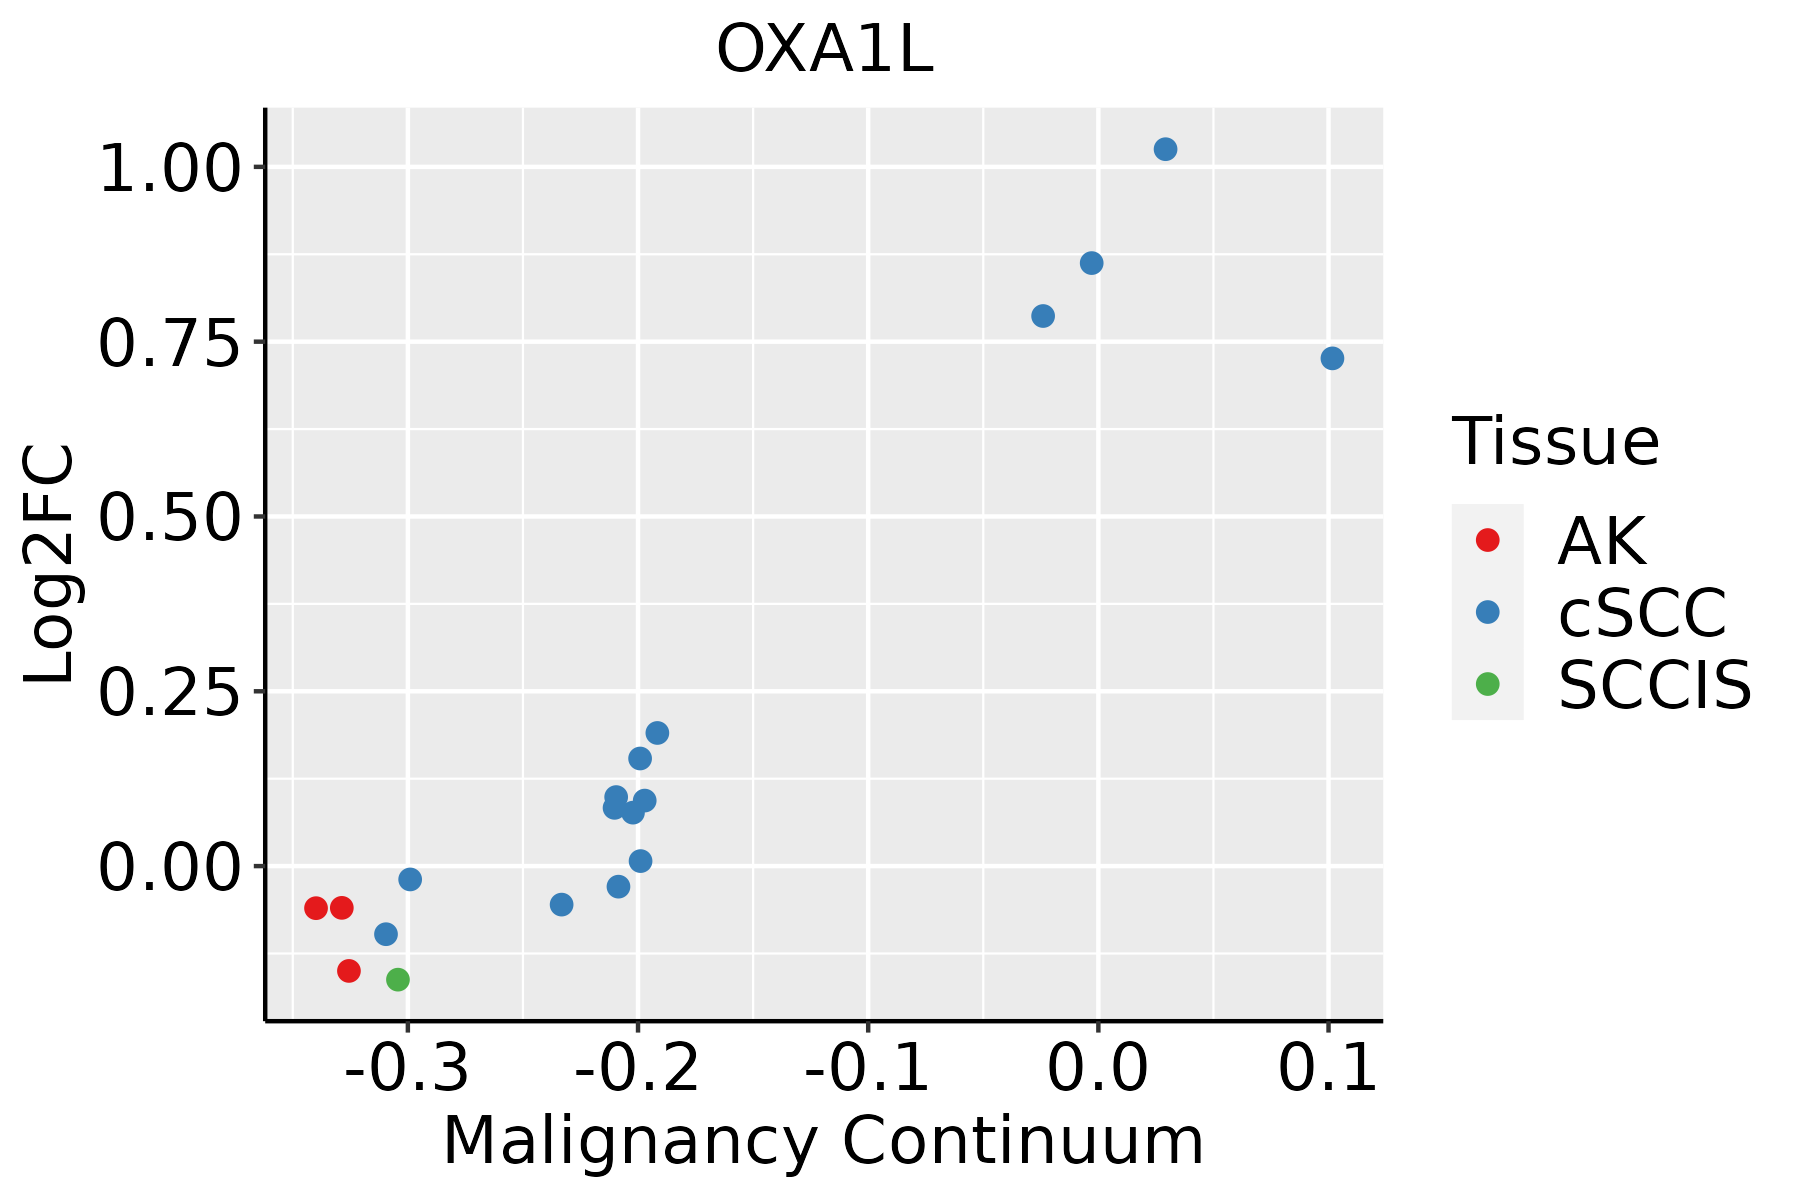 | AK: Actinic keratosis |
| cSCC: Cutaneous squamous cell carcinoma | ||
| SCCIS:squamous cell carcinoma in situ | ||
| Thyroid | 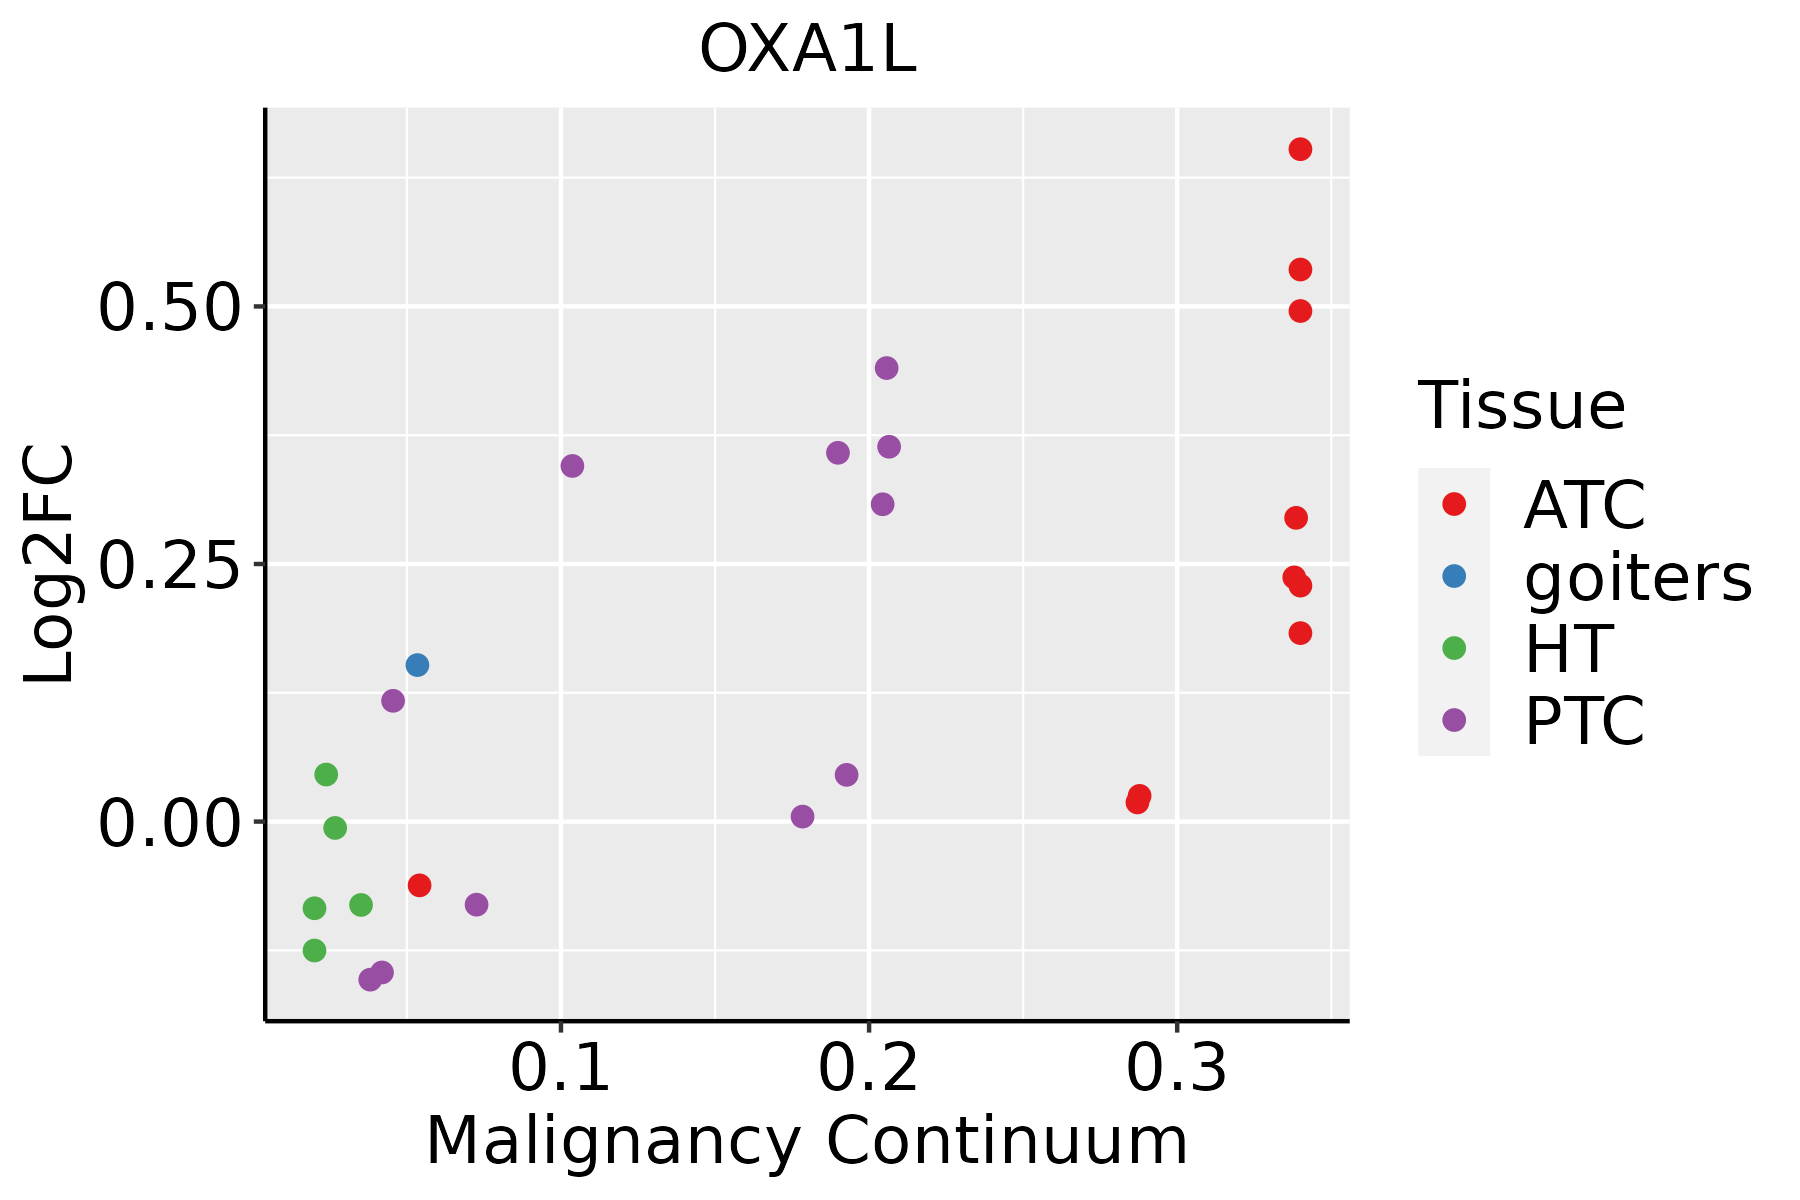 | ATC: Anaplastic thyroid cancer |
| HT: Hashimoto's thyroiditis | ||
| PTC: Papillary thyroid cancer |
| ∗log2FC in expression of this searched gene in stem-like cells from each diseased tissue sample relative to stem-like cells in normal samples in each tissue plotted against the malignancy continuum. Samples are colored based on if they are from different disease stage. |
Top |
Malignant transformation related pathway analysis |
| Find out the enriched GO biological processes and KEGG pathways involved in transition from healthy to precancer to cancer |
| Tissue | Disease Stage | Enriched GO biological Processes |
| Colorectum | AD |  |
| Colorectum | SER |  |
| Colorectum | MSS |  |
| Colorectum | MSI-H |  |
| Colorectum | FAP |  |
| ∗Top 15 enriched GO BP terms are showed in the bar plot of each disease state in each tissue. Each row represents a significant GO biological process which is colored according to the -log10(p.adjust). |
| Page: 1 2 3 4 5 6 7 8 9 |
| GO ID | Tissue | Disease Stage | Description | Gene Ratio | Bg Ratio | pvalue | p.adjust | Count |
| GO:00070063 | Colorectum | MSI-H | mitochondrial membrane organization | 18/1319 | 116/18723 | 1.24e-03 | 2.00e-02 | 18 |
| GO:00901503 | Colorectum | MSI-H | establishment of protein localization to membrane | 32/1319 | 260/18723 | 1.47e-03 | 2.23e-02 | 32 |
| GO:00901513 | Colorectum | MSI-H | establishment of protein localization to mitochondrial membrane | 7/1319 | 30/18723 | 4.10e-03 | 4.67e-02 | 7 |
| GO:000906020 | Esophagus | HGIN | aerobic respiration | 81/2587 | 189/18723 | 1.07e-22 | 9.26e-20 | 81 |
| GO:000609120 | Esophagus | HGIN | generation of precursor metabolites and energy | 145/2587 | 490/18723 | 3.41e-20 | 2.04e-17 | 145 |
| GO:004533320 | Esophagus | HGIN | cellular respiration | 86/2587 | 230/18723 | 2.41e-19 | 1.20e-16 | 86 |
| GO:001598020 | Esophagus | HGIN | energy derivation by oxidation of organic compounds | 105/2587 | 318/18723 | 1.16e-18 | 4.99e-16 | 105 |
| GO:003310820 | Esophagus | HGIN | mitochondrial respiratory chain complex assembly | 47/2587 | 93/18723 | 3.15e-17 | 8.60e-15 | 47 |
| GO:007259420 | Esophagus | HGIN | establishment of protein localization to organelle | 120/2587 | 422/18723 | 1.73e-15 | 4.00e-13 | 120 |
| GO:001025720 | Esophagus | HGIN | NADH dehydrogenase complex assembly | 31/2587 | 57/18723 | 5.89e-13 | 8.62e-11 | 31 |
| GO:003298120 | Esophagus | HGIN | mitochondrial respiratory chain complex I assembly | 31/2587 | 57/18723 | 5.89e-13 | 8.62e-11 | 31 |
| GO:000683920 | Esophagus | HGIN | mitochondrial transport | 74/2587 | 254/18723 | 1.32e-10 | 1.32e-08 | 74 |
| GO:007058520 | Esophagus | HGIN | protein localization to mitochondrion | 43/2587 | 125/18723 | 4.43e-09 | 3.03e-07 | 43 |
| GO:007265520 | Esophagus | HGIN | establishment of protein localization to mitochondrion | 41/2587 | 120/18723 | 1.26e-08 | 7.96e-07 | 41 |
| GO:009015020 | Esophagus | HGIN | establishment of protein localization to membrane | 67/2587 | 260/18723 | 1.96e-07 | 9.57e-06 | 67 |
| GO:00170044 | Esophagus | HGIN | cytochrome complex assembly | 18/2587 | 36/18723 | 2.39e-07 | 1.14e-05 | 18 |
| GO:000700618 | Esophagus | HGIN | mitochondrial membrane organization | 37/2587 | 116/18723 | 4.61e-07 | 2.07e-05 | 37 |
| GO:00336173 | Esophagus | HGIN | mitochondrial cytochrome c oxidase assembly | 13/2587 | 22/18723 | 9.51e-07 | 3.80e-05 | 13 |
| GO:00085353 | Esophagus | HGIN | respiratory chain complex IV assembly | 14/2587 | 26/18723 | 1.68e-06 | 6.29e-05 | 14 |
| GO:00512057 | Esophagus | HGIN | protein insertion into membrane | 21/2587 | 57/18723 | 1.16e-05 | 3.29e-04 | 21 |
| Page: 1 2 3 4 5 6 7 8 9 10 11 12 13 |
| Pathway ID | Tissue | Disease Stage | Description | Gene Ratio | Bg Ratio | pvalue | p.adjust | qvalue | Count |
| hsa03060 | Colorectum | AD | Protein export | 14/2092 | 23/8465 | 2.43e-04 | 1.90e-03 | 1.21e-03 | 14 |
| hsa030601 | Colorectum | AD | Protein export | 14/2092 | 23/8465 | 2.43e-04 | 1.90e-03 | 1.21e-03 | 14 |
| hsa030602 | Colorectum | MSS | Protein export | 15/1875 | 23/8465 | 1.13e-05 | 1.26e-04 | 7.71e-05 | 15 |
| hsa030603 | Colorectum | MSS | Protein export | 15/1875 | 23/8465 | 1.13e-05 | 1.26e-04 | 7.71e-05 | 15 |
| hsa030604 | Colorectum | MSI-H | Protein export | 11/797 | 23/8465 | 2.26e-06 | 3.65e-05 | 3.06e-05 | 11 |
| hsa030605 | Colorectum | MSI-H | Protein export | 11/797 | 23/8465 | 2.26e-06 | 3.65e-05 | 3.06e-05 | 11 |
| hsa0306020 | Esophagus | HGIN | Protein export | 13/1383 | 23/8465 | 1.27e-05 | 1.80e-04 | 1.43e-04 | 13 |
| hsa03060110 | Esophagus | HGIN | Protein export | 13/1383 | 23/8465 | 1.27e-05 | 1.80e-04 | 1.43e-04 | 13 |
| hsa0306026 | Esophagus | ESCC | Protein export | 22/4205 | 23/8465 | 2.43e-06 | 1.43e-05 | 7.32e-06 | 22 |
| hsa0306036 | Esophagus | ESCC | Protein export | 22/4205 | 23/8465 | 2.43e-06 | 1.43e-05 | 7.32e-06 | 22 |
| hsa030608 | Liver | Cirrhotic | Protein export | 20/2530 | 23/8465 | 2.00e-08 | 3.51e-07 | 2.17e-07 | 20 |
| hsa0306011 | Liver | Cirrhotic | Protein export | 20/2530 | 23/8465 | 2.00e-08 | 3.51e-07 | 2.17e-07 | 20 |
| hsa0306021 | Liver | HCC | Protein export | 21/4020 | 23/8465 | 1.20e-05 | 8.53e-05 | 4.74e-05 | 21 |
| hsa0306031 | Liver | HCC | Protein export | 21/4020 | 23/8465 | 1.20e-05 | 8.53e-05 | 4.74e-05 | 21 |
| hsa0306018 | Oral cavity | OSCC | Protein export | 21/3704 | 23/8465 | 2.42e-06 | 1.27e-05 | 6.45e-06 | 21 |
| hsa0306019 | Oral cavity | OSCC | Protein export | 21/3704 | 23/8465 | 2.42e-06 | 1.27e-05 | 6.45e-06 | 21 |
| hsa0306025 | Oral cavity | LP | Protein export | 21/2418 | 23/8465 | 4.72e-10 | 8.28e-09 | 5.34e-09 | 21 |
| hsa0306035 | Oral cavity | LP | Protein export | 21/2418 | 23/8465 | 4.72e-10 | 8.28e-09 | 5.34e-09 | 21 |
| Page: 1 |
Top |
Cell-cell communication analysis |
| Identification of potential cell-cell interactions between two cell types and their ligand-receptor pairs for different disease states |
| Ligand | Receptor | LRpair | Pathway | Tissue | Disease Stage |
| Page: 1 |
Top |
Single-cell gene regulatory network inference analysis |
| Find out the significant the regulons (TFs) and the target genes of each regulon across cell types for different disease states |
| TF | Cell Type | Tissue | Disease Stage | Target Gene | RSS | Regulon Activity |
| ∗The dot plots of a searched regulon are shown for all cell subpopulations in each disease state of each tissue based on the regulon specific score inferred using pySCENIC and by calculating the average expression. |
| Page: 1 |
Top |
Somatic mutation of malignant transformation related genes |
| Annotation of somatic variants for genes involved in malignant transformation |
| Hugo Symbol | Variant Class | Variant Classification | dbSNP RS | HGVSc | HGVSp | HGVSp Short | SWISSPROT | BIOTYPE | SIFT | PolyPhen | Tumor Sample Barcode | Tissue | Histology | Sex | Age | Stage | Therapy Types | Drugs | Outcome |
| OXA1L | insertion | In_Frame_Ins | novel | c.614_615insCTTTTACACGCTCAGGTCCACAGCGTCGCAGGGCCCTCGCAA | p.Ala205_Ala206insPheTyrThrLeuArgSerThrAlaSerGlnGlyProArgAsn | p.A205_A206insFYTLRSTASQGPRN | protein_coding | TCGA-A8-A095-01 | Breast | breast invasive carcinoma | Female | <65 | I/II | Chemotherapy | 5-fluorouracil | CR | |||
| OXA1L | insertion | Frame_Shift_Ins | novel | c.560_561insGCAAGTCCTCTTCCGGGCAAAATGGCGATGGGAC | p.Asn187LysfsTer20 | p.N187Kfs*20 | protein_coding | TCGA-AN-A04A-01 | Breast | breast invasive carcinoma | Female | <65 | III/IV | Unknown | Unknown | SD | |||
| OXA1L | SNV | Missense_Mutation | novel | c.350N>T | p.Ala117Val | p.A117V | protein_coding | tolerated(0.22) | benign(0.024) | TCGA-2W-A8YY-01 | Cervix | cervical & endocervical cancer | Female | <65 | I/II | Chemotherapy | cisplatin | CR | |
| OXA1L | SNV | Missense_Mutation | c.46N>T | p.Ala16Ser | p.A16S | protein_coding | tolerated_low_confidence(0.05) | benign(0.274) | TCGA-EX-A69L-01 | Cervix | cervical & endocervical cancer | Female | <65 | I/II | Unknown | Unknown | SD | ||
| OXA1L | SNV | Missense_Mutation | c.56G>C | p.Arg19Pro | p.R19P | protein_coding | tolerated_low_confidence(0.18) | benign(0) | TCGA-LP-A4AW-01 | Cervix | cervical & endocervical cancer | Female | <65 | I/II | Unknown | Unknown | SD | ||
| OXA1L | SNV | Missense_Mutation | c.46G>T | p.Ala16Ser | p.A16S | protein_coding | tolerated_low_confidence(0.05) | benign(0.274) | TCGA-AA-3715-01 | Colorectum | colon adenocarcinoma | Male | >=65 | I/II | Unknown | Unknown | PD | ||
| OXA1L | SNV | Missense_Mutation | rs754585288 | c.1474G>A | p.Asp492Asn | p.D492N | protein_coding | deleterious_low_confidence(0.02) | probably_damaging(0.999) | TCGA-AA-3947-01 | Colorectum | colon adenocarcinoma | Female | <65 | I/II | Unknown | Unknown | SD | |
| OXA1L | SNV | Missense_Mutation | c.1046N>G | p.Asp349Gly | p.D349G | protein_coding | tolerated(0.11) | possibly_damaging(0.879) | TCGA-AZ-6598-01 | Colorectum | colon adenocarcinoma | Female | >=65 | I/II | Unknown | Unknown | SD | ||
| OXA1L | SNV | Missense_Mutation | rs779321199 | c.1081C>T | p.Pro361Ser | p.P361S | protein_coding | deleterious(0.04) | probably_damaging(0.944) | TCGA-CA-6717-01 | Colorectum | colon adenocarcinoma | Male | <65 | I/II | Chemotherapy | oxaliplatin | CR | |
| OXA1L | SNV | Missense_Mutation | novel | c.728N>A | p.Ile243Asn | p.I243N | protein_coding | deleterious(0) | possibly_damaging(0.782) | TCGA-G4-6586-01 | Colorectum | colon adenocarcinoma | Female | >=65 | I/II | Unknown | Unknown | SD |
| Page: 1 2 3 4 |
Top |
Related drugs of malignant transformation related genes |
| Identification of chemicals and drugs interact with genes involved in malignant transfromation |
| (DGIdb 4.0) |
| Entrez ID | Symbol | Category | Interaction Types | Drug Claim Name | Drug Name | PMIDs |
| Page: 1 |

Copyright 2023-Present -The University of Texas Health Science Center at Houston |