| Tissue | Expression Dynamics | Abbreviation |
| Cervix | 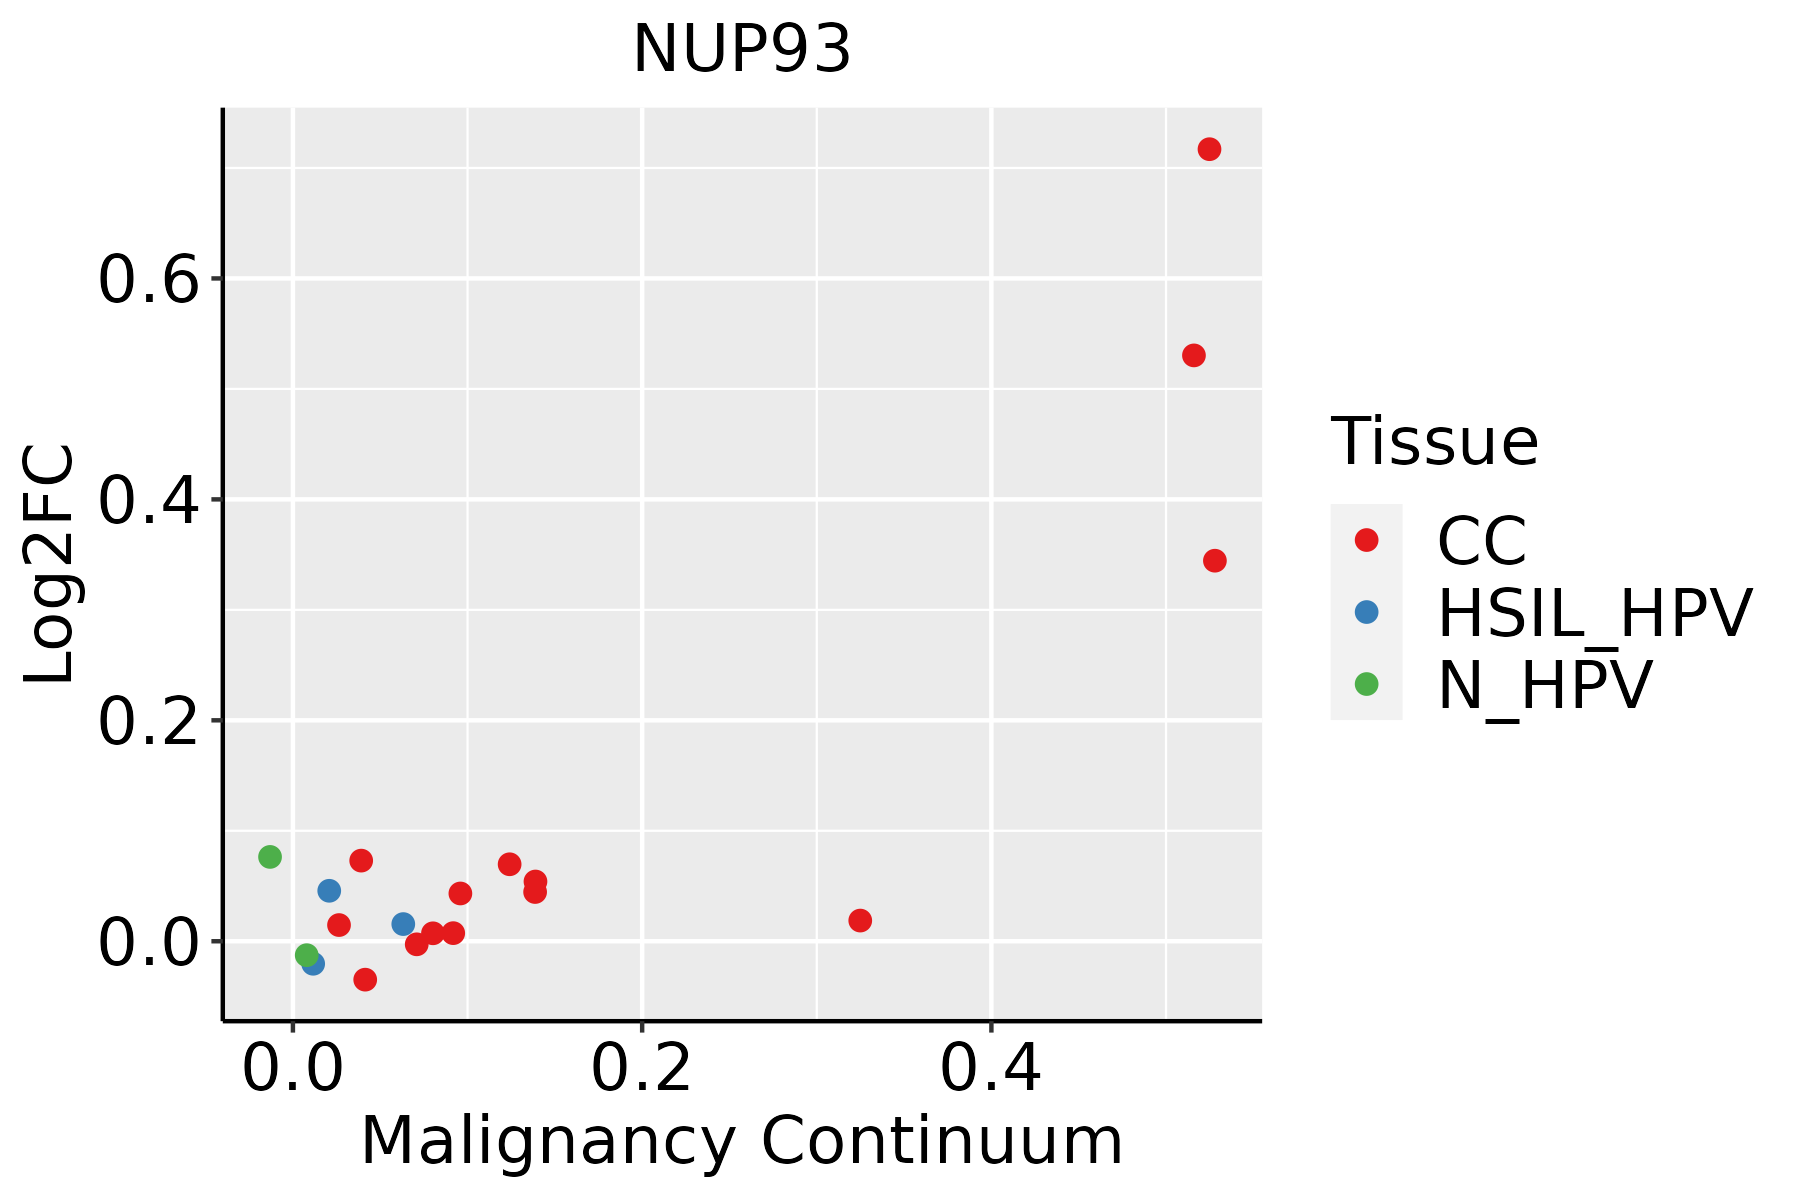 | CC: Cervix cancer |
| HSIL_HPV: HPV-infected high-grade squamous intraepithelial lesions |
| N_HPV: HPV-infected normal cervix |
| Esophagus | 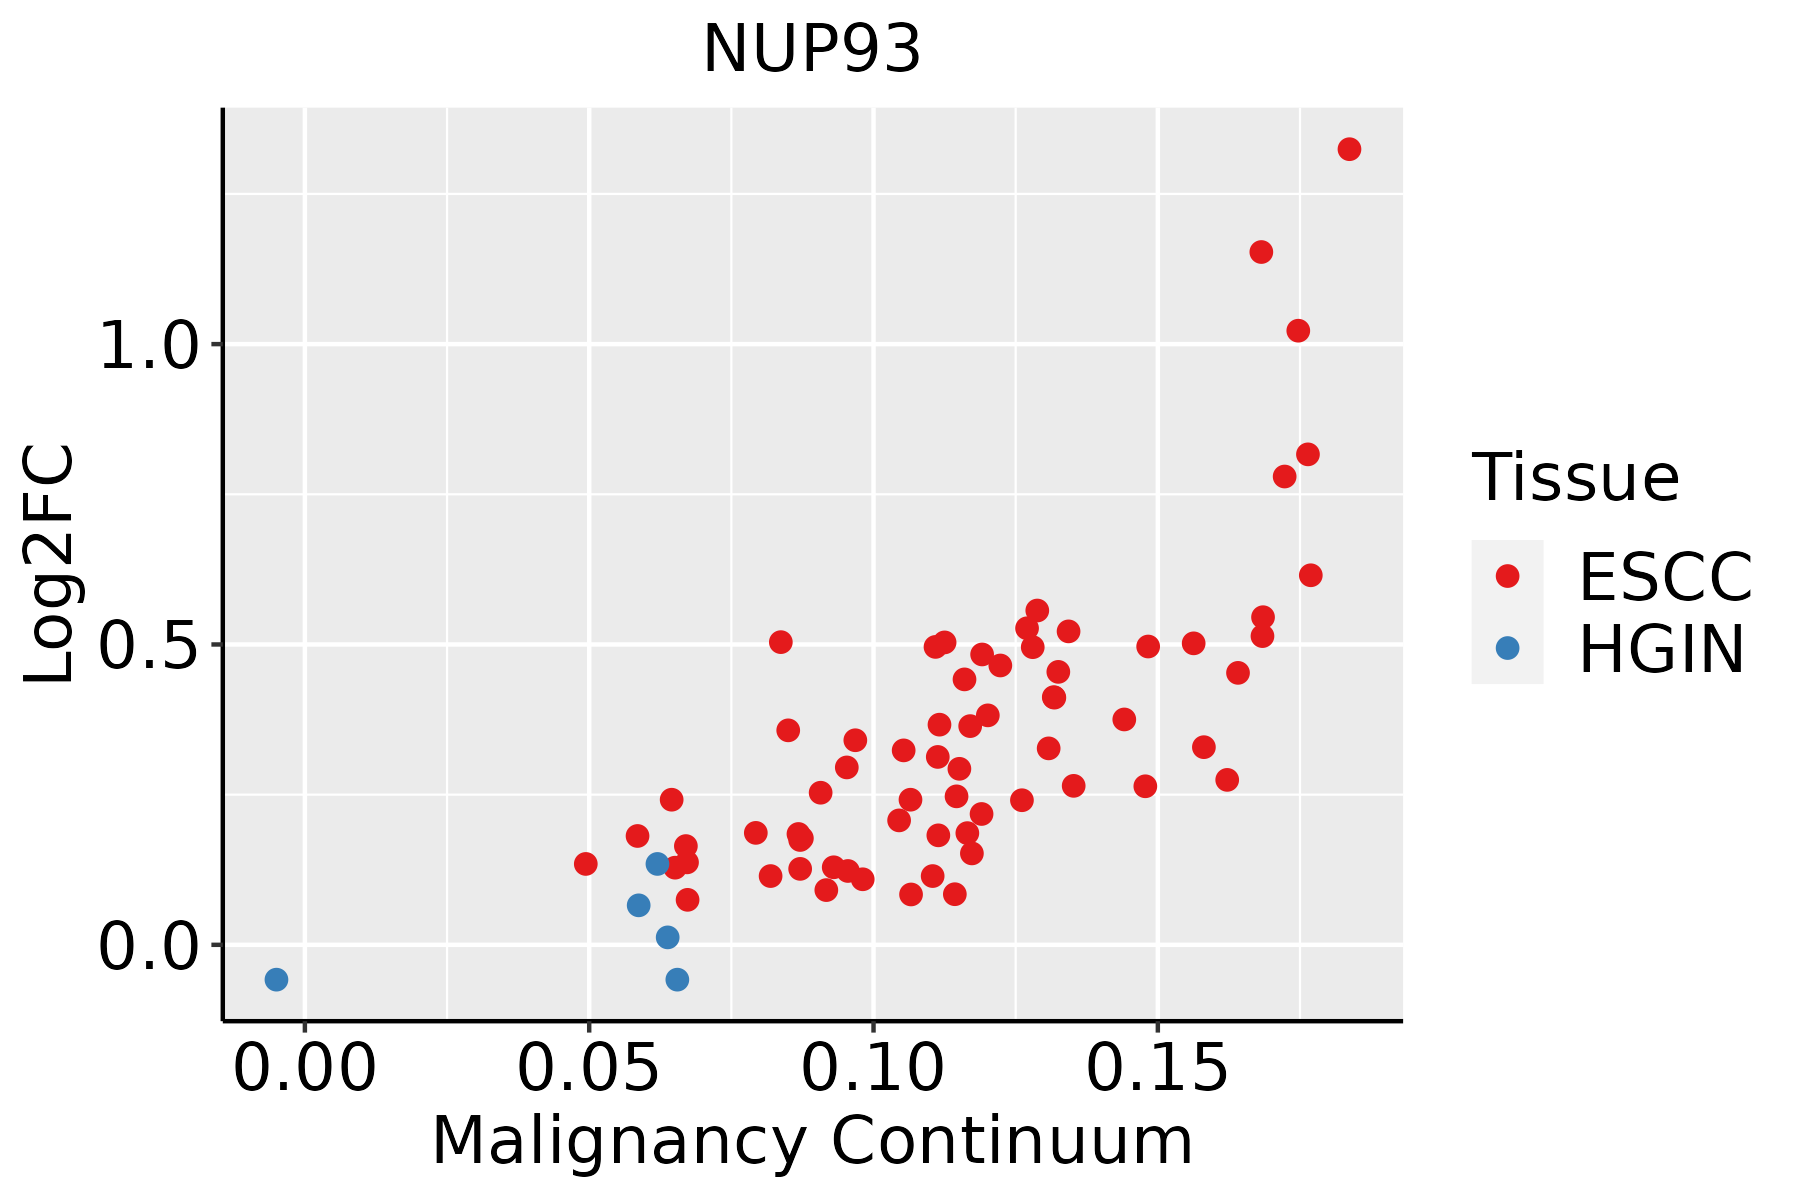 | ESCC: Esophageal squamous cell carcinoma |
| HGIN: High-grade intraepithelial neoplasias |
| LGIN: Low-grade intraepithelial neoplasias |
| Oral Cavity | 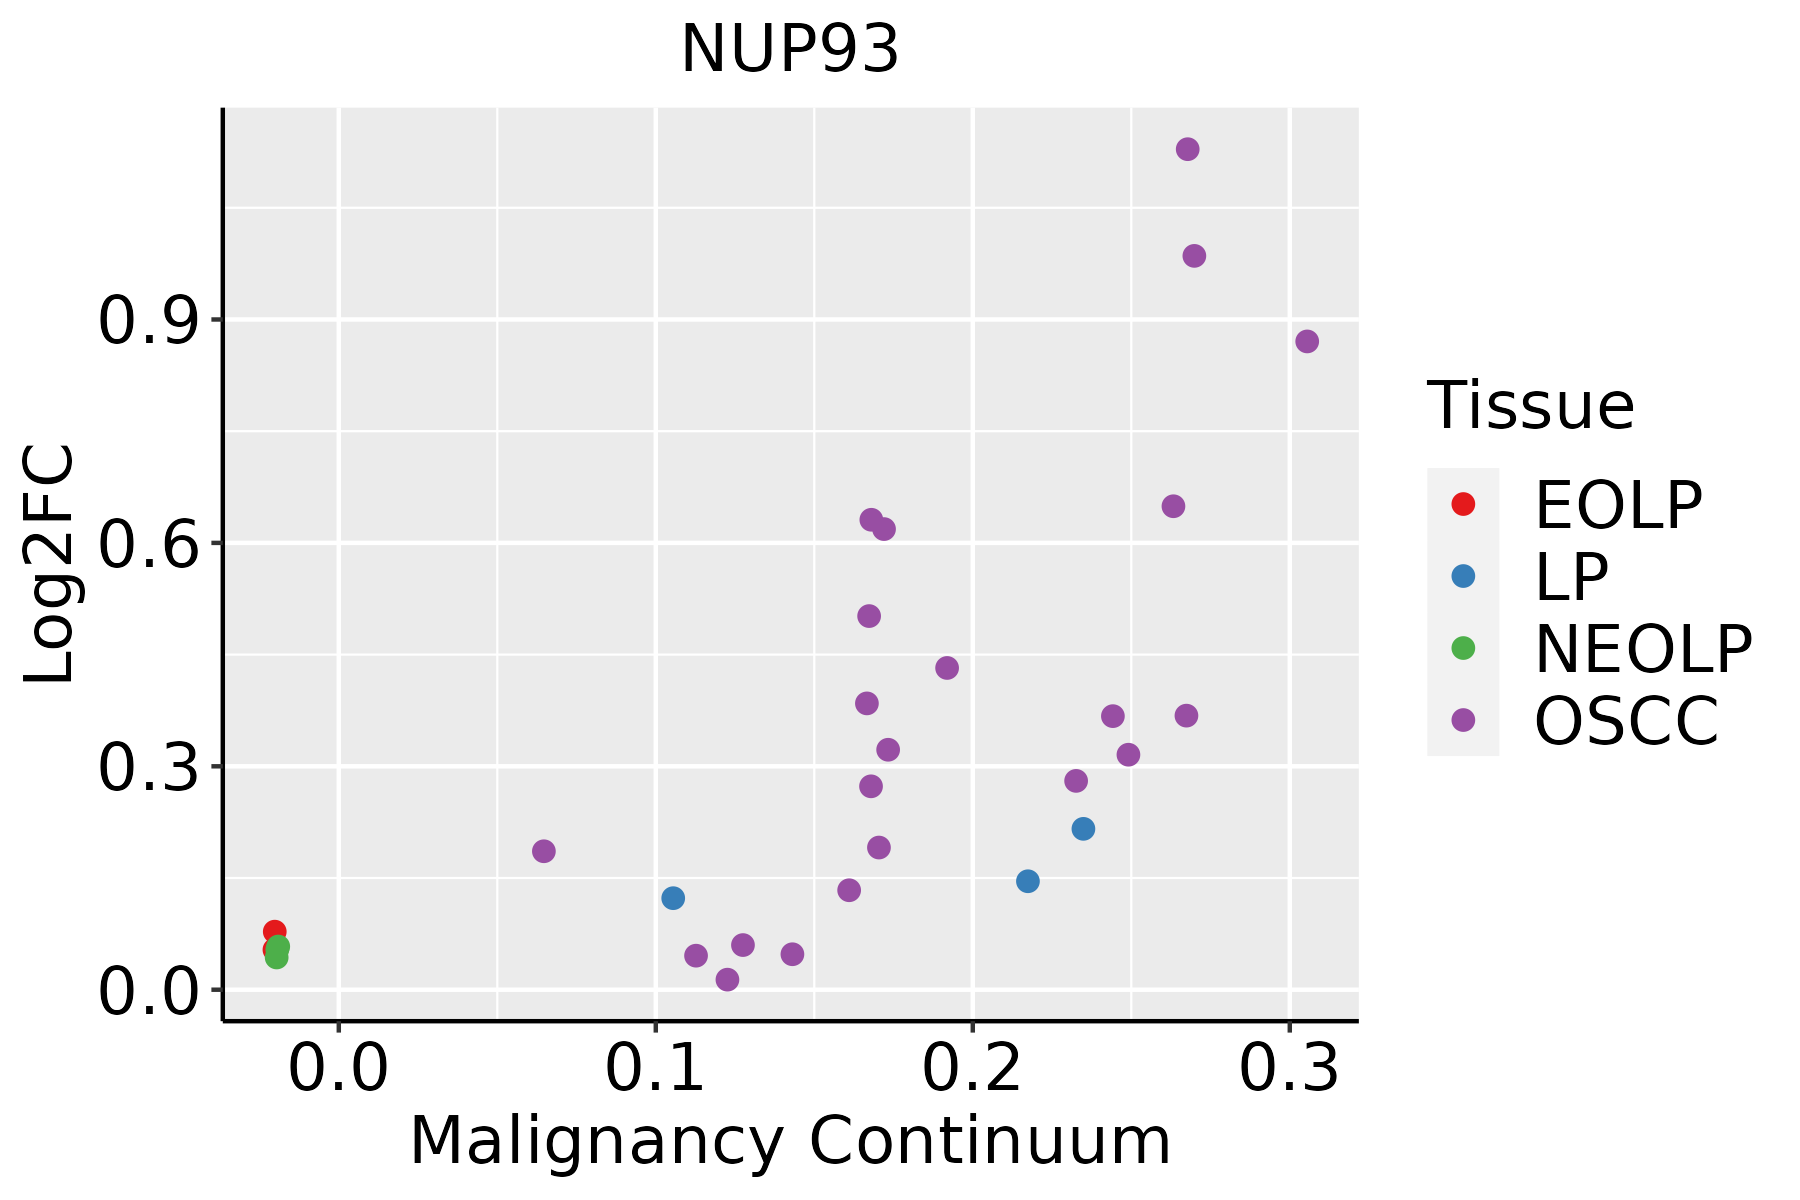 | EOLP: Erosive Oral lichen planus |
| LP: leukoplakia |
| NEOLP: Non-erosive oral lichen planus |
| OSCC: Oral squamous cell carcinoma |
| Skin | 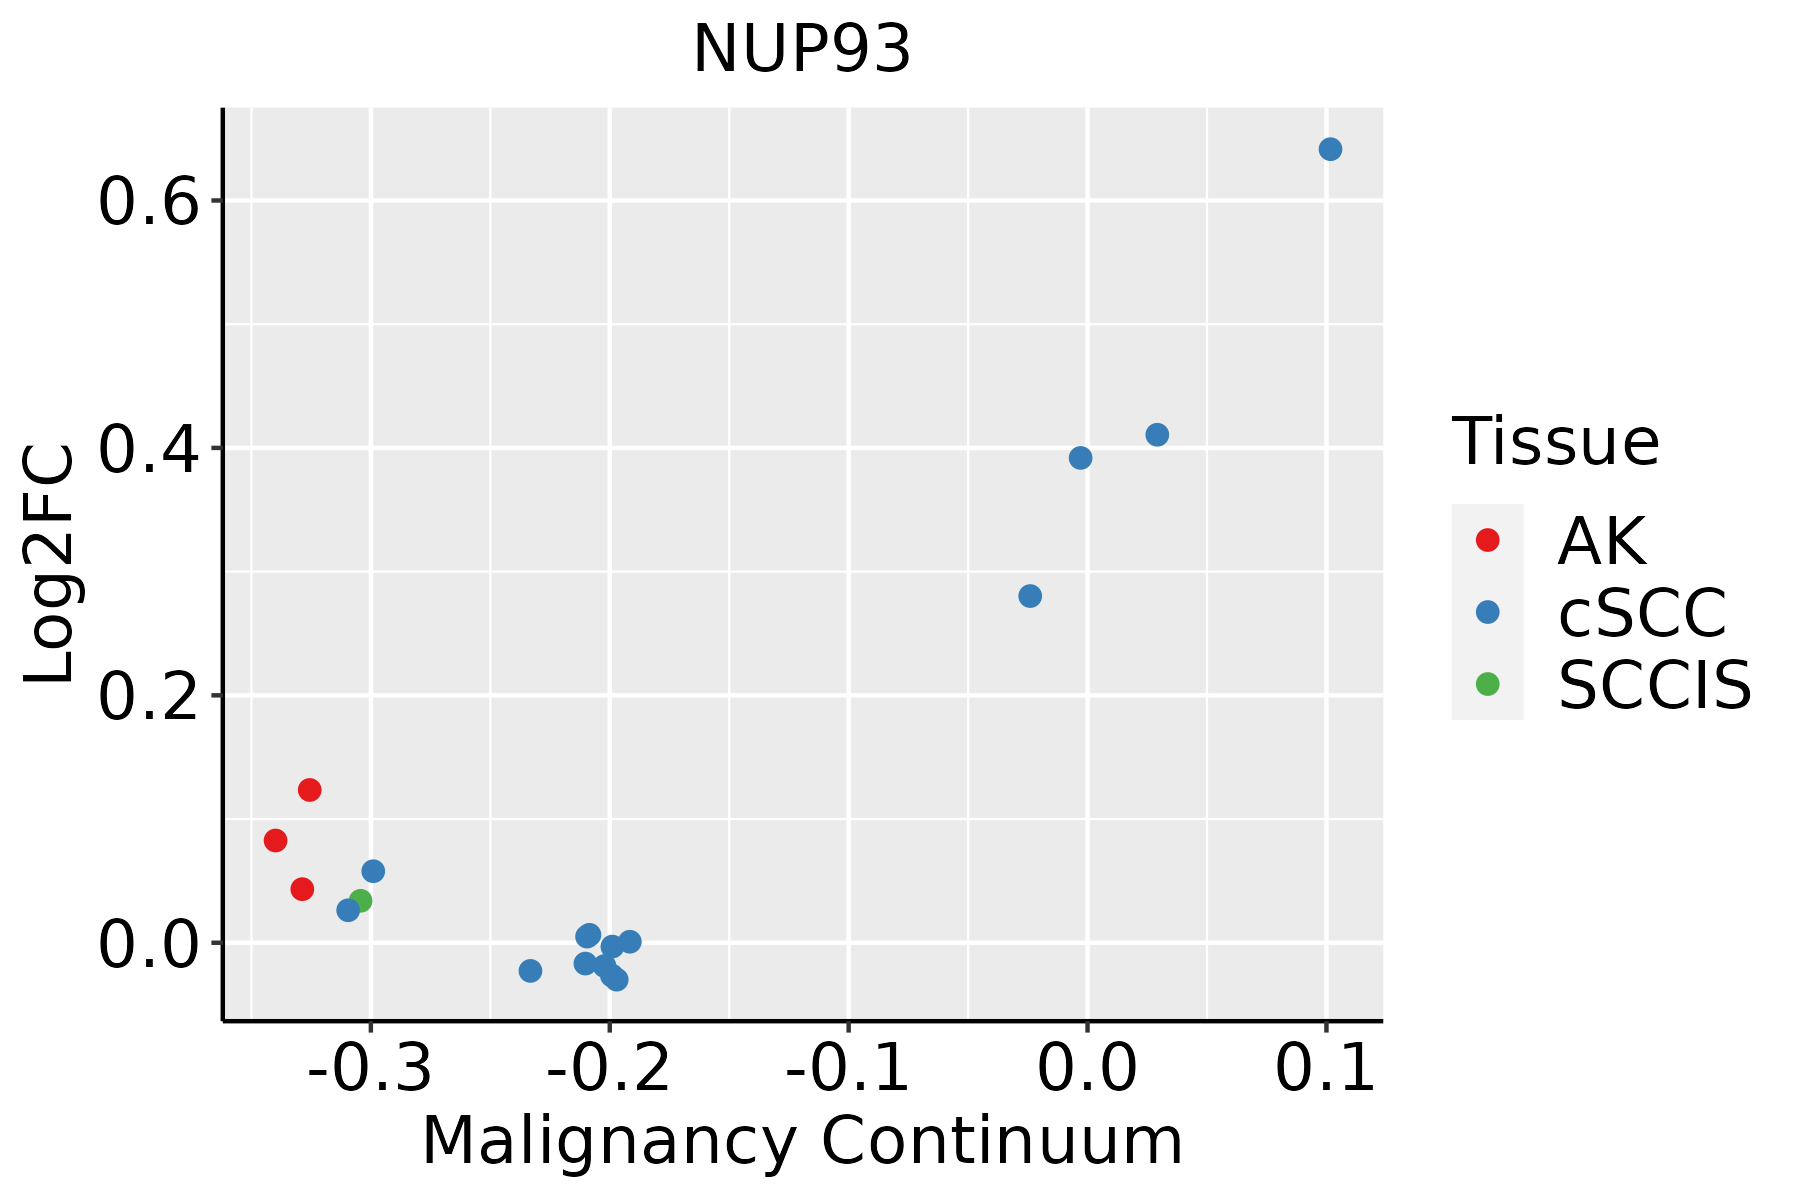 | AK: Actinic keratosis |
| cSCC: Cutaneous squamous cell carcinoma |
| SCCIS:squamous cell carcinoma in situ |
| GO ID | Tissue | Disease Stage | Description | Gene Ratio | Bg Ratio | pvalue | p.adjust | Count |
| GO:00511709 | Oral cavity | OSCC | import into nucleus | 100/7305 | 159/18723 | 8.67e-10 | 2.15e-08 | 100 |
| GO:00066069 | Oral cavity | OSCC | protein import into nucleus | 97/7305 | 155/18723 | 2.27e-09 | 5.30e-08 | 97 |
| GO:00069974 | Oral cavity | OSCC | nucleus organization | 85/7305 | 133/18723 | 5.12e-09 | 1.12e-07 | 85 |
| GO:00064063 | Oral cavity | OSCC | mRNA export from nucleus | 45/7305 | 59/18723 | 6.19e-09 | 1.31e-07 | 45 |
| GO:00714273 | Oral cavity | OSCC | mRNA-containing ribonucleoprotein complex export from nucleus | 45/7305 | 59/18723 | 6.19e-09 | 1.31e-07 | 45 |
| GO:00069982 | Oral cavity | OSCC | nuclear envelope organization | 37/7305 | 47/18723 | 3.19e-08 | 6.12e-07 | 37 |
| GO:00315034 | Oral cavity | OSCC | protein-containing complex localization | 123/7305 | 220/18723 | 2.54e-07 | 4.00e-06 | 123 |
| GO:00069993 | Oral cavity | OSCC | nuclear pore organization | 12/7305 | 14/18723 | 4.62e-04 | 2.76e-03 | 12 |
| GO:00469315 | Oral cavity | OSCC | pore complex assembly | 15/7305 | 20/18723 | 1.19e-03 | 5.99e-03 | 15 |
| GO:00071789 | Oral cavity | OSCC | transmembrane receptor protein serine/threonine kinase signaling pathway | 165/7305 | 355/18723 | 2.31e-03 | 1.02e-02 | 165 |
| GO:007259427 | Skin | cSCC | establishment of protein localization to organelle | 213/4864 | 422/18723 | 1.40e-27 | 5.15e-25 | 213 |
| GO:000691324 | Skin | cSCC | nucleocytoplasmic transport | 162/4864 | 301/18723 | 4.20e-25 | 1.10e-22 | 162 |
| GO:005116924 | Skin | cSCC | nuclear transport | 162/4864 | 301/18723 | 4.20e-25 | 1.10e-22 | 162 |
| GO:0006403111 | Skin | cSCC | RNA localization | 120/4864 | 201/18723 | 4.17e-24 | 1.01e-21 | 120 |
| GO:0051168111 | Skin | cSCC | nuclear export | 91/4864 | 154/18723 | 3.33e-18 | 4.18e-16 | 91 |
| GO:0034504110 | Skin | cSCC | protein localization to nucleus | 143/4864 | 290/18723 | 8.98e-18 | 1.02e-15 | 143 |
| GO:005065719 | Skin | cSCC | nucleic acid transport | 92/4864 | 163/18723 | 1.35e-16 | 1.33e-14 | 92 |
| GO:005065819 | Skin | cSCC | RNA transport | 92/4864 | 163/18723 | 1.35e-16 | 1.33e-14 | 92 |
| GO:005123619 | Skin | cSCC | establishment of RNA localization | 93/4864 | 166/18723 | 1.78e-16 | 1.69e-14 | 93 |
| GO:005102816 | Skin | cSCC | mRNA transport | 77/4864 | 130/18723 | 1.06e-15 | 8.95e-14 | 77 |
| Pathway ID | Tissue | Disease Stage | Description | Gene Ratio | Bg Ratio | pvalue | p.adjust | qvalue | Count |
| hsa0501418 | Cervix | CC | Amyotrophic lateral sclerosis | 103/1267 | 364/8465 | 1.79e-11 | 4.47e-10 | 2.64e-10 | 103 |
| hsa0501419 | Cervix | CC | Amyotrophic lateral sclerosis | 103/1267 | 364/8465 | 1.79e-11 | 4.47e-10 | 2.64e-10 | 103 |
| hsa05014210 | Esophagus | ESCC | Amyotrophic lateral sclerosis | 266/4205 | 364/8465 | 1.31e-20 | 2.20e-18 | 1.13e-18 | 266 |
| hsa0301321 | Esophagus | ESCC | Nucleocytoplasmic transport | 89/4205 | 108/8465 | 1.20e-12 | 2.37e-11 | 1.21e-11 | 89 |
| hsa0501438 | Esophagus | ESCC | Amyotrophic lateral sclerosis | 266/4205 | 364/8465 | 1.31e-20 | 2.20e-18 | 1.13e-18 | 266 |
| hsa0301331 | Esophagus | ESCC | Nucleocytoplasmic transport | 89/4205 | 108/8465 | 1.20e-12 | 2.37e-11 | 1.21e-11 | 89 |
| hsa0501428 | Oral cavity | OSCC | Amyotrophic lateral sclerosis | 246/3704 | 364/8465 | 6.65e-21 | 1.11e-18 | 5.67e-19 | 246 |
| hsa030136 | Oral cavity | OSCC | Nucleocytoplasmic transport | 82/3704 | 108/8465 | 7.93e-12 | 1.33e-10 | 6.77e-11 | 82 |
| hsa05014112 | Oral cavity | OSCC | Amyotrophic lateral sclerosis | 246/3704 | 364/8465 | 6.65e-21 | 1.11e-18 | 5.67e-19 | 246 |
| hsa0301311 | Oral cavity | OSCC | Nucleocytoplasmic transport | 82/3704 | 108/8465 | 7.93e-12 | 1.33e-10 | 6.77e-11 | 82 |
| Hugo Symbol | Variant Class | Variant Classification | dbSNP RS | HGVSc | HGVSp | HGVSp Short | SWISSPROT | BIOTYPE | SIFT | PolyPhen | Tumor Sample Barcode | Tissue | Histology | Sex | Age | Stage | Therapy Types | Drugs | Outcome |
| NUP93 | SNV | Missense_Mutation | rs371707121 | c.1609N>T | p.Arg537Trp | p.R537W | Q8N1F7 | protein_coding | deleterious(0) | probably_damaging(0.991) | TCGA-A7-A6VV-01 | Breast | breast invasive carcinoma | Female | <65 | I/II | Chemotherapy | cyclophosphamide | CR |
| NUP93 | SNV | Missense_Mutation | rs528073782 | c.40G>A | p.Glu14Lys | p.E14K | Q8N1F7 | protein_coding | deleterious(0.05) | benign(0.013) | TCGA-BH-A209-01 | Breast | breast invasive carcinoma | Female | >=65 | I/II | Unknown | Unknown | SD |
| NUP93 | SNV | Missense_Mutation | rs528073782 | c.40N>A | p.Glu14Lys | p.E14K | Q8N1F7 | protein_coding | deleterious(0.05) | benign(0.013) | TCGA-BH-A2L8-01 | Breast | breast invasive carcinoma | Female | <65 | I/II | Chemotherapy | cytoxan | CR |
| NUP93 | SNV | Missense_Mutation | rs528073782 | c.40G>A | p.Glu14Lys | p.E14K | Q8N1F7 | protein_coding | deleterious(0.05) | benign(0.013) | TCGA-E2-A10C-01 | Breast | breast invasive carcinoma | Female | <65 | I/II | Chemotherapy | cytoxan | SD |
| NUP93 | SNV | Missense_Mutation | rs528073782 | c.40G>A | p.Glu14Lys | p.E14K | Q8N1F7 | protein_coding | deleterious(0.05) | benign(0.013) | TCGA-E9-A1NC-01 | Breast | breast invasive carcinoma | Female | <65 | I/II | Chemotherapy | doxorubicin | CR |
| NUP93 | insertion | Nonsense_Mutation | novel | c.195_196insGCAACAGAGCAAGACCCTGTCTGAAAATAAAATAAAATAGAC | p.Gly65_Ser66insAlaThrGluGlnAspProValTerLysTerAsnLysIleAsp | p.G65_S66insATEQDPV*K*NKID | Q8N1F7 | protein_coding | | | TCGA-A8-A08H-01 | Breast | breast invasive carcinoma | Female | >=65 | I/II | Unknown | Unknown | SD |
| NUP93 | deletion | Frame_Shift_Del | novel | c.1390delC | p.Gln464LysfsTer5 | p.Q464Kfs*5 | Q8N1F7 | protein_coding | | | TCGA-D8-A27V-01 | Breast | breast invasive carcinoma | Female | <65 | I/II | Hormone Therapy | tamoxiphen | SD |
| NUP93 | SNV | Missense_Mutation | novel | c.773C>T | p.Ala258Val | p.A258V | Q8N1F7 | protein_coding | deleterious(0.01) | possibly_damaging(0.78) | TCGA-2W-A8YY-01 | Cervix | cervical & endocervical cancer | Female | <65 | I/II | Chemotherapy | cisplatin | CR |
| NUP93 | SNV | Missense_Mutation | novel | c.1600C>A | p.Leu534Met | p.L534M | Q8N1F7 | protein_coding | tolerated(0.25) | benign(0.123) | TCGA-2W-A8YY-01 | Cervix | cervical & endocervical cancer | Female | <65 | I/II | Chemotherapy | cisplatin | CR |
| NUP93 | SNV | Missense_Mutation | rs145578512 | c.1000N>A | p.Ala334Thr | p.A334T | Q8N1F7 | protein_coding | deleterious(0.05) | probably_damaging(0.94) | TCGA-C5-A1MH-01 | Cervix | cervical & endocervical cancer | Female | >=65 | III/IV | Chemotherapy | cisplatin | PD |


