
|
|||||
|
 | |
| |
| |
| |
| |
| |
|
Gene: NUP35 |
Gene summary for NUP35 |
| Gene information | Species | Human | Gene symbol | NUP35 | Gene ID | 129401 |
| Gene name | nucleoporin 35 | |
| Gene Alias | MP-44 | |
| Cytomap | 2q32.1 | |
| Gene Type | protein-coding | GO ID | GO:0006139 | UniProtAcc | Q8NFH5 |
Top |
Malignant transformation analysis |
| Identification of the aberrant gene expression in precancerous and cancerous lesions by comparing the gene expression of stem-like cells in diseased tissues with normal stem cells |
| Entrez ID | Symbol | Replicates | Species | Organ | Tissue | Adj P-value | Log2FC | Malignancy |
| 129401 | NUP35 | LZE4T | Human | Esophagus | ESCC | 1.27e-03 | 2.72e-02 | 0.0811 |
| 129401 | NUP35 | LZE8T | Human | Esophagus | ESCC | 3.34e-04 | 7.43e-02 | 0.067 |
| 129401 | NUP35 | LZE24T | Human | Esophagus | ESCC | 2.55e-02 | 8.76e-02 | 0.0596 |
| 129401 | NUP35 | P2T-E | Human | Esophagus | ESCC | 6.10e-20 | 2.68e-01 | 0.1177 |
| 129401 | NUP35 | P4T-E | Human | Esophagus | ESCC | 3.35e-16 | 4.14e-01 | 0.1323 |
| 129401 | NUP35 | P5T-E | Human | Esophagus | ESCC | 3.41e-11 | 1.87e-01 | 0.1327 |
| 129401 | NUP35 | P8T-E | Human | Esophagus | ESCC | 2.01e-16 | 1.99e-01 | 0.0889 |
| 129401 | NUP35 | P9T-E | Human | Esophagus | ESCC | 3.68e-06 | 3.82e-02 | 0.1131 |
| 129401 | NUP35 | P10T-E | Human | Esophagus | ESCC | 6.37e-10 | 1.85e-01 | 0.116 |
| 129401 | NUP35 | P11T-E | Human | Esophagus | ESCC | 1.93e-02 | 1.33e-01 | 0.1426 |
| 129401 | NUP35 | P12T-E | Human | Esophagus | ESCC | 5.83e-19 | 3.94e-01 | 0.1122 |
| 129401 | NUP35 | P15T-E | Human | Esophagus | ESCC | 8.53e-19 | 3.86e-01 | 0.1149 |
| 129401 | NUP35 | P16T-E | Human | Esophagus | ESCC | 2.00e-14 | 1.99e-01 | 0.1153 |
| 129401 | NUP35 | P17T-E | Human | Esophagus | ESCC | 6.60e-03 | 1.18e-01 | 0.1278 |
| 129401 | NUP35 | P20T-E | Human | Esophagus | ESCC | 3.04e-16 | 1.69e-01 | 0.1124 |
| 129401 | NUP35 | P21T-E | Human | Esophagus | ESCC | 4.99e-09 | 1.29e-01 | 0.1617 |
| 129401 | NUP35 | P22T-E | Human | Esophagus | ESCC | 3.84e-07 | 5.31e-02 | 0.1236 |
| 129401 | NUP35 | P23T-E | Human | Esophagus | ESCC | 1.39e-12 | 3.03e-01 | 0.108 |
| 129401 | NUP35 | P24T-E | Human | Esophagus | ESCC | 1.17e-16 | 1.07e-01 | 0.1287 |
| 129401 | NUP35 | P26T-E | Human | Esophagus | ESCC | 2.76e-11 | 1.93e-01 | 0.1276 |
| Page: 1 2 3 4 |
| Tissue | Expression Dynamics | Abbreviation |
| Esophagus | 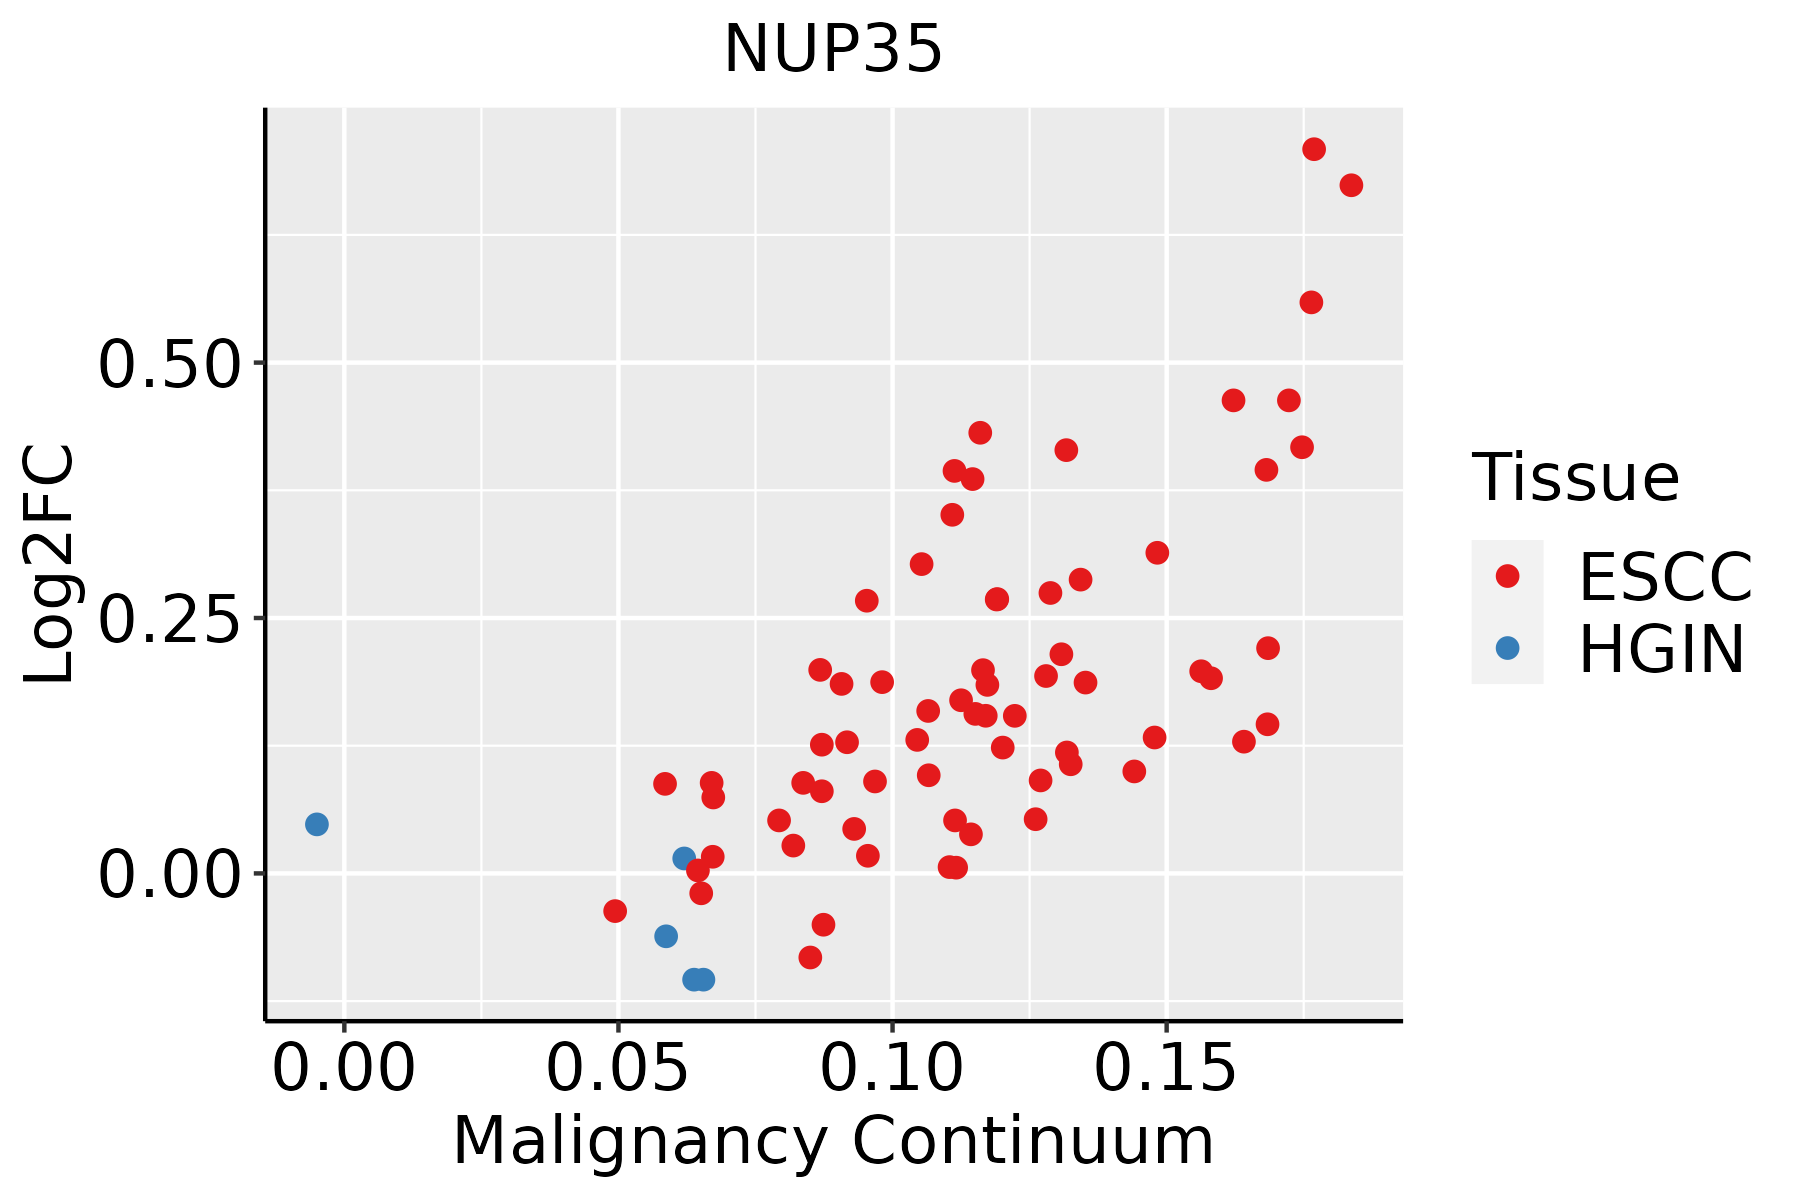 | ESCC: Esophageal squamous cell carcinoma |
| HGIN: High-grade intraepithelial neoplasias | ||
| LGIN: Low-grade intraepithelial neoplasias | ||
| Oral Cavity |  | EOLP: Erosive Oral lichen planus |
| LP: leukoplakia | ||
| NEOLP: Non-erosive oral lichen planus | ||
| OSCC: Oral squamous cell carcinoma | ||
| Skin | 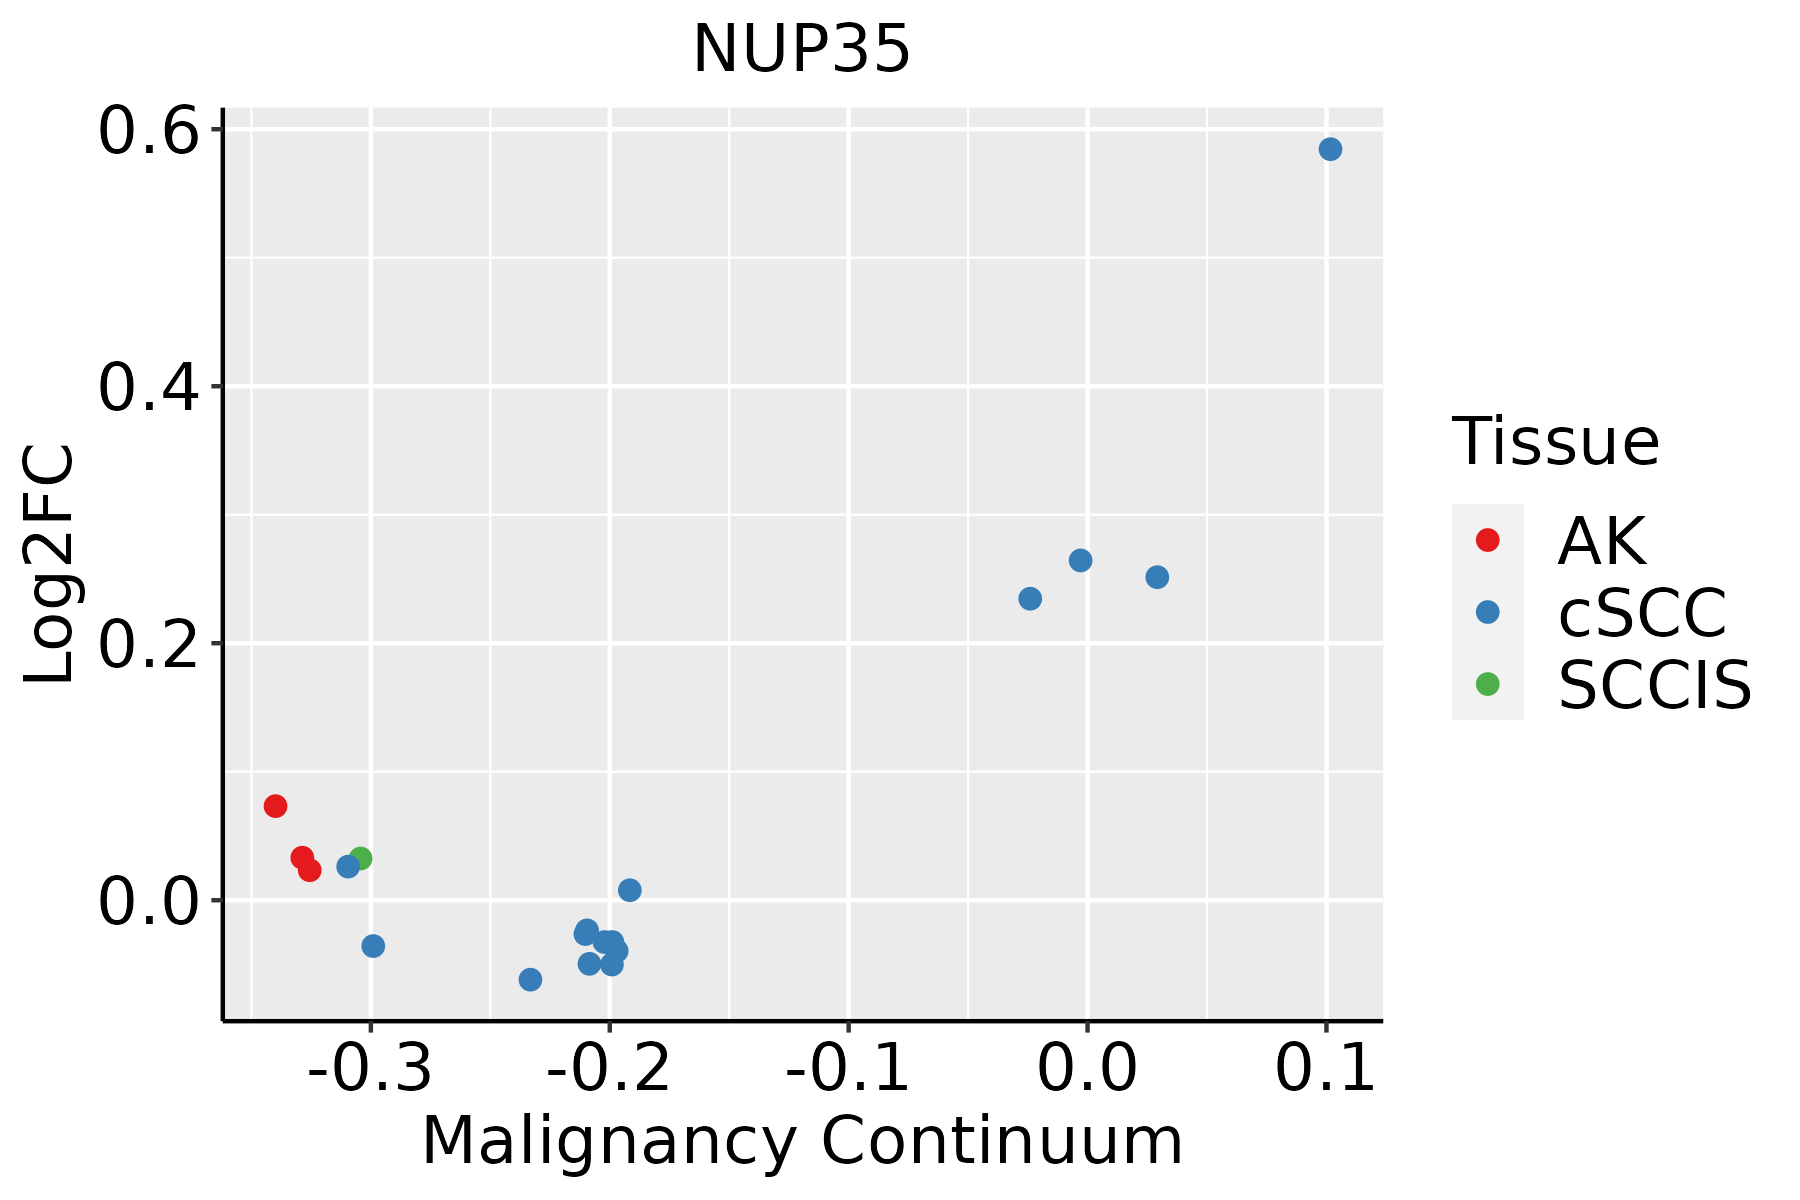 | AK: Actinic keratosis |
| cSCC: Cutaneous squamous cell carcinoma | ||
| SCCIS:squamous cell carcinoma in situ |
| ∗log2FC in expression of this searched gene in stem-like cells from each diseased tissue sample relative to stem-like cells in normal samples in each tissue plotted against the malignancy continuum. Samples are colored based on if they are from different disease stage. |
Top |
Malignant transformation related pathway analysis |
| Find out the enriched GO biological processes and KEGG pathways involved in transition from healthy to precancer to cancer |
| Tissue | Disease Stage | Enriched GO biological Processes |
| Colorectum | AD |  |
| Colorectum | SER |  |
| Colorectum | MSS |  |
| Colorectum | MSI-H |  |
| Colorectum | FAP |  |
| ∗Top 15 enriched GO BP terms are showed in the bar plot of each disease state in each tissue. Each row represents a significant GO biological process which is colored according to the -log10(p.adjust). |
| Page: 1 2 3 4 5 6 7 8 9 |
| GO ID | Tissue | Disease Stage | Description | Gene Ratio | Bg Ratio | pvalue | p.adjust | Count |
| GO:000660615 | Skin | cSCC | protein import into nucleus | 73/4864 | 155/18723 | 1.13e-08 | 3.48e-07 | 73 |
| GO:00069976 | Skin | cSCC | nucleus organization | 62/4864 | 133/18723 | 2.21e-07 | 4.72e-06 | 62 |
| GO:199082317 | Skin | cSCC | response to leukemia inhibitory factor | 42/4864 | 95/18723 | 8.79e-05 | 8.27e-04 | 42 |
| GO:199083016 | Skin | cSCC | cellular response to leukemia inhibitory factor | 41/4864 | 94/18723 | 1.53e-04 | 1.35e-03 | 41 |
| Page: 1 2 3 4 |
| Pathway ID | Tissue | Disease Stage | Description | Gene Ratio | Bg Ratio | pvalue | p.adjust | qvalue | Count |
| hsa05014210 | Esophagus | ESCC | Amyotrophic lateral sclerosis | 266/4205 | 364/8465 | 1.31e-20 | 2.20e-18 | 1.13e-18 | 266 |
| hsa0301321 | Esophagus | ESCC | Nucleocytoplasmic transport | 89/4205 | 108/8465 | 1.20e-12 | 2.37e-11 | 1.21e-11 | 89 |
| hsa0501438 | Esophagus | ESCC | Amyotrophic lateral sclerosis | 266/4205 | 364/8465 | 1.31e-20 | 2.20e-18 | 1.13e-18 | 266 |
| hsa0301331 | Esophagus | ESCC | Nucleocytoplasmic transport | 89/4205 | 108/8465 | 1.20e-12 | 2.37e-11 | 1.21e-11 | 89 |
| hsa0501428 | Oral cavity | OSCC | Amyotrophic lateral sclerosis | 246/3704 | 364/8465 | 6.65e-21 | 1.11e-18 | 5.67e-19 | 246 |
| hsa030136 | Oral cavity | OSCC | Nucleocytoplasmic transport | 82/3704 | 108/8465 | 7.93e-12 | 1.33e-10 | 6.77e-11 | 82 |
| hsa05014112 | Oral cavity | OSCC | Amyotrophic lateral sclerosis | 246/3704 | 364/8465 | 6.65e-21 | 1.11e-18 | 5.67e-19 | 246 |
| hsa0301311 | Oral cavity | OSCC | Nucleocytoplasmic transport | 82/3704 | 108/8465 | 7.93e-12 | 1.33e-10 | 6.77e-11 | 82 |
| hsa0501429 | Oral cavity | LP | Amyotrophic lateral sclerosis | 197/2418 | 364/8465 | 1.25e-25 | 1.39e-23 | 8.93e-24 | 197 |
| hsa030132 | Oral cavity | LP | Nucleocytoplasmic transport | 53/2418 | 108/8465 | 4.68e-06 | 4.10e-05 | 2.64e-05 | 53 |
| hsa0501437 | Oral cavity | LP | Amyotrophic lateral sclerosis | 197/2418 | 364/8465 | 1.25e-25 | 1.39e-23 | 8.93e-24 | 197 |
| hsa030133 | Oral cavity | LP | Nucleocytoplasmic transport | 53/2418 | 108/8465 | 4.68e-06 | 4.10e-05 | 2.64e-05 | 53 |
| Page: 1 |
Top |
Cell-cell communication analysis |
| Identification of potential cell-cell interactions between two cell types and their ligand-receptor pairs for different disease states |
| Ligand | Receptor | LRpair | Pathway | Tissue | Disease Stage |
| Page: 1 |
Top |
Single-cell gene regulatory network inference analysis |
| Find out the significant the regulons (TFs) and the target genes of each regulon across cell types for different disease states |
| TF | Cell Type | Tissue | Disease Stage | Target Gene | RSS | Regulon Activity |
| ∗The dot plots of a searched regulon are shown for all cell subpopulations in each disease state of each tissue based on the regulon specific score inferred using pySCENIC and by calculating the average expression. |
| Page: 1 |
Top |
Somatic mutation of malignant transformation related genes |
| Annotation of somatic variants for genes involved in malignant transformation |
| Hugo Symbol | Variant Class | Variant Classification | dbSNP RS | HGVSc | HGVSp | HGVSp Short | SWISSPROT | BIOTYPE | SIFT | PolyPhen | Tumor Sample Barcode | Tissue | Histology | Sex | Age | Stage | Therapy Types | Drugs | Outcome |
| NUP35 | SNV | Missense_Mutation | c.542N>G | p.Phe181Cys | p.F181C | Q8NFH5 | protein_coding | deleterious(0) | probably_damaging(1) | TCGA-A2-A04U-01 | Breast | breast invasive carcinoma | Female | <65 | I/II | Chemotherapy | adriamycin | SD | |
| NUP35 | SNV | Missense_Mutation | c.614N>A | p.Ser205Tyr | p.S205Y | Q8NFH5 | protein_coding | deleterious(0.02) | possibly_damaging(0.775) | TCGA-BH-A201-01 | Breast | breast invasive carcinoma | Female | <65 | I/II | Unknown | Unknown | SD | |
| NUP35 | SNV | Missense_Mutation | novel | c.514G>A | p.Asp172Asn | p.D172N | Q8NFH5 | protein_coding | deleterious(0.04) | benign(0.086) | TCGA-2W-A8YY-01 | Cervix | cervical & endocervical cancer | Female | <65 | I/II | Chemotherapy | cisplatin | CR |
| NUP35 | SNV | Missense_Mutation | rs763888991 | c.262N>A | p.Ala88Thr | p.A88T | Q8NFH5 | protein_coding | deleterious(0) | probably_damaging(0.922) | TCGA-EA-A410-01 | Cervix | cervical & endocervical cancer | Female | <65 | I/II | Unknown | Unknown | SD |
| NUP35 | deletion | Frame_Shift_Del | c.927delN | p.Asp312MetfsTer26 | p.D312Mfs*26 | Q8NFH5 | protein_coding | TCGA-A6-6653-01 | Colorectum | colon adenocarcinoma | Male | >=65 | I/II | Unknown | Unknown | SD | |||
| NUP35 | insertion | In_Frame_Ins | novel | c.843_844insCTGTTTATAAAC | p.Pro281_Arg282insLeuPheIleAsn | p.P281_R282insLFIN | Q8NFH5 | protein_coding | TCGA-AM-5820-01 | Colorectum | colon adenocarcinoma | Female | <65 | I/II | Unknown | Unknown | SD | ||
| NUP35 | SNV | Missense_Mutation | novel | c.682G>T | p.Asp228Tyr | p.D228Y | Q8NFH5 | protein_coding | deleterious(0) | probably_damaging(0.972) | TCGA-A5-A1OF-01 | Endometrium | uterine corpus endometrioid carcinoma | Female | <65 | I/II | Unknown | Unknown | SD |
| NUP35 | SNV | Missense_Mutation | c.448N>A | p.Leu150Ile | p.L150I | Q8NFH5 | protein_coding | tolerated(0.22) | benign(0.023) | TCGA-AP-A051-01 | Endometrium | uterine corpus endometrioid carcinoma | Female | >=65 | I/II | Unknown | Unknown | SD | |
| NUP35 | SNV | Missense_Mutation | rs765515641 | c.155N>A | p.Arg52Gln | p.R52Q | Q8NFH5 | protein_coding | deleterious(0.03) | possibly_damaging(0.838) | TCGA-AP-A1DV-01 | Endometrium | uterine corpus endometrioid carcinoma | Female | <65 | I/II | Unknown | Unknown | SD |
| NUP35 | SNV | Missense_Mutation | novel | c.514G>A | p.Asp172Asn | p.D172N | Q8NFH5 | protein_coding | deleterious(0.04) | benign(0.086) | TCGA-B5-A0JU-01 | Endometrium | uterine corpus endometrioid carcinoma | Female | <65 | I/II | Unknown | Unknown | SD |
| Page: 1 2 3 4 |
Top |
Related drugs of malignant transformation related genes |
| Identification of chemicals and drugs interact with genes involved in malignant transfromation |
| (DGIdb 4.0) |
| Entrez ID | Symbol | Category | Interaction Types | Drug Claim Name | Drug Name | PMIDs |
| Page: 1 |

Copyright 2023-Present -The University of Texas Health Science Center at Houston |