
|
|||||
|
 | |
| |
| |
| |
| |
| |
|
Gene: NOVA1 |
Gene summary for NOVA1 |
| Gene information | Species | Human | Gene symbol | NOVA1 | Gene ID | 4857 |
| Gene name | NOVA alternative splicing regulator 1 | |
| Gene Alias | Nova-1 | |
| Cytomap | 14q12 | |
| Gene Type | protein-coding | GO ID | GO:0000375 | UniProtAcc | P51513 |
Top |
Malignant transformation analysis |
| Identification of the aberrant gene expression in precancerous and cancerous lesions by comparing the gene expression of stem-like cells in diseased tissues with normal stem cells |
| Entrez ID | Symbol | Replicates | Species | Organ | Tissue | Adj P-value | Log2FC | Malignancy |
| 4857 | NOVA1 | GSM4909281 | Human | Breast | IDC | 1.02e-02 | -1.44e-01 | 0.21 |
| 4857 | NOVA1 | GSM4909282 | Human | Breast | IDC | 1.72e-05 | -1.53e-01 | -0.0288 |
| 4857 | NOVA1 | GSM4909285 | Human | Breast | IDC | 8.07e-06 | -1.53e-01 | 0.21 |
| 4857 | NOVA1 | GSM4909286 | Human | Breast | IDC | 8.07e-06 | -1.51e-01 | 0.1081 |
| 4857 | NOVA1 | GSM4909293 | Human | Breast | IDC | 4.18e-38 | 7.18e-01 | 0.1581 |
| 4857 | NOVA1 | GSM4909294 | Human | Breast | IDC | 1.08e-04 | -1.44e-01 | 0.2022 |
| 4857 | NOVA1 | GSM4909298 | Human | Breast | IDC | 1.54e-03 | -1.49e-01 | 0.1551 |
| 4857 | NOVA1 | GSM4909307 | Human | Breast | IDC | 1.53e-02 | 2.90e-01 | 0.1569 |
| 4857 | NOVA1 | GSM4909308 | Human | Breast | IDC | 1.63e-28 | 5.86e-01 | 0.158 |
| 4857 | NOVA1 | GSM4909311 | Human | Breast | IDC | 1.53e-05 | 4.29e-02 | 0.1534 |
| 4857 | NOVA1 | GSM4909319 | Human | Breast | IDC | 1.72e-05 | -1.53e-01 | 0.1563 |
| 4857 | NOVA1 | brca1 | Human | Breast | Precancer | 8.07e-06 | -1.40e-01 | -0.0338 |
| 4857 | NOVA1 | M5 | Human | Breast | IDC | 5.44e-15 | 1.08e+00 | 0.1598 |
| 4857 | NOVA1 | NCCBC14 | Human | Breast | DCIS | 3.83e-02 | -1.53e-01 | 0.2021 |
| 4857 | NOVA1 | NCCBC5 | Human | Breast | DCIS | 4.86e-02 | -1.53e-01 | 0.2046 |
| 4857 | NOVA1 | HTA12-15-2 | Human | Pancreas | PDAC | 4.45e-06 | 5.12e-01 | 0.2315 |
| 4857 | NOVA1 | HTA12-23-1 | Human | Pancreas | PDAC | 1.74e-14 | 1.02e+00 | 0.3405 |
| 4857 | NOVA1 | HTA12-25-1 | Human | Pancreas | PDAC | 1.33e-13 | 8.10e-01 | 0.313 |
| 4857 | NOVA1 | HTA12-26-1 | Human | Pancreas | PDAC | 1.22e-27 | 1.14e+00 | 0.3728 |
| 4857 | NOVA1 | HTA12-29-1 | Human | Pancreas | PDAC | 8.84e-67 | 1.15e+00 | 0.3722 |
| Page: 1 2 |
| Tissue | Expression Dynamics | Abbreviation |
| Breast | 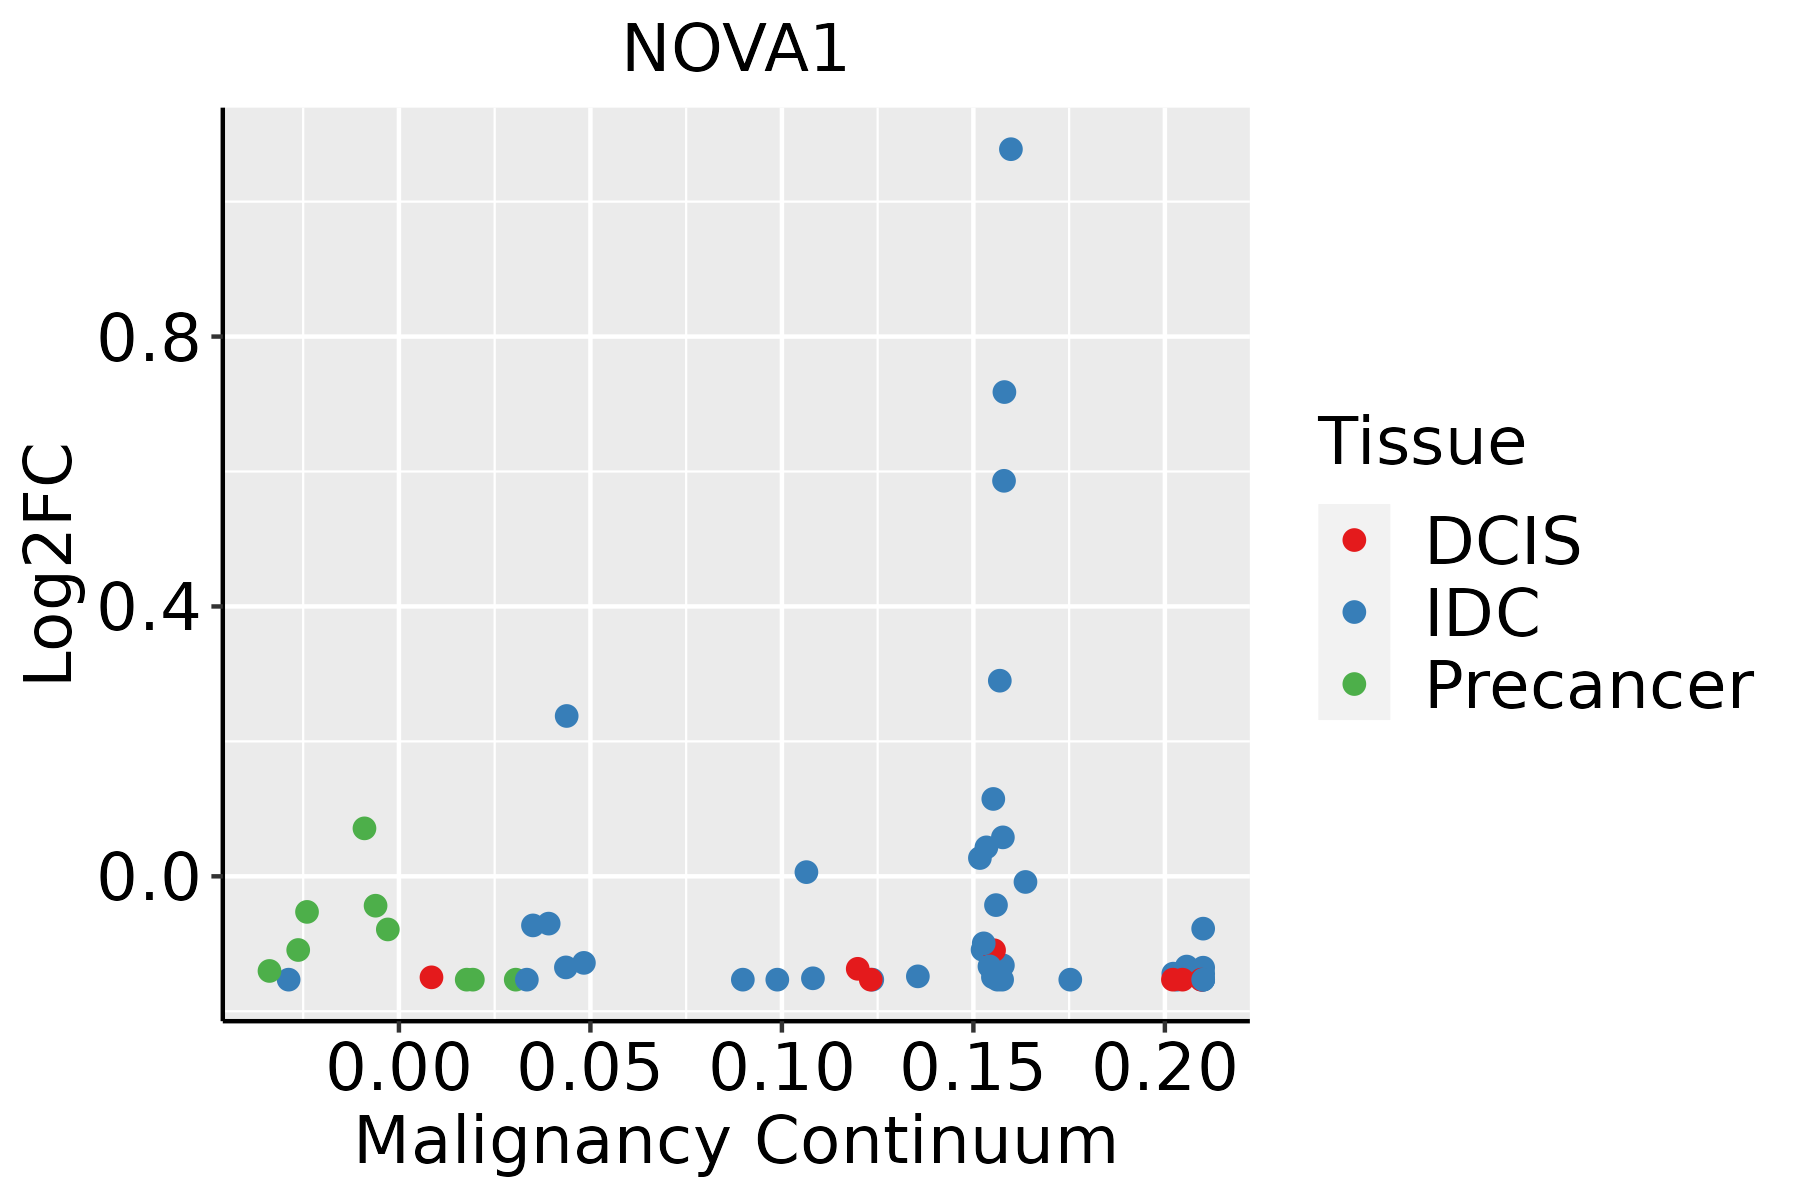 | IDC: Invasive ductal carcinoma |
| DCIS: Ductal carcinoma in situ | ||
| Precancer(BRCA1-mut): Precancerous lesion from BRCA1 mutation carriers | ||
| Thyroid | 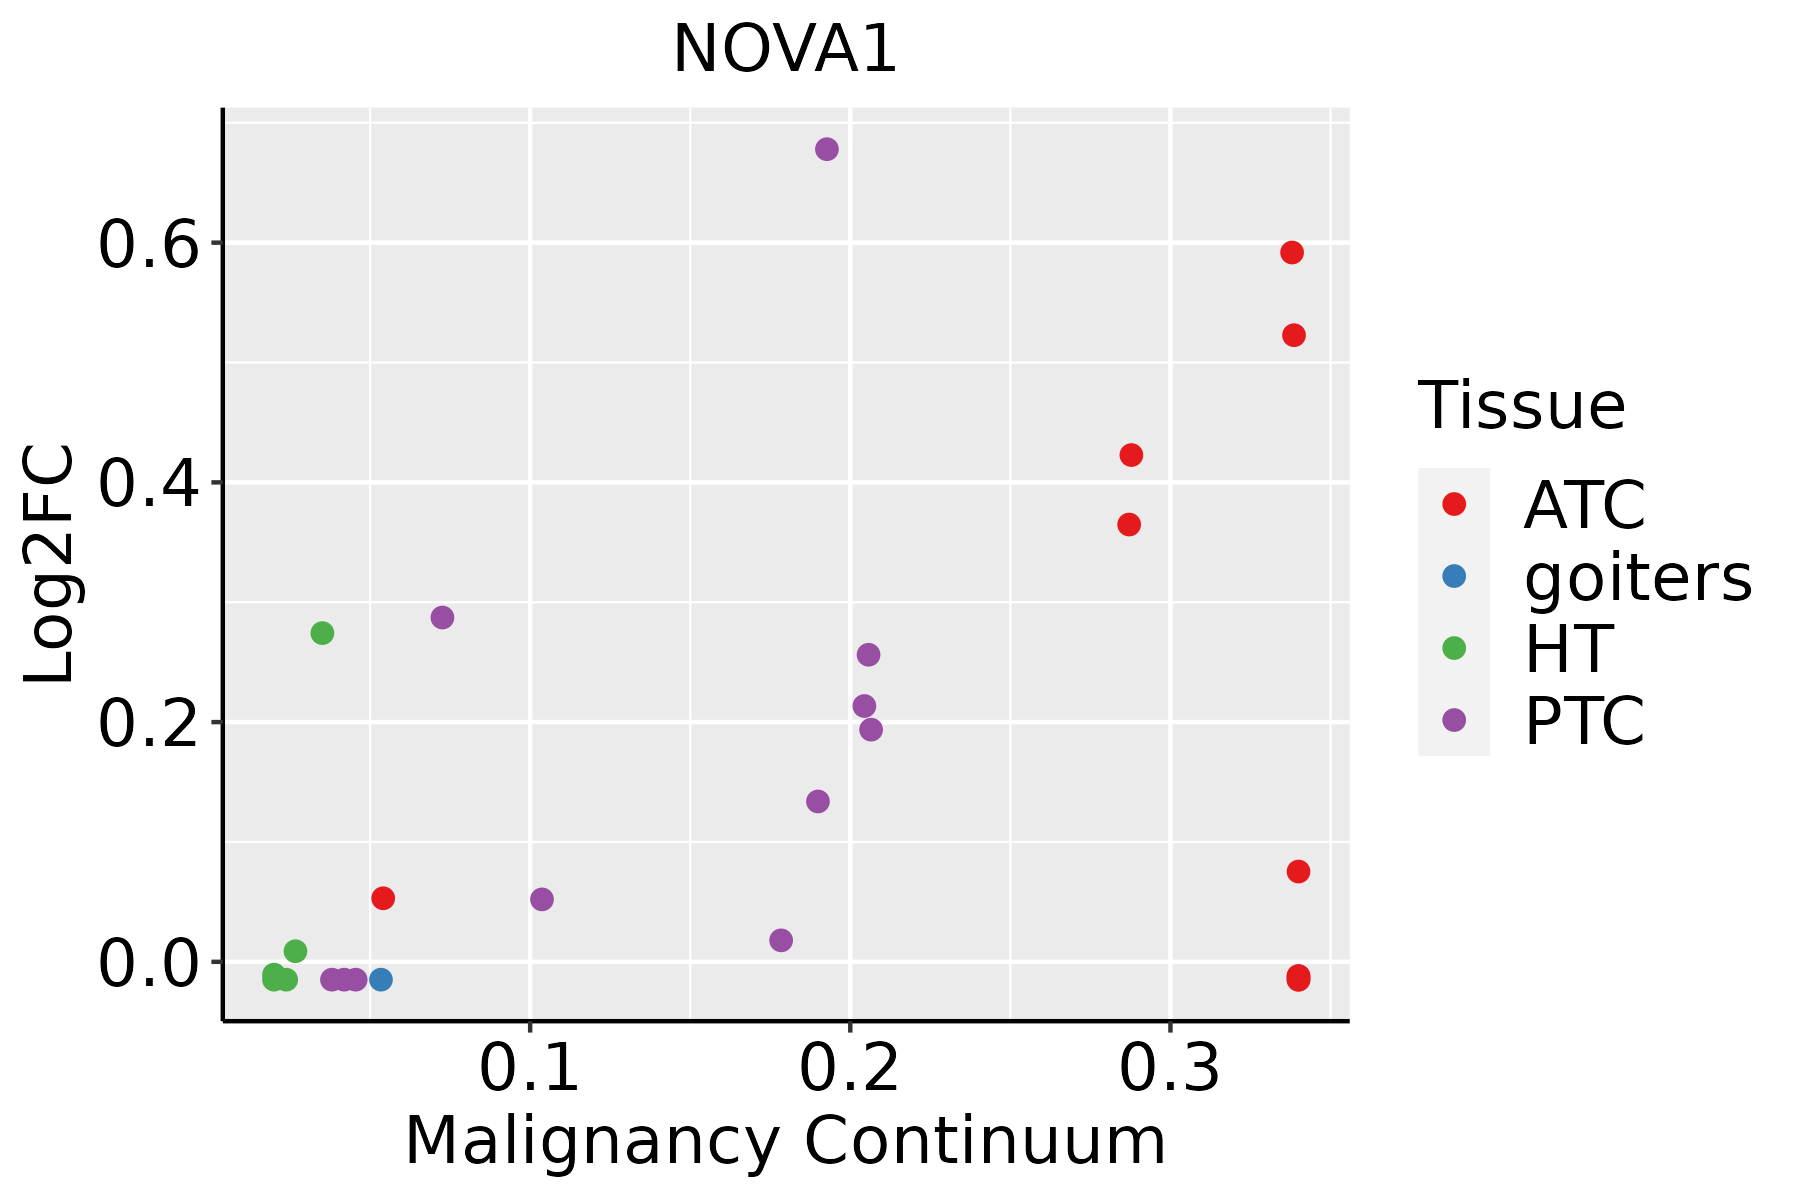 | ATC: Anaplastic thyroid cancer |
| HT: Hashimoto's thyroiditis | ||
| PTC: Papillary thyroid cancer |
| ∗log2FC in expression of this searched gene in stem-like cells from each diseased tissue sample relative to stem-like cells in normal samples in each tissue plotted against the malignancy continuum. Samples are colored based on if they are from different disease stage. |
Top |
Malignant transformation related pathway analysis |
| Find out the enriched GO biological processes and KEGG pathways involved in transition from healthy to precancer to cancer |
| Tissue | Disease Stage | Enriched GO biological Processes |
| Colorectum | AD |  |
| Colorectum | SER |  |
| Colorectum | MSS |  |
| Colorectum | MSI-H |  |
| Colorectum | FAP |  |
| ∗Top 15 enriched GO BP terms are showed in the bar plot of each disease state in each tissue. Each row represents a significant GO biological process which is colored according to the -log10(p.adjust). |
| Page: 1 2 3 4 5 6 7 8 9 |
| GO ID | Tissue | Disease Stage | Description | Gene Ratio | Bg Ratio | pvalue | p.adjust | Count |
| GO:000039834 | Thyroid | ATC | mRNA splicing, via spliceosome | 197/6293 | 320/18723 | 6.54e-25 | 2.18e-22 | 197 |
| GO:190331134 | Thyroid | ATC | regulation of mRNA metabolic process | 181/6293 | 288/18723 | 1.75e-24 | 5.54e-22 | 181 |
| GO:005068434 | Thyroid | ATC | regulation of mRNA processing | 97/6293 | 137/18723 | 5.28e-19 | 7.25e-17 | 97 |
| GO:004348435 | Thyroid | ATC | regulation of RNA splicing | 100/6293 | 148/18723 | 2.75e-17 | 2.72e-15 | 100 |
| GO:004802434 | Thyroid | ATC | regulation of mRNA splicing, via spliceosome | 70/6293 | 101/18723 | 2.29e-13 | 1.09e-11 | 70 |
| GO:000038026 | Thyroid | ATC | alternative mRNA splicing, via spliceosome | 50/6293 | 77/18723 | 1.84e-08 | 3.65e-07 | 50 |
| GO:000038126 | Thyroid | ATC | regulation of alternative mRNA splicing, via spliceosome | 36/6293 | 60/18723 | 2.48e-05 | 2.16e-04 | 36 |
| GO:010610621 | Thyroid | ATC | cold-induced thermogenesis | 68/6293 | 144/18723 | 4.70e-04 | 2.76e-03 | 68 |
| GO:012016121 | Thyroid | ATC | regulation of cold-induced thermogenesis | 68/6293 | 144/18723 | 4.70e-04 | 2.76e-03 | 68 |
| GO:199084521 | Thyroid | ATC | adaptive thermogenesis | 71/6293 | 157/18723 | 1.59e-03 | 7.99e-03 | 71 |
| GO:000165912 | Thyroid | ATC | temperature homeostasis | 73/6293 | 174/18723 | 1.29e-02 | 4.51e-02 | 73 |
| Page: 1 2 3 4 |
| Pathway ID | Tissue | Disease Stage | Description | Gene Ratio | Bg Ratio | pvalue | p.adjust | qvalue | Count |
| Page: 1 |
Top |
Cell-cell communication analysis |
| Identification of potential cell-cell interactions between two cell types and their ligand-receptor pairs for different disease states |
| Ligand | Receptor | LRpair | Pathway | Tissue | Disease Stage |
| Page: 1 |
Top |
Single-cell gene regulatory network inference analysis |
| Find out the significant the regulons (TFs) and the target genes of each regulon across cell types for different disease states |
| TF | Cell Type | Tissue | Disease Stage | Target Gene | RSS | Regulon Activity |
| ∗The dot plots of a searched regulon are shown for all cell subpopulations in each disease state of each tissue based on the regulon specific score inferred using pySCENIC and by calculating the average expression. |
| Page: 1 |
Top |
Somatic mutation of malignant transformation related genes |
| Annotation of somatic variants for genes involved in malignant transformation |
| Hugo Symbol | Variant Class | Variant Classification | dbSNP RS | HGVSc | HGVSp | HGVSp Short | SWISSPROT | BIOTYPE | SIFT | PolyPhen | Tumor Sample Barcode | Tissue | Histology | Sex | Age | Stage | Therapy Types | Drugs | Outcome |
| NOVA1 | SNV | Missense_Mutation | c.436N>T | p.Arg146Cys | p.R146C | P51513 | protein_coding | deleterious(0) | probably_damaging(0.988) | TCGA-AN-A046-01 | Breast | breast invasive carcinoma | Female | >=65 | I/II | Unknown | Unknown | SD | |
| NOVA1 | SNV | Missense_Mutation | c.893N>A | p.Ala298Glu | p.A298E | P51513 | protein_coding | tolerated(0.16) | possibly_damaging(0.487) | TCGA-E9-A1NC-01 | Breast | breast invasive carcinoma | Female | <65 | I/II | Chemotherapy | doxorubicin | CR | |
| NOVA1 | SNV | Missense_Mutation | c.76N>T | p.Arg26Trp | p.R26W | P51513 | protein_coding | deleterious(0) | probably_damaging(0.942) | TCGA-2W-A8YY-01 | Cervix | cervical & endocervical cancer | Female | <65 | I/II | Chemotherapy | cisplatin | CR | |
| NOVA1 | SNV | Missense_Mutation | c.553C>G | p.Leu185Val | p.L185V | P51513 | protein_coding | deleterious(0) | probably_damaging(0.953) | TCGA-IR-A3LH-01 | Cervix | cervical & endocervical cancer | Female | <65 | I/II | Chemotherapy | cisplatin | CR | |
| NOVA1 | SNV | Missense_Mutation | c.68N>T | p.Pro23Leu | p.P23L | P51513 | protein_coding | tolerated(0.05) | benign(0.02) | TCGA-JW-A5VI-01 | Cervix | cervical & endocervical cancer | Female | <65 | I/II | Chemotherapy | topotecan | PD | |
| NOVA1 | SNV | Missense_Mutation | c.391N>C | p.Glu131Gln | p.E131Q | P51513 | protein_coding | tolerated(0.06) | possibly_damaging(0.634) | TCGA-JW-A5VL-01 | Cervix | cervical & endocervical cancer | Female | <65 | I/II | Unknown | Unknown | SD | |
| NOVA1 | SNV | Missense_Mutation | c.1358C>A | p.Ala453Glu | p.A453E | P51513 | protein_coding | deleterious(0) | probably_damaging(0.999) | TCGA-A6-2677-01 | Colorectum | colon adenocarcinoma | Female | >=65 | III/IV | Ancillary | leucovorin | SD | |
| NOVA1 | SNV | Missense_Mutation | rs142443593 | c.422N>T | p.Thr141Ile | p.T141I | P51513 | protein_coding | deleterious(0.01) | benign(0.349) | TCGA-A6-3810-01 | Colorectum | colon adenocarcinoma | Male | <65 | I/II | Unknown | Unknown | SD |
| NOVA1 | SNV | Missense_Mutation | c.1169N>T | p.Ala390Val | p.A390V | P51513 | protein_coding | tolerated(0.12) | probably_damaging(0.971) | TCGA-A6-6781-01 | Colorectum | colon adenocarcinoma | Male | <65 | III/IV | Chemotherapy | oxaliplatin | SD | |
| NOVA1 | SNV | Missense_Mutation | novel | c.277N>A | p.Pro93Thr | p.P93T | P51513 | protein_coding | deleterious(0.01) | probably_damaging(0.991) | TCGA-AA-3496-01 | Colorectum | colon adenocarcinoma | Female | >=65 | I/II | Unknown | Unknown | SD |
| Page: 1 2 3 4 5 6 7 8 9 10 11 12 |
Top |
Related drugs of malignant transformation related genes |
| Identification of chemicals and drugs interact with genes involved in malignant transfromation |
| (DGIdb 4.0) |
| Entrez ID | Symbol | Category | Interaction Types | Drug Claim Name | Drug Name | PMIDs |
| Page: 1 |

Copyright 2023-Present -The University of Texas Health Science Center at Houston |