
|
|||||
|
 | |
| |
| |
| |
| |
| |
|
Gene: NEK6 |
Gene summary for NEK6 |
| Gene information | Species | Human | Gene symbol | NEK6 | Gene ID | 10783 |
| Gene name | NIMA related kinase 6 | |
| Gene Alias | SID6-1512 | |
| Cytomap | 9q33.3 | |
| Gene Type | protein-coding | GO ID | GO:0000070 | UniProtAcc | Q9HC98 |
Top |
Malignant transformation analysis |
| Identification of the aberrant gene expression in precancerous and cancerous lesions by comparing the gene expression of stem-like cells in diseased tissues with normal stem cells |
| Entrez ID | Symbol | Replicates | Species | Organ | Tissue | Adj P-value | Log2FC | Malignancy |
| 10783 | NEK6 | LZE4T | Human | Esophagus | ESCC | 1.68e-05 | 1.13e-01 | 0.0811 |
| 10783 | NEK6 | LZE8T | Human | Esophagus | ESCC | 2.63e-03 | 9.52e-02 | 0.067 |
| 10783 | NEK6 | LZE20T | Human | Esophagus | ESCC | 2.27e-07 | 3.69e-01 | 0.0662 |
| 10783 | NEK6 | P1T-E | Human | Esophagus | ESCC | 2.61e-05 | 4.46e-01 | 0.0875 |
| 10783 | NEK6 | P2T-E | Human | Esophagus | ESCC | 3.64e-15 | 3.06e-01 | 0.1177 |
| 10783 | NEK6 | P4T-E | Human | Esophagus | ESCC | 1.68e-17 | 3.71e-01 | 0.1323 |
| 10783 | NEK6 | P5T-E | Human | Esophagus | ESCC | 1.50e-14 | 2.09e-01 | 0.1327 |
| 10783 | NEK6 | P8T-E | Human | Esophagus | ESCC | 6.81e-63 | 1.15e+00 | 0.0889 |
| 10783 | NEK6 | P9T-E | Human | Esophagus | ESCC | 6.68e-06 | 1.91e-01 | 0.1131 |
| 10783 | NEK6 | P10T-E | Human | Esophagus | ESCC | 5.84e-22 | 3.50e-01 | 0.116 |
| 10783 | NEK6 | P11T-E | Human | Esophagus | ESCC | 1.91e-27 | 9.59e-01 | 0.1426 |
| 10783 | NEK6 | P12T-E | Human | Esophagus | ESCC | 4.51e-20 | 2.95e-01 | 0.1122 |
| 10783 | NEK6 | P15T-E | Human | Esophagus | ESCC | 8.56e-17 | 4.50e-01 | 0.1149 |
| 10783 | NEK6 | P16T-E | Human | Esophagus | ESCC | 4.77e-17 | 2.43e-01 | 0.1153 |
| 10783 | NEK6 | P17T-E | Human | Esophagus | ESCC | 4.10e-06 | 4.86e-01 | 0.1278 |
| 10783 | NEK6 | P19T-E | Human | Esophagus | ESCC | 4.93e-13 | 9.11e-01 | 0.1662 |
| 10783 | NEK6 | P21T-E | Human | Esophagus | ESCC | 2.03e-44 | 8.62e-01 | 0.1617 |
| 10783 | NEK6 | P22T-E | Human | Esophagus | ESCC | 4.65e-15 | 2.42e-01 | 0.1236 |
| 10783 | NEK6 | P23T-E | Human | Esophagus | ESCC | 4.80e-07 | 2.41e-01 | 0.108 |
| 10783 | NEK6 | P24T-E | Human | Esophagus | ESCC | 4.74e-18 | 3.12e-01 | 0.1287 |
| Page: 1 2 3 4 5 |
| Tissue | Expression Dynamics | Abbreviation |
| Esophagus | 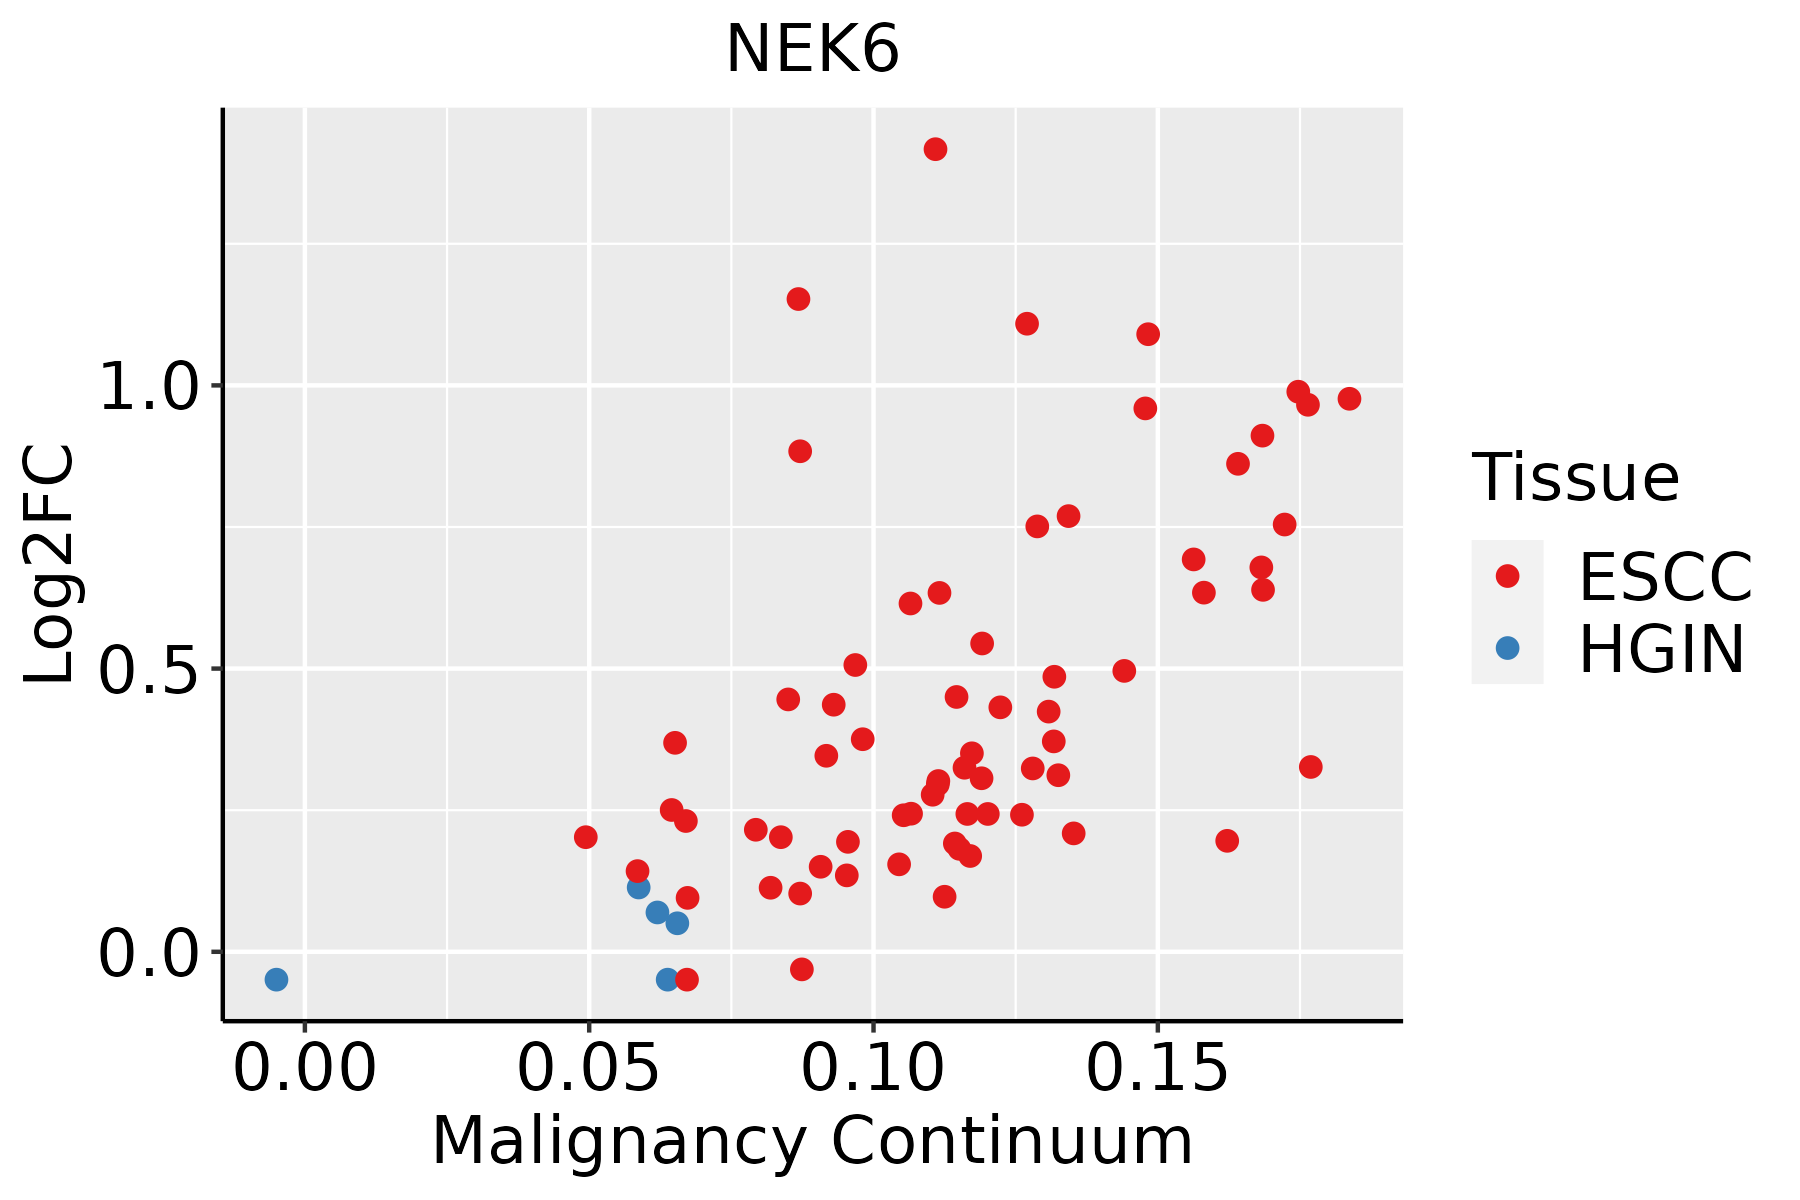 | ESCC: Esophageal squamous cell carcinoma |
| HGIN: High-grade intraepithelial neoplasias | ||
| LGIN: Low-grade intraepithelial neoplasias | ||
| Liver | 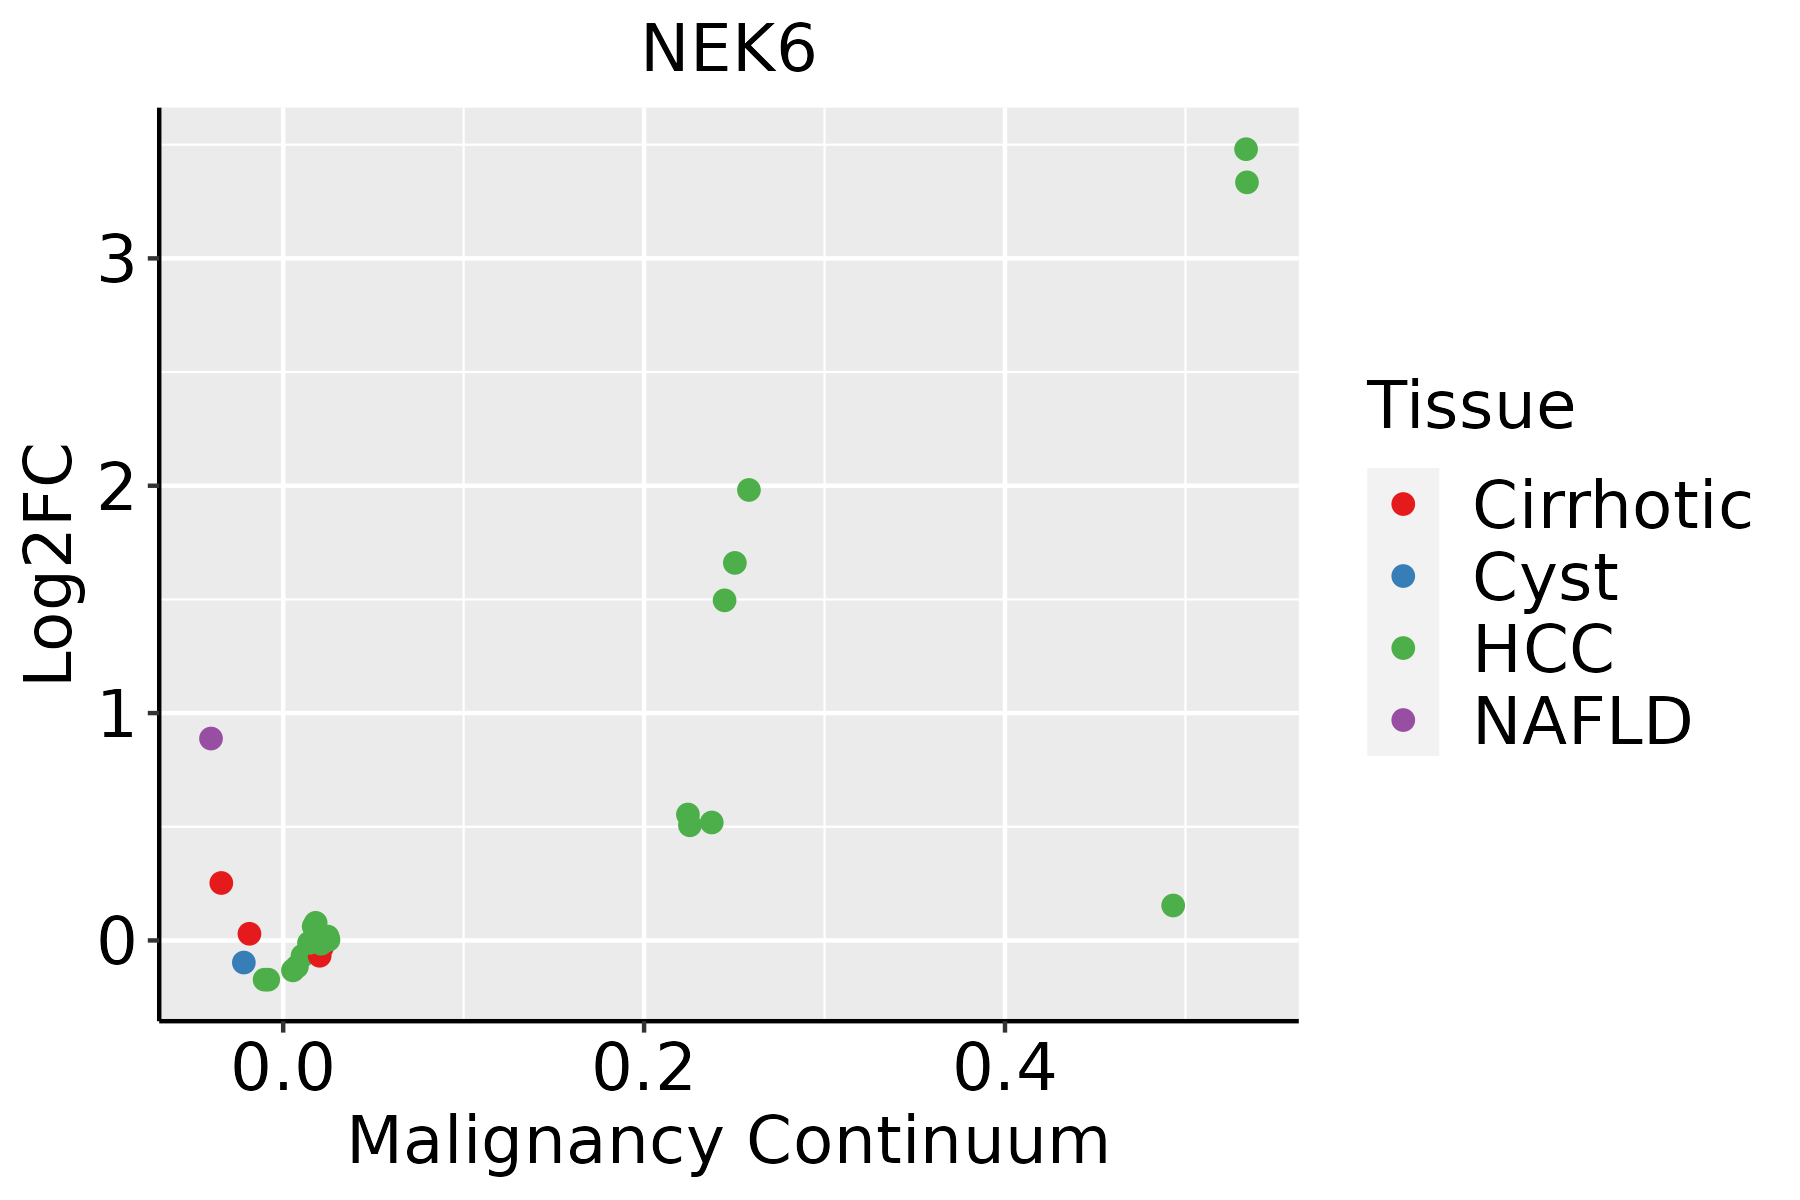 | HCC: Hepatocellular carcinoma |
| NAFLD: Non-alcoholic fatty liver disease | ||
| Lung |  | AAH: Atypical adenomatous hyperplasia |
| AIS: Adenocarcinoma in situ | ||
| IAC: Invasive lung adenocarcinoma | ||
| MIA: Minimally invasive adenocarcinoma | ||
| Oral Cavity | 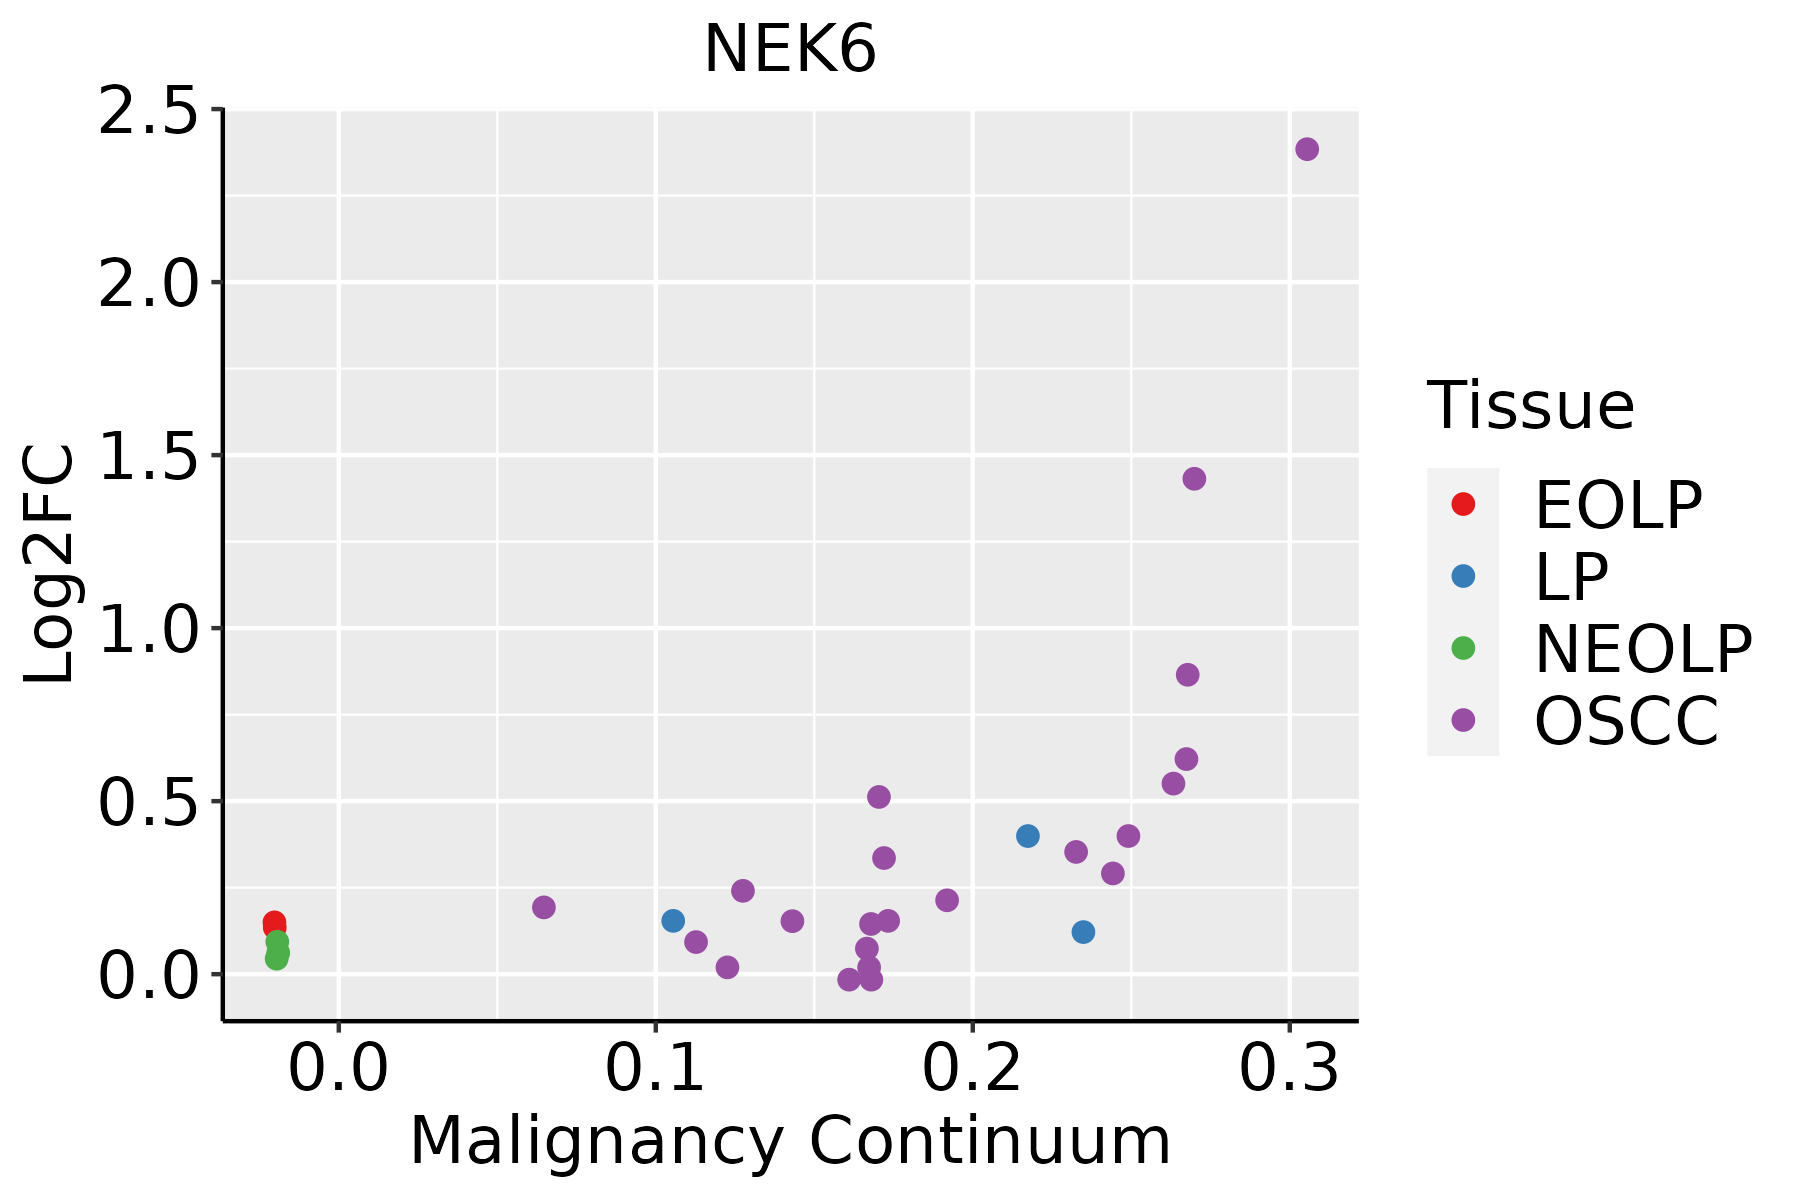 | EOLP: Erosive Oral lichen planus |
| LP: leukoplakia | ||
| NEOLP: Non-erosive oral lichen planus | ||
| OSCC: Oral squamous cell carcinoma | ||
| Thyroid | 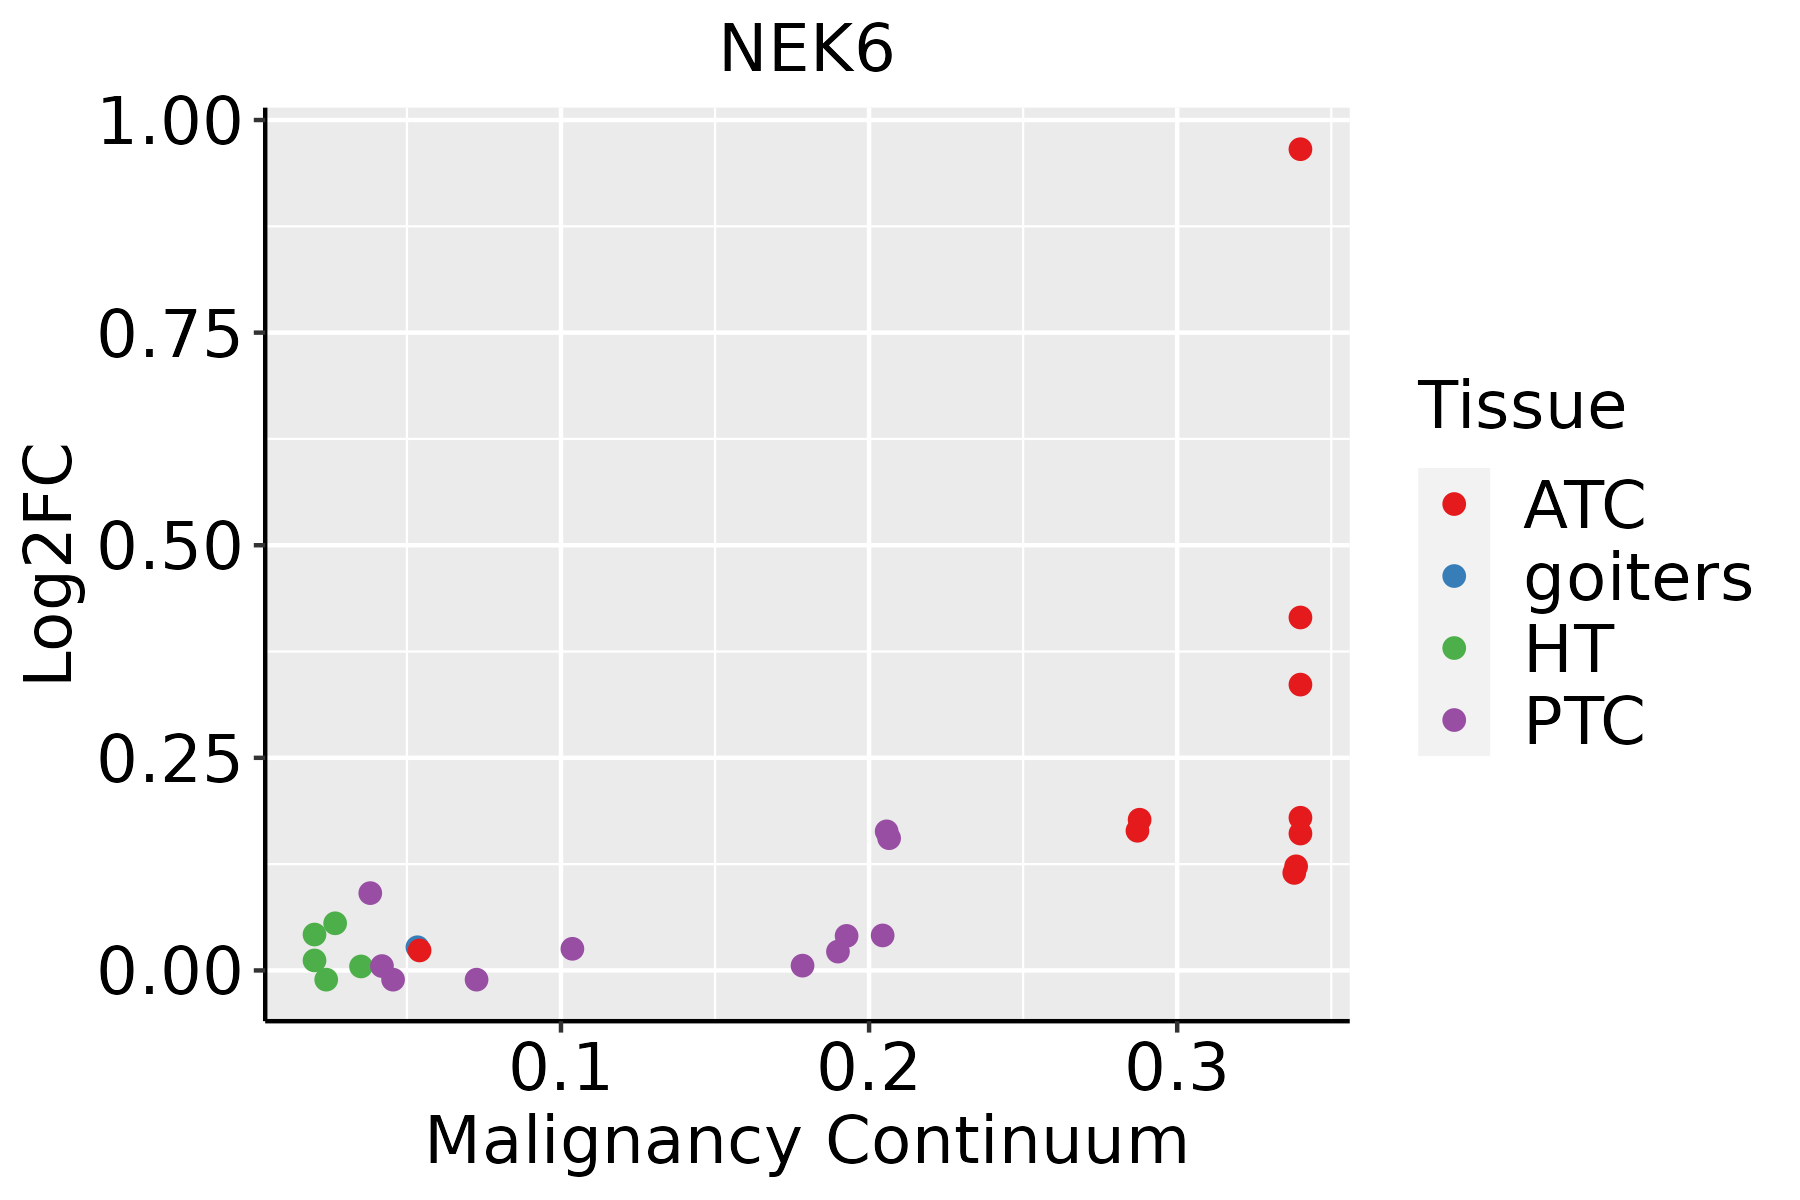 | ATC: Anaplastic thyroid cancer |
| HT: Hashimoto's thyroiditis | ||
| PTC: Papillary thyroid cancer |
| ∗log2FC in expression of this searched gene in stem-like cells from each diseased tissue sample relative to stem-like cells in normal samples in each tissue plotted against the malignancy continuum. Samples are colored based on if they are from different disease stage. |
Top |
Malignant transformation related pathway analysis |
| Find out the enriched GO biological processes and KEGG pathways involved in transition from healthy to precancer to cancer |
| Tissue | Disease Stage | Enriched GO biological Processes |
| Colorectum | AD |  |
| Colorectum | SER |  |
| Colorectum | MSS |  |
| Colorectum | MSI-H |  |
| Colorectum | FAP |  |
| ∗Top 15 enriched GO BP terms are showed in the bar plot of each disease state in each tissue. Each row represents a significant GO biological process which is colored according to the -log10(p.adjust). |
| Page: 1 2 3 4 5 6 7 8 9 |
| GO ID | Tissue | Disease Stage | Description | Gene Ratio | Bg Ratio | pvalue | p.adjust | Count |
| GO:0071763 | Liver | Cirrhotic | nuclear membrane organization | 15/4634 | 33/18723 | 7.61e-03 | 3.60e-02 | 15 |
| GO:00512252 | Liver | Cirrhotic | spindle assembly | 41/4634 | 117/18723 | 8.08e-03 | 3.79e-02 | 41 |
| GO:0000819 | Liver | Cirrhotic | sister chromatid segregation | 65/4634 | 202/18723 | 1.01e-02 | 4.52e-02 | 65 |
| GO:002241112 | Liver | HCC | cellular component disassembly | 282/7958 | 443/18723 | 1.02e-19 | 1.38e-17 | 282 |
| GO:003304421 | Liver | HCC | regulation of chromosome organization | 125/7958 | 187/18723 | 1.35e-11 | 5.40e-10 | 125 |
| GO:014001411 | Liver | HCC | mitotic nuclear division | 174/7958 | 287/18723 | 3.74e-10 | 1.23e-08 | 174 |
| GO:0000070 | Liver | HCC | mitotic sister chromatid segregation | 110/7958 | 168/18723 | 1.42e-09 | 4.25e-08 | 110 |
| GO:00008191 | Liver | HCC | sister chromatid segregation | 128/7958 | 202/18723 | 1.59e-09 | 4.73e-08 | 128 |
| GO:00447722 | Liver | HCC | mitotic cell cycle phase transition | 240/7958 | 424/18723 | 2.47e-09 | 6.84e-08 | 240 |
| GO:000734611 | Liver | HCC | regulation of mitotic cell cycle | 255/7958 | 457/18723 | 4.96e-09 | 1.30e-07 | 255 |
| GO:000705111 | Liver | HCC | spindle organization | 116/7958 | 184/18723 | 1.40e-08 | 3.40e-07 | 116 |
| GO:0007059 | Liver | HCC | chromosome segregation | 197/7958 | 346/18723 | 3.57e-08 | 7.87e-07 | 197 |
| GO:000705211 | Liver | HCC | mitotic spindle organization | 80/7958 | 120/18723 | 7.43e-08 | 1.50e-06 | 80 |
| GO:190285011 | Liver | HCC | microtubule cytoskeleton organization involved in mitosis | 93/7958 | 147/18723 | 2.91e-07 | 5.09e-06 | 93 |
| GO:005122511 | Liver | HCC | spindle assembly | 75/7958 | 117/18723 | 1.92e-06 | 2.67e-05 | 75 |
| GO:19019901 | Liver | HCC | regulation of mitotic cell cycle phase transition | 167/7958 | 299/18723 | 1.96e-06 | 2.71e-05 | 167 |
| GO:19019871 | Liver | HCC | regulation of cell cycle phase transition | 211/7958 | 390/18723 | 2.11e-06 | 2.89e-05 | 211 |
| GO:0098813 | Liver | HCC | nuclear chromosome segregation | 157/7958 | 281/18723 | 3.82e-06 | 4.95e-05 | 157 |
| GO:000756822 | Liver | HCC | aging | 185/7958 | 339/18723 | 4.28e-06 | 5.50e-05 | 185 |
| GO:00717631 | Liver | HCC | nuclear membrane organization | 27/7958 | 33/18723 | 4.31e-06 | 5.50e-05 | 27 |
| Page: 1 2 3 4 5 6 7 8 9 10 11 12 13 14 |
| Pathway ID | Tissue | Disease Stage | Description | Gene Ratio | Bg Ratio | pvalue | p.adjust | qvalue | Count |
| Page: 1 |
Top |
Cell-cell communication analysis |
| Identification of potential cell-cell interactions between two cell types and their ligand-receptor pairs for different disease states |
| Ligand | Receptor | LRpair | Pathway | Tissue | Disease Stage |
| Page: 1 |
Top |
Single-cell gene regulatory network inference analysis |
| Find out the significant the regulons (TFs) and the target genes of each regulon across cell types for different disease states |
| TF | Cell Type | Tissue | Disease Stage | Target Gene | RSS | Regulon Activity |
| ∗The dot plots of a searched regulon are shown for all cell subpopulations in each disease state of each tissue based on the regulon specific score inferred using pySCENIC and by calculating the average expression. |
| Page: 1 |
Top |
Somatic mutation of malignant transformation related genes |
| Annotation of somatic variants for genes involved in malignant transformation |
| Hugo Symbol | Variant Class | Variant Classification | dbSNP RS | HGVSc | HGVSp | HGVSp Short | SWISSPROT | BIOTYPE | SIFT | PolyPhen | Tumor Sample Barcode | Tissue | Histology | Sex | Age | Stage | Therapy Types | Drugs | Outcome |
| NEK6 | SNV | Missense_Mutation | c.469N>C | p.Glu157Gln | p.E157Q | Q9HC98 | protein_coding | deleterious(0.01) | probably_damaging(0.997) | TCGA-AC-A23H-01 | Breast | breast invasive carcinoma | Female | >=65 | I/II | Unknown | Unknown | PD | |
| NEK6 | SNV | Missense_Mutation | novel | c.686N>A | p.Arg229His | p.R229H | Q9HC98 | protein_coding | deleterious(0) | probably_damaging(0.996) | TCGA-BH-A18L-01 | Breast | breast invasive carcinoma | Female | <65 | III/IV | Unknown | Unknown | SD |
| NEK6 | SNV | Missense_Mutation | c.808N>G | p.Leu270Val | p.L270V | Q9HC98 | protein_coding | tolerated(0.11) | possibly_damaging(0.664) | TCGA-D8-A27G-01 | Breast | breast invasive carcinoma | Female | >=65 | I/II | Unknown | Unknown | SD | |
| NEK6 | insertion | Frame_Shift_Ins | novel | c.607_608insCTGATGCCCGTTGGAAC | p.Met203ThrfsTer24 | p.M203Tfs*24 | Q9HC98 | protein_coding | TCGA-A8-A08H-01 | Breast | breast invasive carcinoma | Female | >=65 | I/II | Unknown | Unknown | SD | ||
| NEK6 | SNV | Missense_Mutation | rs879292381 | c.577N>A | p.Ala193Thr | p.A193T | Q9HC98 | protein_coding | deleterious(0) | probably_damaging(0.989) | TCGA-2W-A8YY-01 | Cervix | cervical & endocervical cancer | Female | <65 | I/II | Chemotherapy | cisplatin | CR |
| NEK6 | SNV | Missense_Mutation | c.341N>T | p.Glu114Val | p.E114V | Q9HC98 | protein_coding | deleterious(0.01) | possibly_damaging(0.886) | TCGA-C5-A1MI-01 | Cervix | cervical & endocervical cancer | Female | <65 | I/II | Chemotherapy | cisplatin | PD | |
| NEK6 | SNV | Missense_Mutation | rs750746819 | c.217N>T | p.Arg73Cys | p.R73C | Q9HC98 | protein_coding | tolerated_low_confidence(0.11) | benign(0.006) | TCGA-MA-AA3W-01 | Cervix | cervical & endocervical cancer | Female | <65 | I/II | Chemotherapy | cisplatin | CR |
| NEK6 | SNV | Missense_Mutation | c.959N>C | p.Ile320Thr | p.I320T | Q9HC98 | protein_coding | deleterious(0) | probably_damaging(0.972) | TCGA-AA-3811-01 | Colorectum | colon adenocarcinoma | Female | >=65 | III/IV | Unknown | Unknown | PD | |
| NEK6 | SNV | Missense_Mutation | c.661N>C | p.Lys221Gln | p.K221Q | Q9HC98 | protein_coding | deleterious(0.03) | probably_damaging(0.999) | TCGA-AA-3966-01 | Colorectum | colon adenocarcinoma | Female | >=65 | I/II | Unknown | Unknown | SD | |
| NEK6 | SNV | Missense_Mutation | rs183673274 | c.230N>T | p.Ala77Val | p.A77V | Q9HC98 | protein_coding | tolerated(0.1) | benign(0.051) | TCGA-AD-A5EJ-01 | Colorectum | colon adenocarcinoma | Female | >=65 | I/II | Unknown | Unknown | SD |
| Page: 1 2 3 |
Top |
Related drugs of malignant transformation related genes |
| Identification of chemicals and drugs interact with genes involved in malignant transfromation |
| (DGIdb 4.0) |
| Entrez ID | Symbol | Category | Interaction Types | Drug Claim Name | Drug Name | PMIDs |
| 10783 | NEK6 | DRUGGABLE GENOME, KINASE, ENZYME, SERINE THREONINE KINASE | inhibitor | 249565885 |
| Page: 1 |

Copyright 2023-Present -The University of Texas Health Science Center at Houston |