
|
|||||
|
 | |
| |
| |
| |
| |
| |
|
Gene: NAA60 |
Gene summary for NAA60 |
| Gene information | Species | Human | Gene symbol | NAA60 | Gene ID | 79903 |
| Gene name | N-alpha-acetyltransferase 60, NatF catalytic subunit | |
| Gene Alias | HAT4 | |
| Cytomap | 16p13.3 | |
| Gene Type | protein-coding | GO ID | GO:0006323 | UniProtAcc | Q9H7X0 |
Top |
Malignant transformation analysis |
| Identification of the aberrant gene expression in precancerous and cancerous lesions by comparing the gene expression of stem-like cells in diseased tissues with normal stem cells |
| Entrez ID | Symbol | Replicates | Species | Organ | Tissue | Adj P-value | Log2FC | Malignancy |
| 79903 | NAA60 | LZE4T | Human | Esophagus | ESCC | 2.13e-11 | 2.28e-01 | 0.0811 |
| 79903 | NAA60 | LZE5T | Human | Esophagus | ESCC | 1.39e-02 | 1.52e-01 | 0.0514 |
| 79903 | NAA60 | LZE7T | Human | Esophagus | ESCC | 8.98e-12 | 6.54e-01 | 0.0667 |
| 79903 | NAA60 | LZE8T | Human | Esophagus | ESCC | 5.18e-11 | 2.87e-01 | 0.067 |
| 79903 | NAA60 | LZE20T | Human | Esophagus | ESCC | 2.08e-08 | 2.21e-01 | 0.0662 |
| 79903 | NAA60 | LZE22T | Human | Esophagus | ESCC | 9.86e-05 | 2.92e-01 | 0.068 |
| 79903 | NAA60 | LZE24T | Human | Esophagus | ESCC | 1.45e-21 | 5.28e-01 | 0.0596 |
| 79903 | NAA60 | LZE21T | Human | Esophagus | ESCC | 1.59e-09 | 3.79e-01 | 0.0655 |
| 79903 | NAA60 | LZE6T | Human | Esophagus | ESCC | 1.32e-04 | 1.18e-01 | 0.0845 |
| 79903 | NAA60 | P1T-E | Human | Esophagus | ESCC | 2.51e-15 | 5.43e-01 | 0.0875 |
| 79903 | NAA60 | P2T-E | Human | Esophagus | ESCC | 5.35e-33 | 6.89e-01 | 0.1177 |
| 79903 | NAA60 | P4T-E | Human | Esophagus | ESCC | 1.53e-22 | 3.67e-01 | 0.1323 |
| 79903 | NAA60 | P5T-E | Human | Esophagus | ESCC | 9.49e-22 | 2.29e-01 | 0.1327 |
| 79903 | NAA60 | P8T-E | Human | Esophagus | ESCC | 9.79e-28 | 4.73e-01 | 0.0889 |
| 79903 | NAA60 | P9T-E | Human | Esophagus | ESCC | 1.70e-14 | 2.74e-01 | 0.1131 |
| 79903 | NAA60 | P10T-E | Human | Esophagus | ESCC | 2.53e-14 | 2.74e-01 | 0.116 |
| 79903 | NAA60 | P11T-E | Human | Esophagus | ESCC | 1.69e-20 | 6.77e-01 | 0.1426 |
| 79903 | NAA60 | P12T-E | Human | Esophagus | ESCC | 4.41e-42 | 7.41e-01 | 0.1122 |
| 79903 | NAA60 | P15T-E | Human | Esophagus | ESCC | 1.34e-32 | 6.89e-01 | 0.1149 |
| 79903 | NAA60 | P16T-E | Human | Esophagus | ESCC | 5.91e-17 | 2.21e-01 | 0.1153 |
| Page: 1 2 3 4 5 6 |
| Tissue | Expression Dynamics | Abbreviation |
| Esophagus | 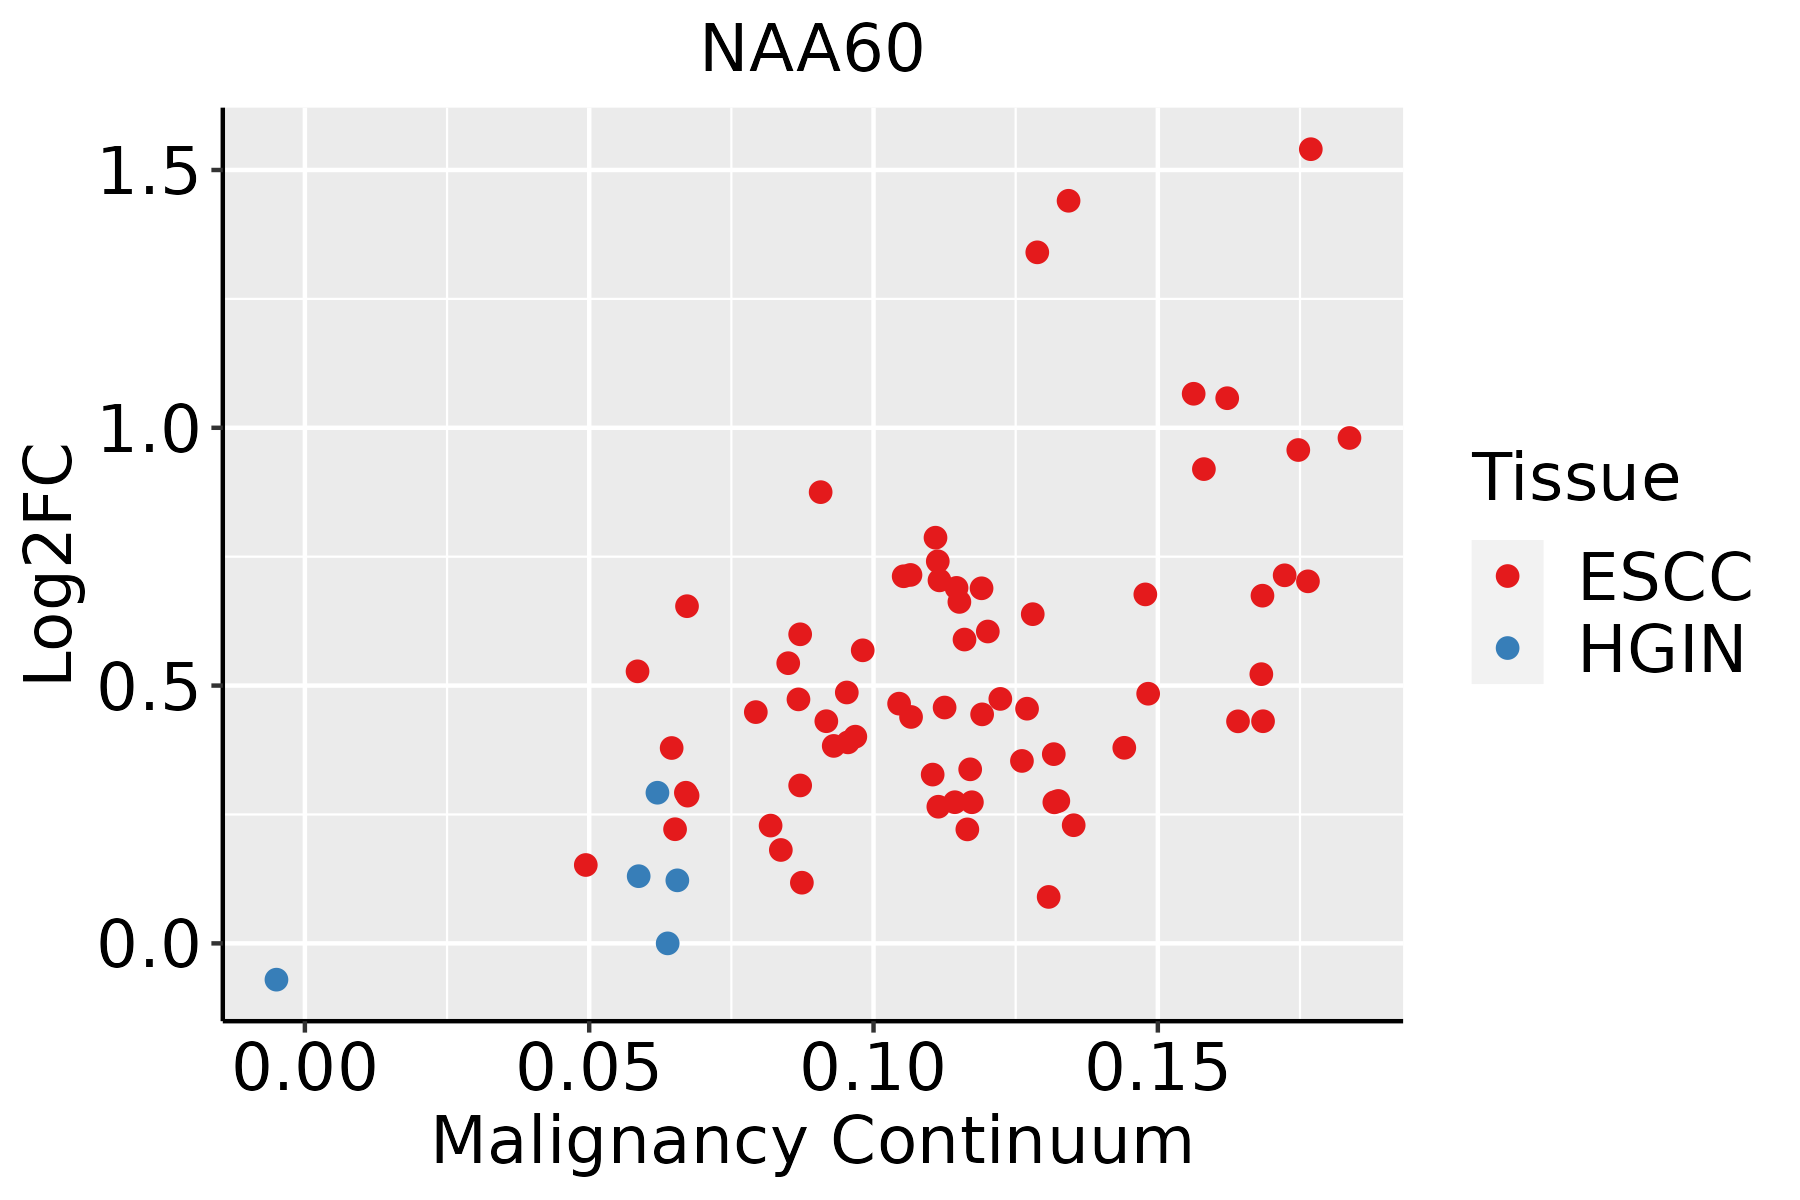 | ESCC: Esophageal squamous cell carcinoma |
| HGIN: High-grade intraepithelial neoplasias | ||
| LGIN: Low-grade intraepithelial neoplasias | ||
| Liver |  | HCC: Hepatocellular carcinoma |
| NAFLD: Non-alcoholic fatty liver disease | ||
| Oral Cavity | 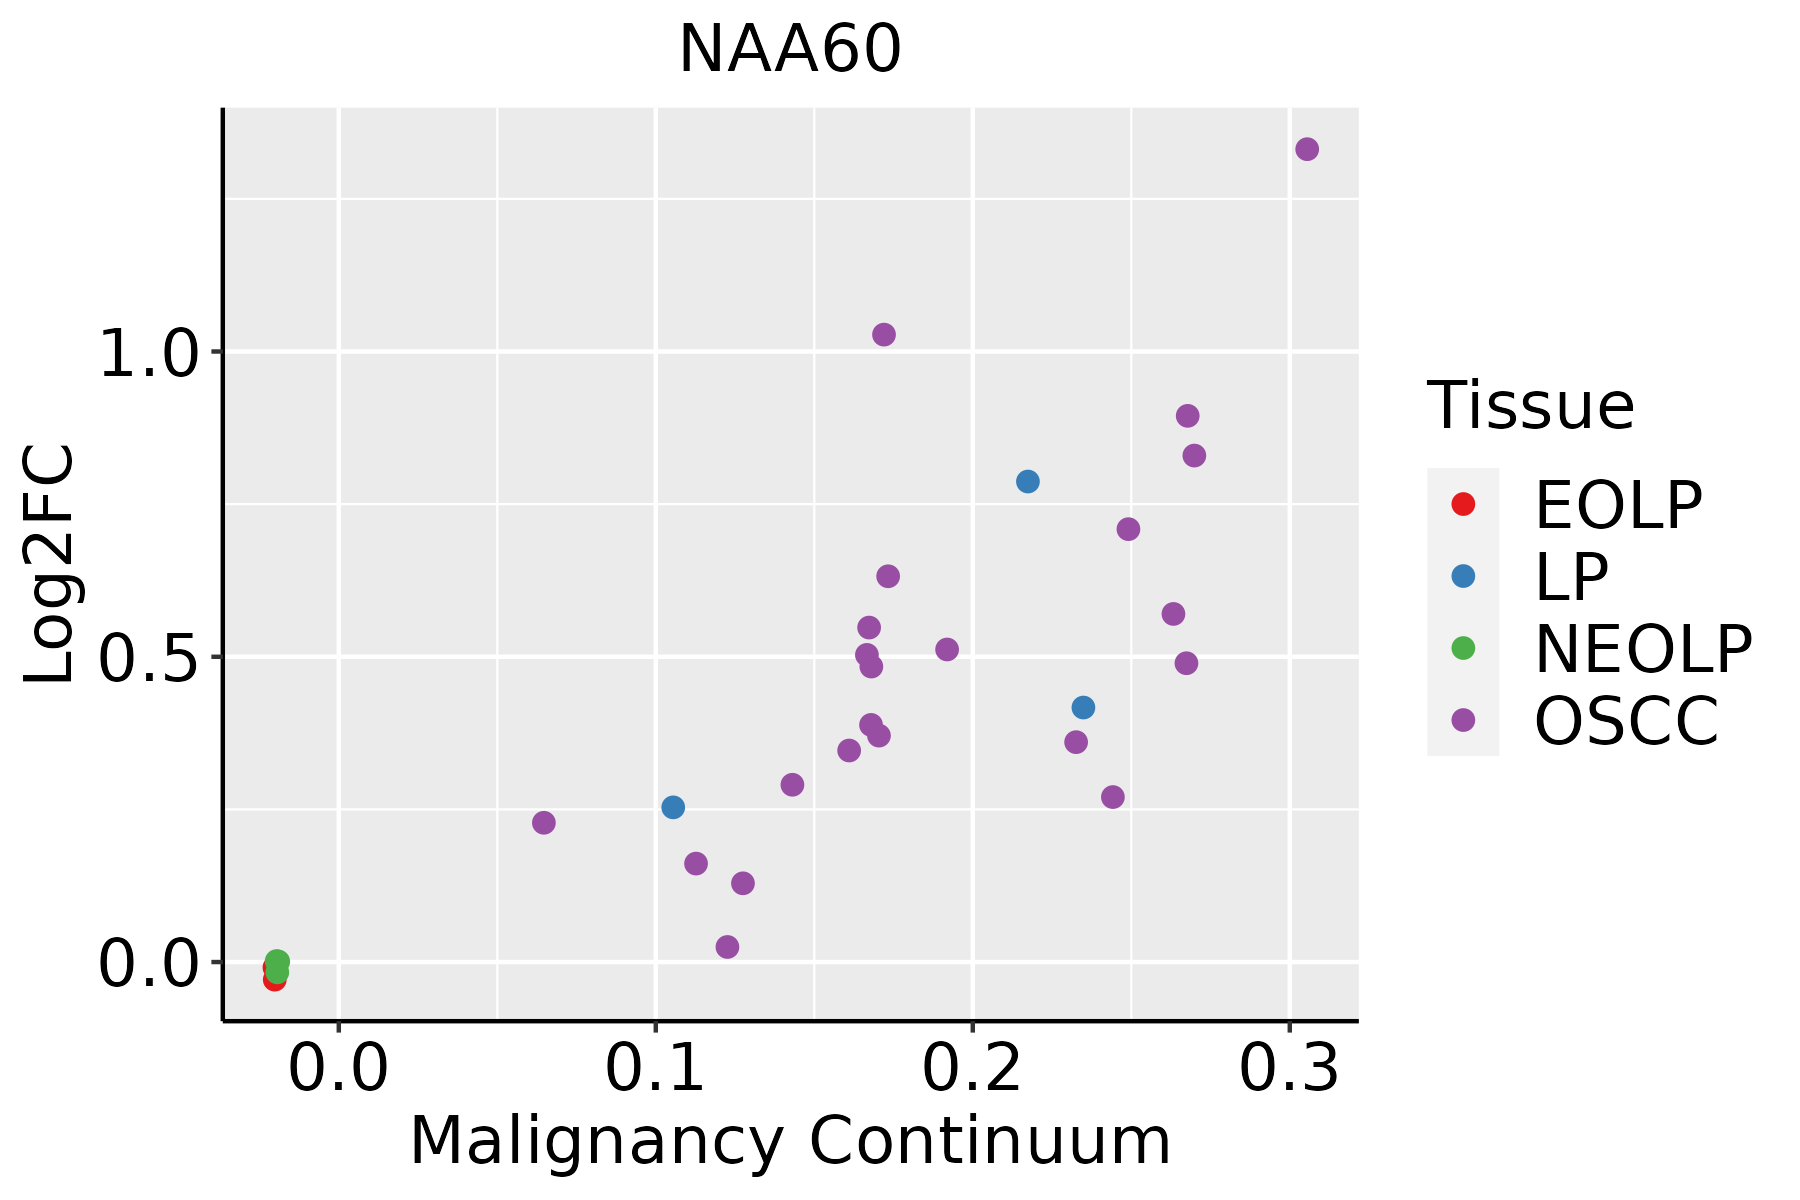 | EOLP: Erosive Oral lichen planus |
| LP: leukoplakia | ||
| NEOLP: Non-erosive oral lichen planus | ||
| OSCC: Oral squamous cell carcinoma | ||
| Thyroid | 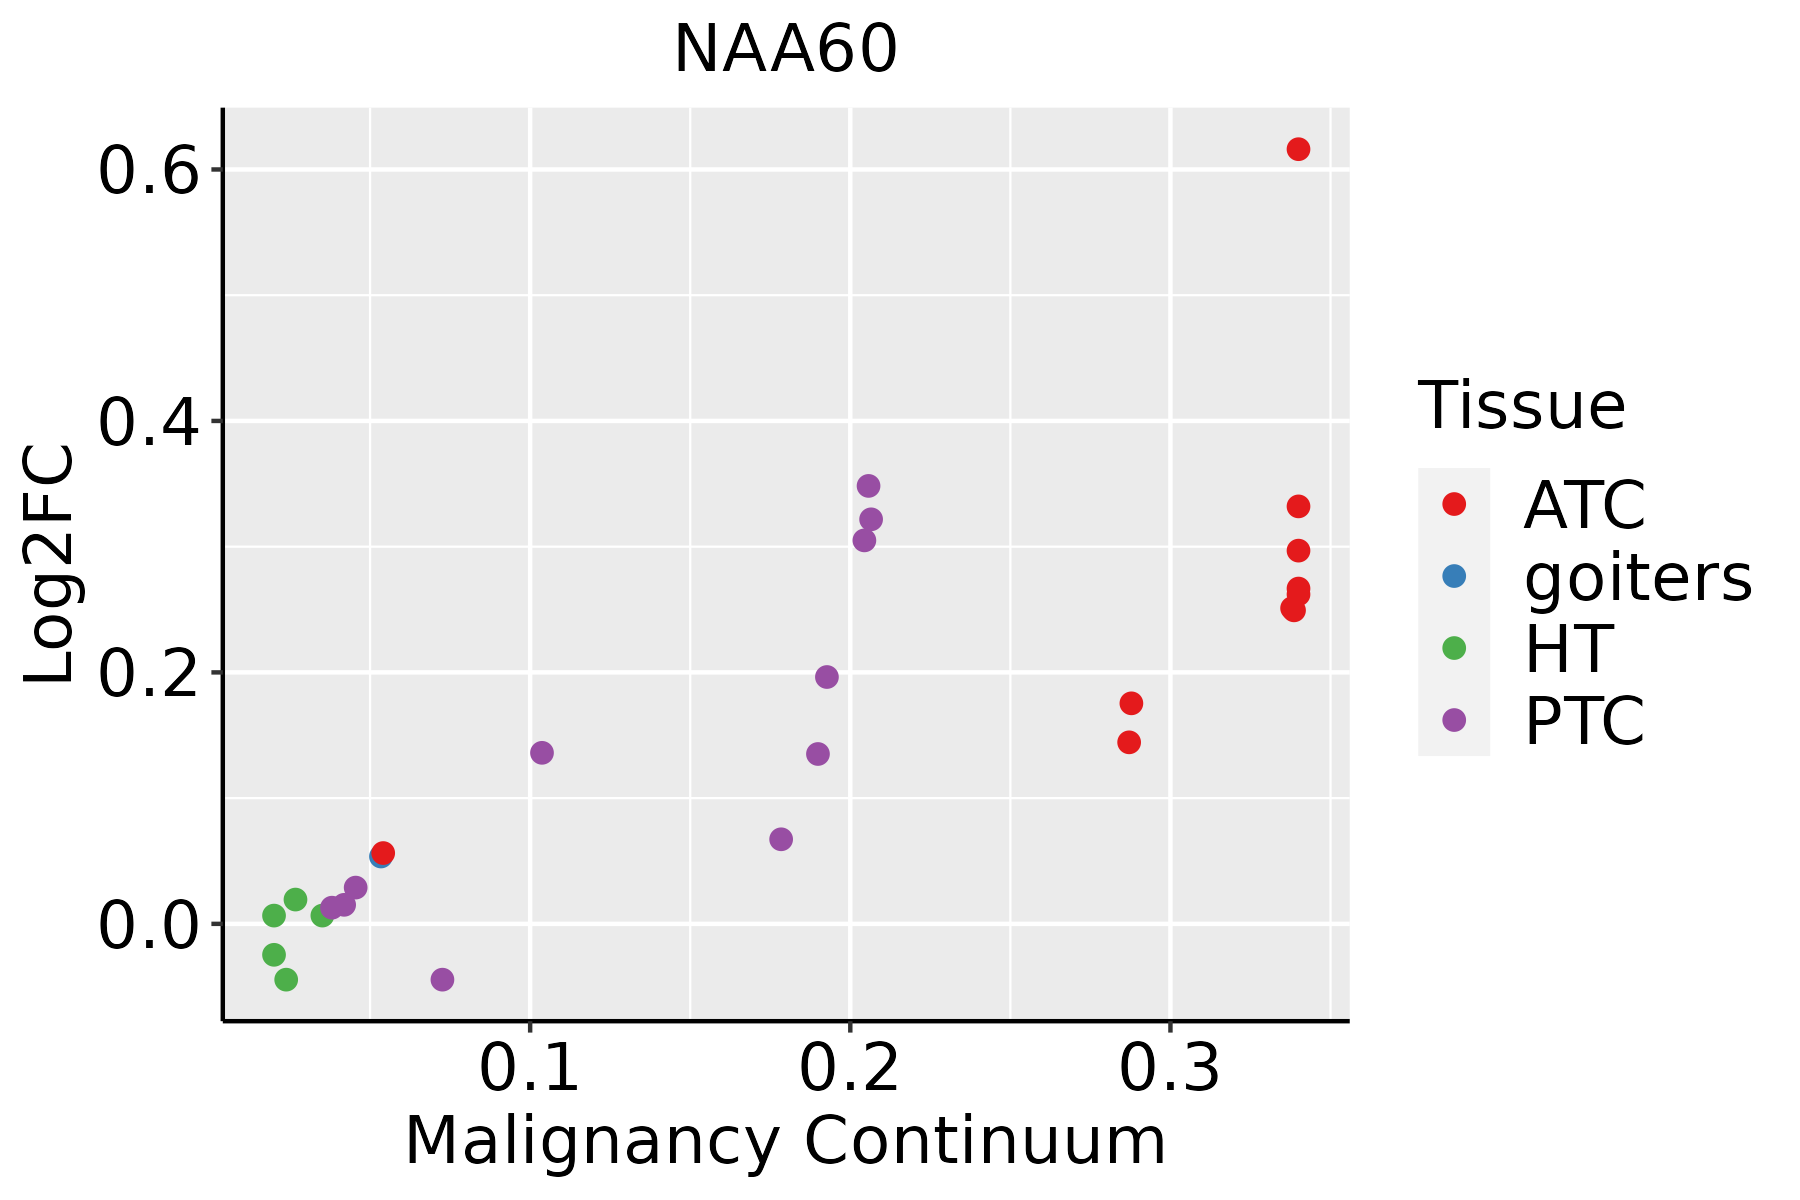 | ATC: Anaplastic thyroid cancer |
| HT: Hashimoto's thyroiditis | ||
| PTC: Papillary thyroid cancer |
| ∗log2FC in expression of this searched gene in stem-like cells from each diseased tissue sample relative to stem-like cells in normal samples in each tissue plotted against the malignancy continuum. Samples are colored based on if they are from different disease stage. |
Top |
Malignant transformation related pathway analysis |
| Find out the enriched GO biological processes and KEGG pathways involved in transition from healthy to precancer to cancer |
| Tissue | Disease Stage | Enriched GO biological Processes |
| Colorectum | AD |  |
| Colorectum | SER |  |
| Colorectum | MSS |  |
| Colorectum | MSI-H |  |
| Colorectum | FAP |  |
| ∗Top 15 enriched GO BP terms are showed in the bar plot of each disease state in each tissue. Each row represents a significant GO biological process which is colored according to the -log10(p.adjust). |
| Page: 1 2 3 4 5 6 7 8 9 |
| GO ID | Tissue | Disease Stage | Description | Gene Ratio | Bg Ratio | pvalue | p.adjust | Count |
| GO:00183937 | Thyroid | PTC | internal peptidyl-lysine acetylation | 91/5968 | 158/18723 | 2.04e-11 | 7.91e-10 | 91 |
| GO:00165737 | Thyroid | PTC | histone acetylation | 88/5968 | 152/18723 | 2.97e-11 | 1.10e-09 | 88 |
| GO:00439677 | Thyroid | PTC | histone H4 acetylation | 45/5968 | 67/18723 | 3.16e-09 | 8.63e-08 | 45 |
| GO:000632520 | Thyroid | PTC | chromatin organization | 183/5968 | 409/18723 | 2.55e-08 | 5.70e-07 | 183 |
| GO:005160420 | Thyroid | PTC | protein maturation | 132/5968 | 294/18723 | 1.71e-06 | 2.39e-05 | 132 |
| GO:00070595 | Thyroid | PTC | chromosome segregation | 146/5968 | 346/18723 | 2.99e-05 | 2.87e-04 | 146 |
| GO:00439663 | Thyroid | PTC | histone H3 acetylation | 34/5968 | 61/18723 | 9.78e-05 | 8.05e-04 | 34 |
| GO:00063385 | Thyroid | PTC | chromatin remodeling | 106/5968 | 255/18723 | 6.56e-04 | 4.13e-03 | 106 |
| GO:001657017 | Thyroid | ATC | histone modification | 243/6293 | 463/18723 | 2.23e-17 | 2.27e-15 | 243 |
| GO:000705913 | Thyroid | ATC | chromosome segregation | 183/6293 | 346/18723 | 8.03e-14 | 4.23e-12 | 183 |
| GO:001820516 | Thyroid | ATC | peptidyl-lysine modification | 193/6293 | 376/18723 | 6.92e-13 | 3.06e-11 | 193 |
| GO:000647315 | Thyroid | ATC | protein acetylation | 116/6293 | 201/18723 | 1.75e-12 | 7.33e-11 | 116 |
| GO:004354315 | Thyroid | ATC | protein acylation | 134/6293 | 243/18723 | 3.46e-12 | 1.40e-10 | 134 |
| GO:001839415 | Thyroid | ATC | peptidyl-lysine acetylation | 100/6293 | 169/18723 | 7.65e-12 | 2.91e-10 | 100 |
| GO:000647515 | Thyroid | ATC | internal protein amino acid acetylation | 93/6293 | 160/18723 | 1.59e-10 | 4.82e-09 | 93 |
| GO:001839315 | Thyroid | ATC | internal peptidyl-lysine acetylation | 92/6293 | 158/18723 | 1.75e-10 | 5.24e-09 | 92 |
| GO:001657314 | Thyroid | ATC | histone acetylation | 89/6293 | 152/18723 | 2.31e-10 | 6.72e-09 | 89 |
| GO:004396713 | Thyroid | ATC | histone H4 acetylation | 45/6293 | 67/18723 | 2.01e-08 | 3.93e-07 | 45 |
| GO:0006325110 | Thyroid | ATC | chromatin organization | 189/6293 | 409/18723 | 6.40e-08 | 1.13e-06 | 189 |
| GO:0051604110 | Thyroid | ATC | protein maturation | 136/6293 | 294/18723 | 4.00e-06 | 4.42e-05 | 136 |
| Page: 1 2 3 4 5 |
| Pathway ID | Tissue | Disease Stage | Description | Gene Ratio | Bg Ratio | pvalue | p.adjust | qvalue | Count |
| Page: 1 |
Top |
Cell-cell communication analysis |
| Identification of potential cell-cell interactions between two cell types and their ligand-receptor pairs for different disease states |
| Ligand | Receptor | LRpair | Pathway | Tissue | Disease Stage |
| Page: 1 |
Top |
Single-cell gene regulatory network inference analysis |
| Find out the significant the regulons (TFs) and the target genes of each regulon across cell types for different disease states |
| TF | Cell Type | Tissue | Disease Stage | Target Gene | RSS | Regulon Activity |
| ∗The dot plots of a searched regulon are shown for all cell subpopulations in each disease state of each tissue based on the regulon specific score inferred using pySCENIC and by calculating the average expression. |
| Page: 1 |
Top |
Somatic mutation of malignant transformation related genes |
| Annotation of somatic variants for genes involved in malignant transformation |
| Hugo Symbol | Variant Class | Variant Classification | dbSNP RS | HGVSc | HGVSp | HGVSp Short | SWISSPROT | BIOTYPE | SIFT | PolyPhen | Tumor Sample Barcode | Tissue | Histology | Sex | Age | Stage | Therapy Types | Drugs | Outcome |
| NAA60 | SNV | Missense_Mutation | c.337N>C | p.Glu113Gln | p.E113Q | Q9H7X0 | protein_coding | tolerated(0.2) | benign(0.143) | TCGA-AC-A23H-01 | Breast | breast invasive carcinoma | Female | >=65 | I/II | Unknown | Unknown | PD | |
| NAA60 | SNV | Missense_Mutation | c.479N>A | p.Arg160Lys | p.R160K | Q9H7X0 | protein_coding | tolerated(0.18) | possibly_damaging(0.56) | TCGA-AR-A0TZ-01 | Breast | breast invasive carcinoma | Female | <65 | III/IV | Unspecific | Doxorubicin | PD | |
| NAA60 | SNV | Missense_Mutation | novel | c.290N>G | p.Ser97Cys | p.S97C | Q9H7X0 | protein_coding | tolerated(0.11) | probably_damaging(0.935) | TCGA-EK-A2IP-01 | Cervix | cervical & endocervical cancer | Female | <65 | I/II | Unknown | Unknown | SD |
| NAA60 | SNV | Missense_Mutation | c.502N>G | p.Leu168Val | p.L168V | Q9H7X0 | protein_coding | deleterious(0) | probably_damaging(0.948) | TCGA-EK-A2IP-01 | Cervix | cervical & endocervical cancer | Female | <65 | I/II | Unknown | Unknown | SD | |
| NAA60 | SNV | Missense_Mutation | c.362N>T | p.Ser121Phe | p.S121F | Q9H7X0 | protein_coding | deleterious(0) | probably_damaging(0.997) | TCGA-EK-A2R7-01 | Cervix | cervical & endocervical cancer | Female | <65 | I/II | Unknown | Unknown | SD | |
| NAA60 | SNV | Missense_Mutation | c.518N>G | p.Ser173Cys | p.S173C | Q9H7X0 | protein_coding | tolerated(0.15) | possibly_damaging(0.706) | TCGA-EK-A2R7-01 | Cervix | cervical & endocervical cancer | Female | <65 | I/II | Unknown | Unknown | SD | |
| NAA60 | SNV | Missense_Mutation | novel | c.177C>A | p.Phe59Leu | p.F59L | Q9H7X0 | protein_coding | tolerated(0.18) | benign(0.113) | TCGA-CA-6717-01 | Colorectum | colon adenocarcinoma | Male | <65 | I/II | Chemotherapy | oxaliplatin | CR |
| NAA60 | SNV | Missense_Mutation | rs779804473 | c.328N>A | p.Val110Ile | p.V110I | Q9H7X0 | protein_coding | deleterious(0.01) | probably_damaging(0.983) | TCGA-A5-A0VP-01 | Endometrium | uterine corpus endometrioid carcinoma | Female | >=65 | I/II | Unknown | Unknown | SD |
| NAA60 | SNV | Missense_Mutation | c.452N>G | p.Asn151Ser | p.N151S | Q9H7X0 | protein_coding | tolerated(0.49) | benign(0.007) | TCGA-AP-A056-01 | Endometrium | uterine corpus endometrioid carcinoma | Female | <65 | I/II | Unknown | Unknown | SD | |
| NAA60 | SNV | Missense_Mutation | c.568G>A | p.Gly190Ser | p.G190S | Q9H7X0 | protein_coding | deleterious(0.01) | possibly_damaging(0.858) | TCGA-AP-A0LG-01 | Endometrium | uterine corpus endometrioid carcinoma | Female | <65 | I/II | Unknown | Unknown | SD |
| Page: 1 2 |
Top |
Related drugs of malignant transformation related genes |
| Identification of chemicals and drugs interact with genes involved in malignant transfromation |
| (DGIdb 4.0) |
| Entrez ID | Symbol | Category | Interaction Types | Drug Claim Name | Drug Name | PMIDs |
| Page: 1 |

Copyright 2023-Present -The University of Texas Health Science Center at Houston |