
|
|||||
|
 | |
| |
| |
| |
| |
| |
|
Gene: N4BP2 |
Gene summary for N4BP2 |
| Gene information | Species | Human | Gene symbol | N4BP2 | Gene ID | 55728 |
| Gene name | NEDD4 binding protein 2 | |
| Gene Alias | B3BP | |
| Cytomap | 4p14 | |
| Gene Type | protein-coding | GO ID | GO:0006139 | UniProtAcc | B2ZZ87 |
Top |
Malignant transformation analysis |
| Identification of the aberrant gene expression in precancerous and cancerous lesions by comparing the gene expression of stem-like cells in diseased tissues with normal stem cells |
| Entrez ID | Symbol | Replicates | Species | Organ | Tissue | Adj P-value | Log2FC | Malignancy |
| 55728 | N4BP2 | EEC-subject3 | Human | Endometrium | EEC | 6.73e-03 | -5.07e-02 | -0.2525 |
| 55728 | N4BP2 | GSM6177620_NYU_UCEC1_lib1_lib1 | Human | Endometrium | EEC | 5.90e-11 | -1.41e-02 | -0.1869 |
| 55728 | N4BP2 | GSM6177620_NYU_UCEC1_lib2_lib2 | Human | Endometrium | EEC | 1.21e-14 | -2.99e-02 | -0.1875 |
| 55728 | N4BP2 | GSM6177620_NYU_UCEC1_lib3_lib3 | Human | Endometrium | EEC | 1.96e-11 | -8.39e-02 | -0.1883 |
| 55728 | N4BP2 | GSM6177621_NYU_UCEC2_lib1_lib1 | Human | Endometrium | EEC | 2.93e-06 | -4.73e-02 | -0.1934 |
| 55728 | N4BP2 | GSM6177622_NYU_UCEC3_lib1_lib1 | Human | Endometrium | EEC | 1.20e-07 | -1.22e-01 | -0.1917 |
| 55728 | N4BP2 | GSM6177622_NYU_UCEC3_lib2_lib2 | Human | Endometrium | EEC | 3.69e-14 | -3.20e-02 | -0.1916 |
| 55728 | N4BP2 | NAFLD1 | Human | Liver | NAFLD | 5.33e-07 | 6.82e-01 | -0.04 |
| 55728 | N4BP2 | HCC1_Meng | Human | Liver | HCC | 2.78e-60 | 1.58e-01 | 0.0246 |
| 55728 | N4BP2 | HCC2_Meng | Human | Liver | HCC | 1.14e-10 | 6.00e-02 | 0.0107 |
| 55728 | N4BP2 | HCC1 | Human | Liver | HCC | 6.25e-12 | 4.20e+00 | 0.5336 |
| 55728 | N4BP2 | HCC2 | Human | Liver | HCC | 1.68e-22 | 3.73e+00 | 0.5341 |
| 55728 | N4BP2 | HCC5 | Human | Liver | HCC | 1.96e-06 | 1.79e+00 | 0.4932 |
| 55728 | N4BP2 | S015 | Human | Liver | HCC | 7.25e-03 | 2.81e-01 | 0.2375 |
| 55728 | N4BP2 | male-WTA | Human | Thyroid | PTC | 1.29e-06 | 6.71e-02 | 0.1037 |
| 55728 | N4BP2 | PTC01 | Human | Thyroid | PTC | 3.08e-02 | 1.10e-01 | 0.1899 |
| 55728 | N4BP2 | PTC04 | Human | Thyroid | PTC | 2.22e-08 | 2.28e-01 | 0.1927 |
| 55728 | N4BP2 | PTC05 | Human | Thyroid | PTC | 5.68e-07 | 3.55e-01 | 0.2065 |
| 55728 | N4BP2 | PTC06 | Human | Thyroid | PTC | 1.23e-24 | 5.37e-01 | 0.2057 |
| 55728 | N4BP2 | PTC07 | Human | Thyroid | PTC | 1.54e-23 | 3.53e-01 | 0.2044 |
| Page: 1 2 |
| Tissue | Expression Dynamics | Abbreviation |
| Endometrium | 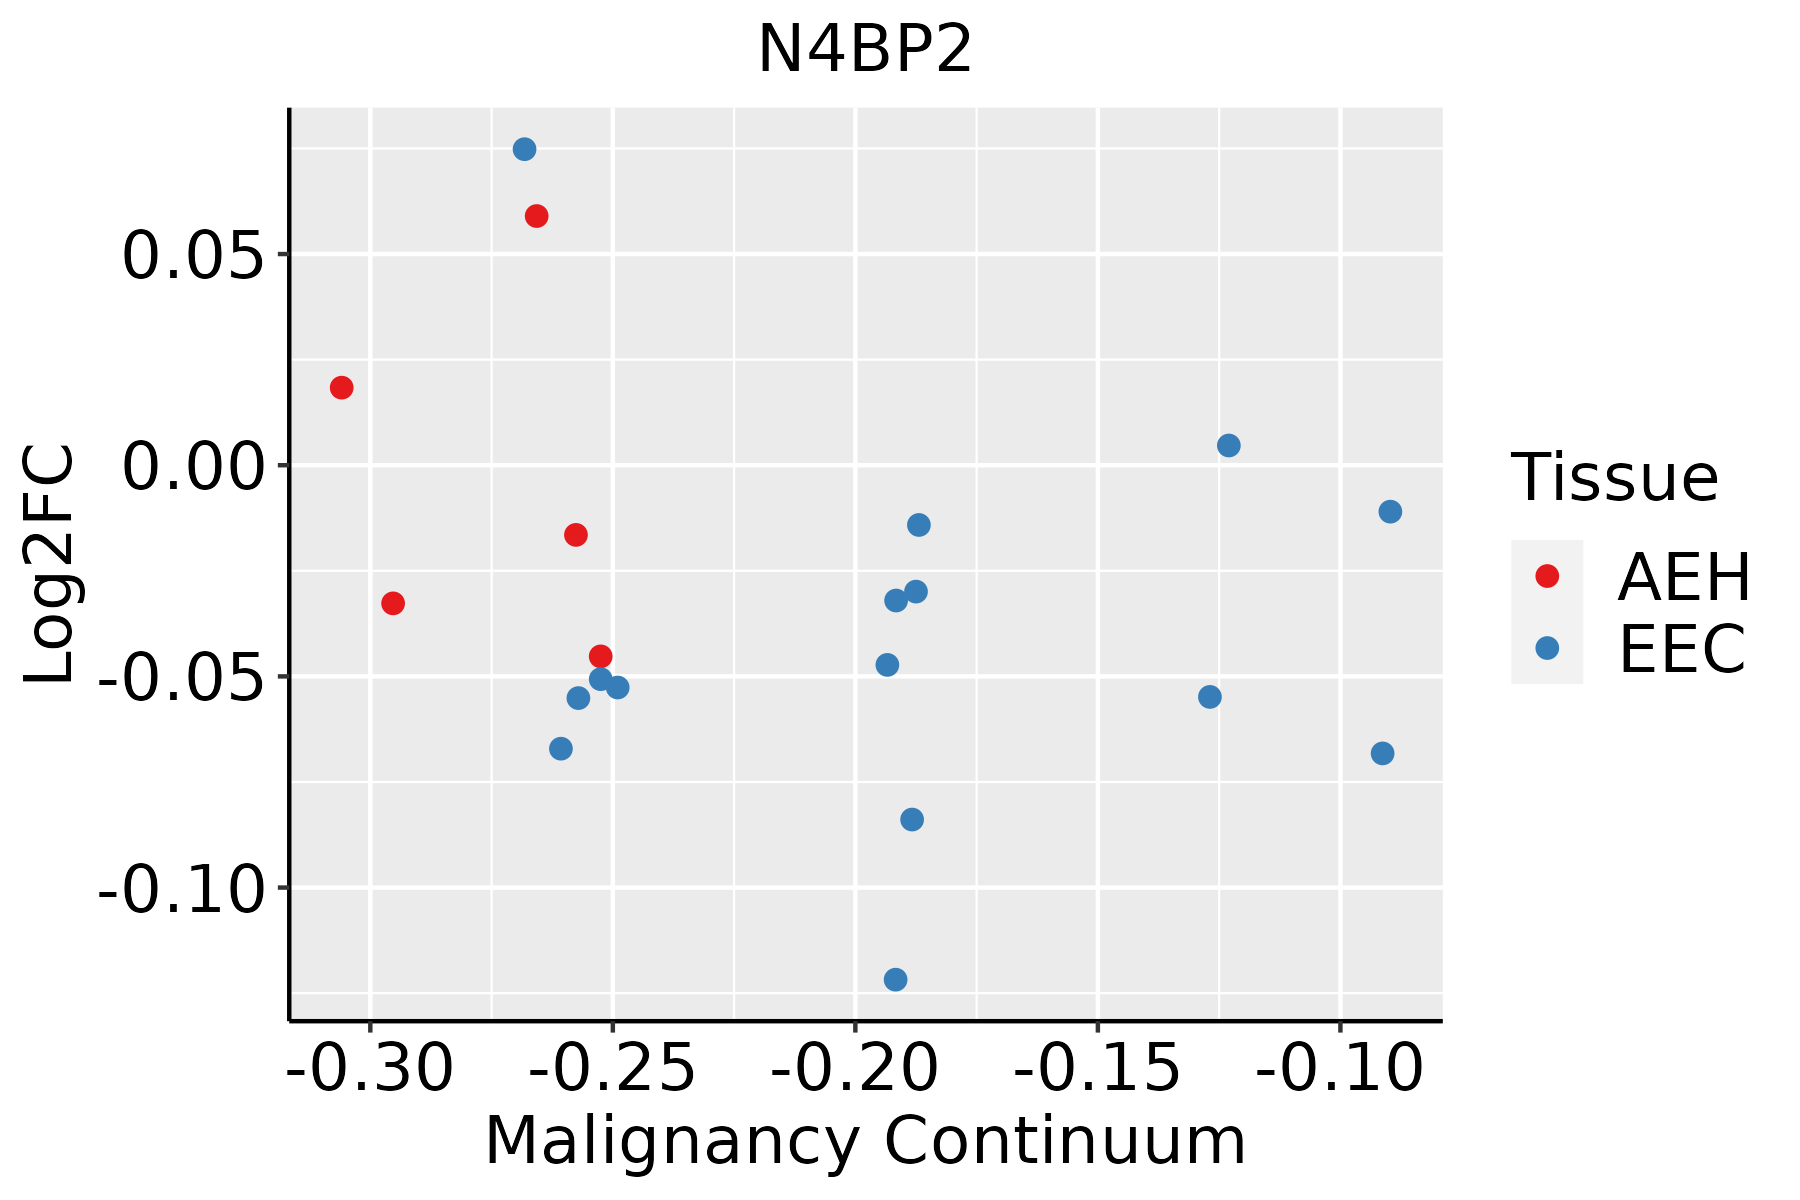 | AEH: Atypical endometrial hyperplasia |
| EEC: Endometrioid Cancer | ||
| Liver | 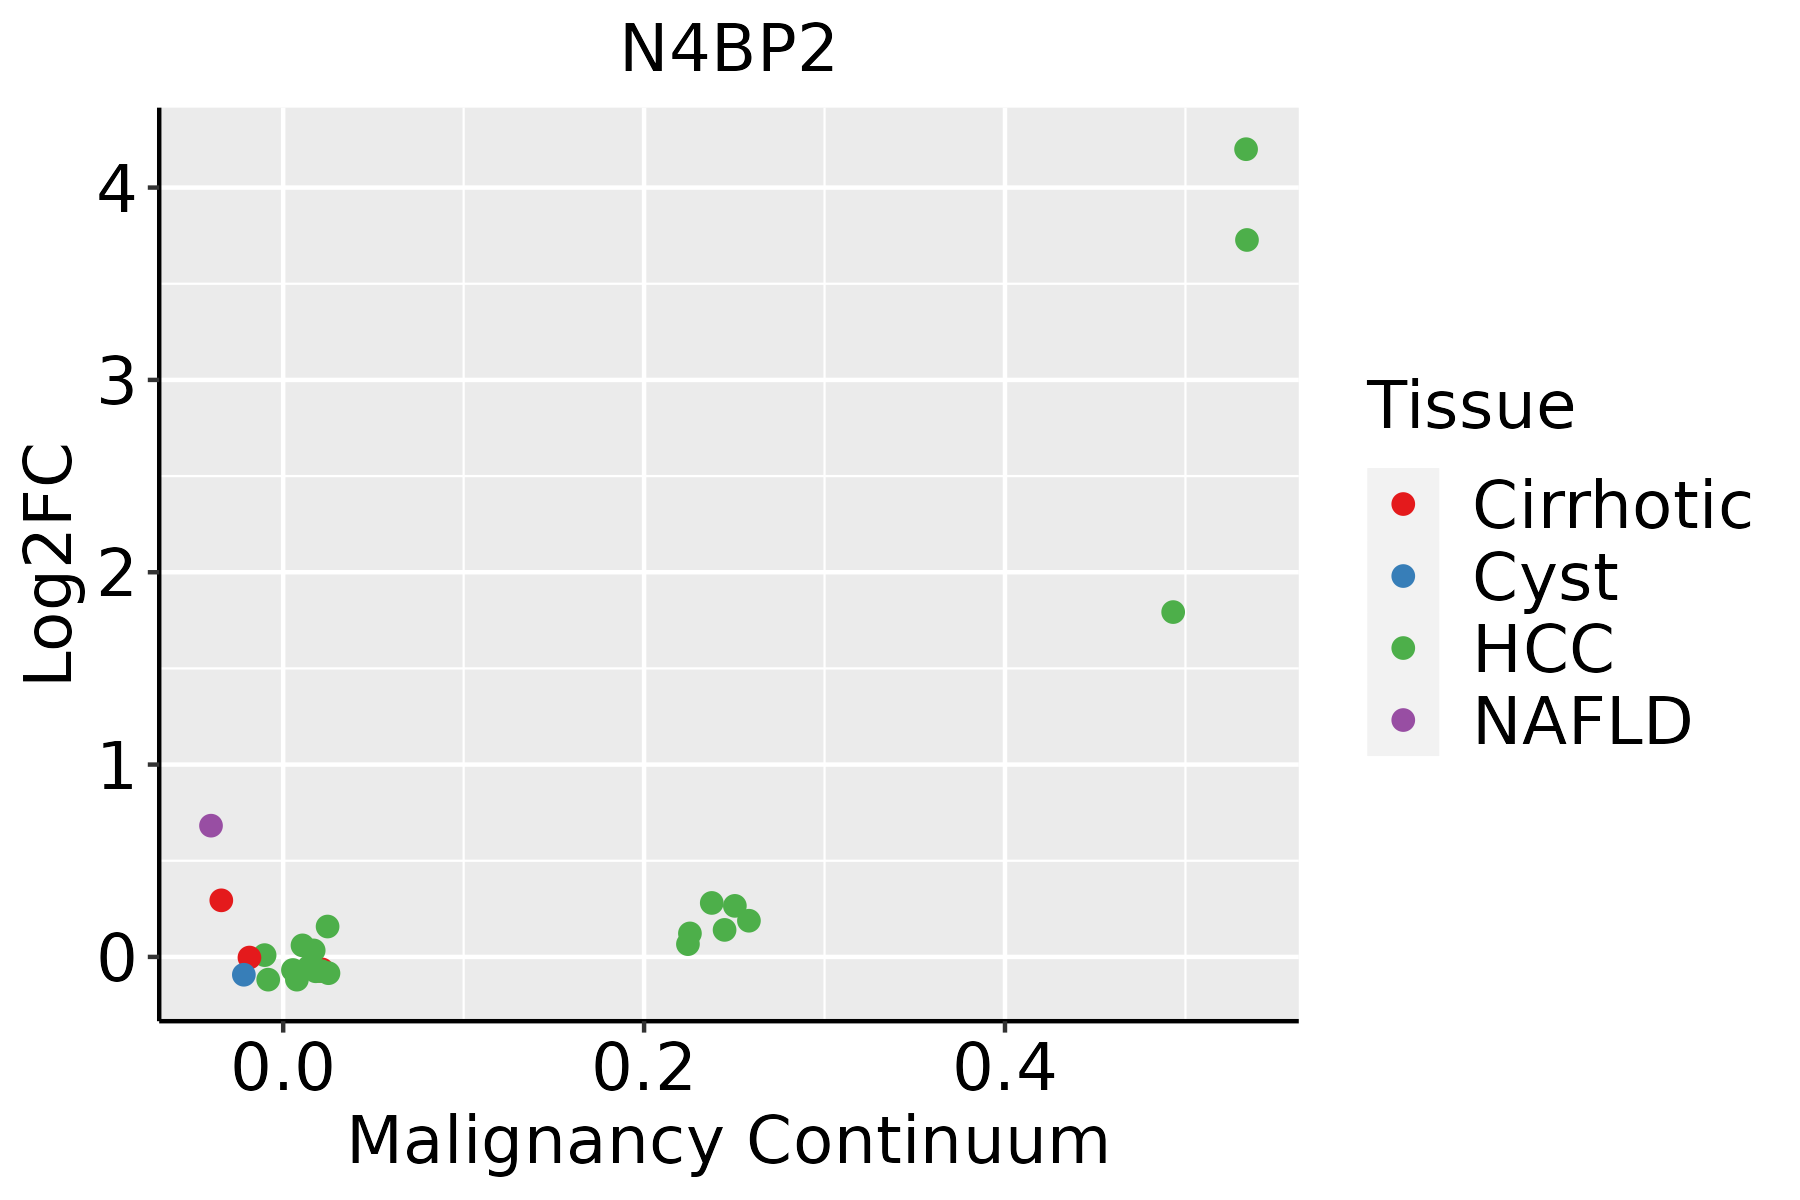 | HCC: Hepatocellular carcinoma |
| NAFLD: Non-alcoholic fatty liver disease | ||
| Thyroid | 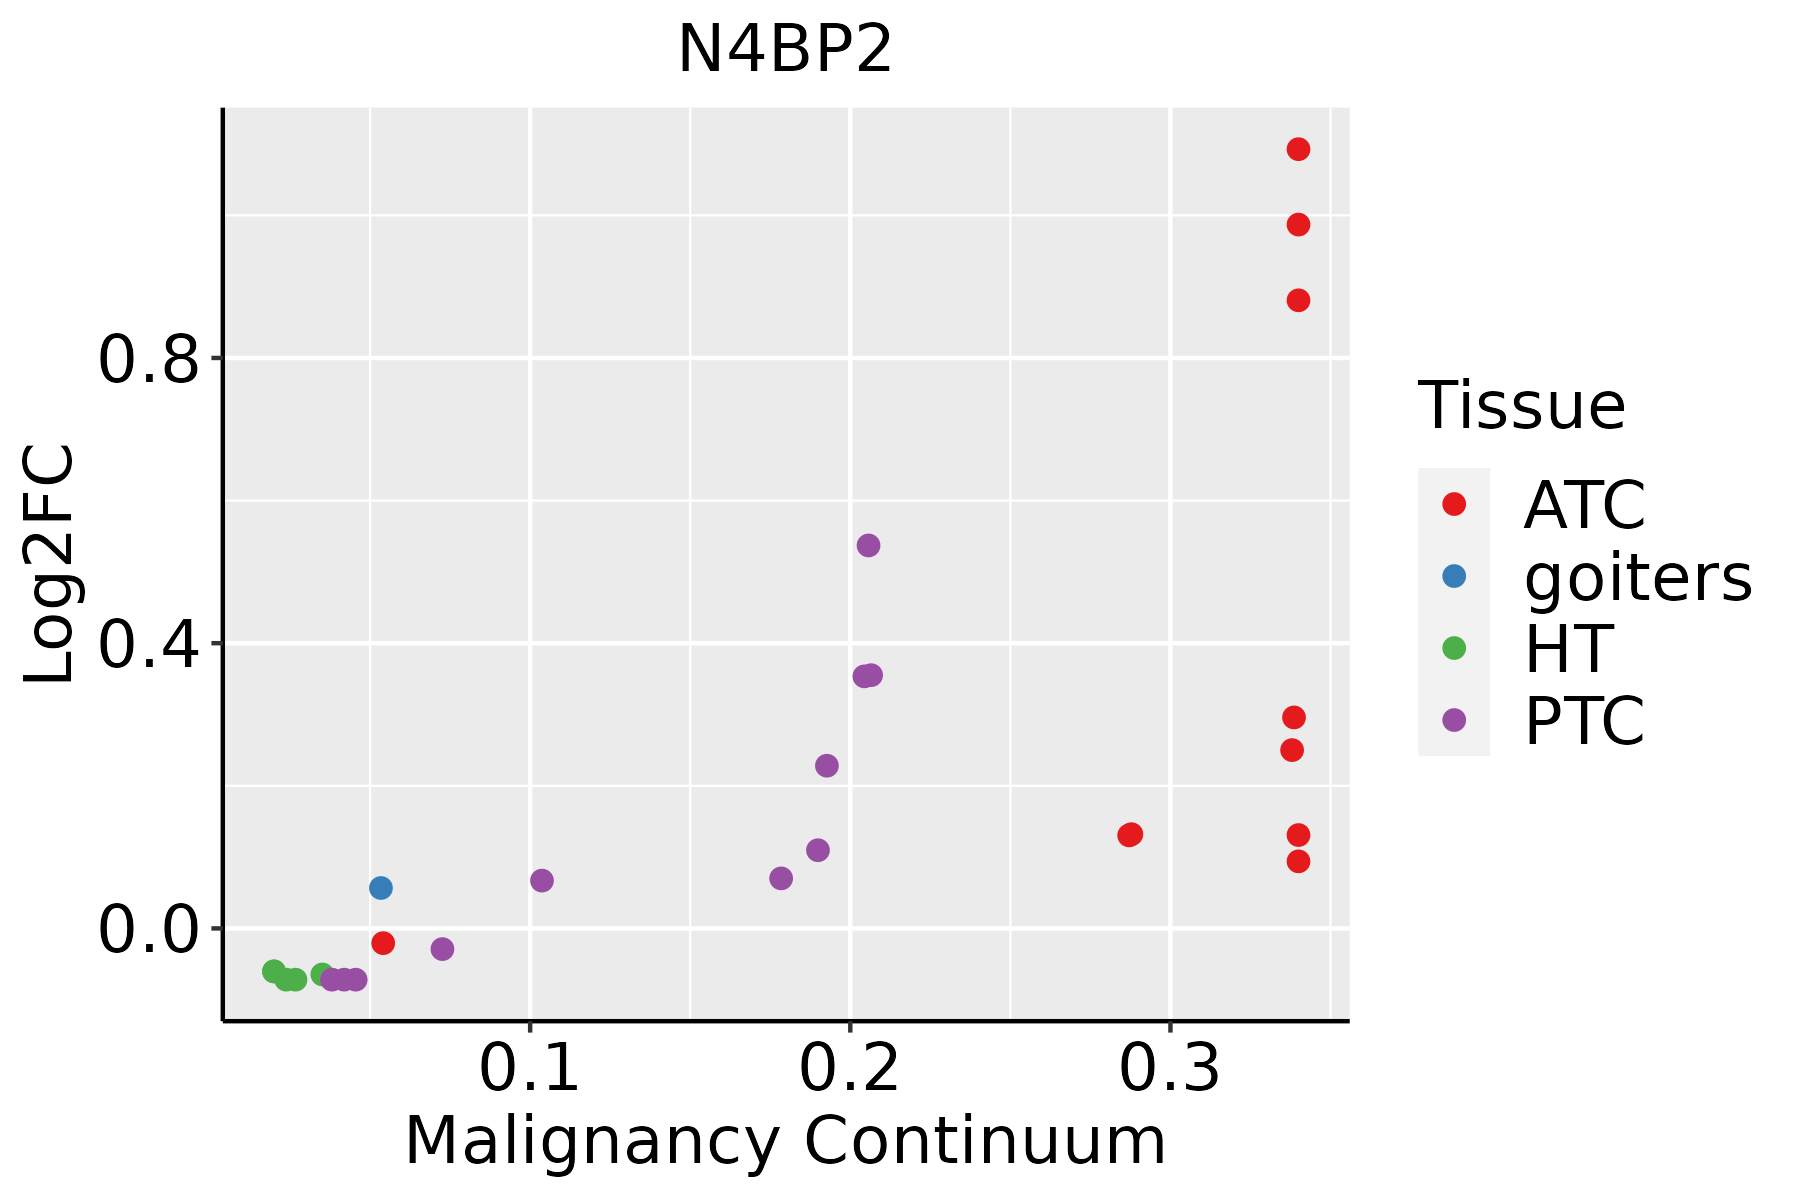 | ATC: Anaplastic thyroid cancer |
| HT: Hashimoto's thyroiditis | ||
| PTC: Papillary thyroid cancer |
| ∗log2FC in expression of this searched gene in stem-like cells from each diseased tissue sample relative to stem-like cells in normal samples in each tissue plotted against the malignancy continuum. Samples are colored based on if they are from different disease stage. |
Top |
Malignant transformation related pathway analysis |
| Find out the enriched GO biological processes and KEGG pathways involved in transition from healthy to precancer to cancer |
| Tissue | Disease Stage | Enriched GO biological Processes |
| Colorectum | AD |  |
| Colorectum | SER |  |
| Colorectum | MSS |  |
| Colorectum | MSI-H |  |
| Colorectum | FAP |  |
| ∗Top 15 enriched GO BP terms are showed in the bar plot of each disease state in each tissue. Each row represents a significant GO biological process which is colored according to the -log10(p.adjust). |
| Page: 1 2 3 4 5 6 7 8 9 |
| GO ID | Tissue | Disease Stage | Description | Gene Ratio | Bg Ratio | pvalue | p.adjust | Count |
| GO:20007374 | Oral cavity | OSCC | negative regulation of stem cell differentiation | 15/7305 | 23/18723 | 9.84e-03 | 3.46e-02 | 15 |
| GO:00022445 | Oral cavity | OSCC | hematopoietic progenitor cell differentiation | 57/7305 | 114/18723 | 1.09e-02 | 3.71e-02 | 57 |
| GO:00488637 | Oral cavity | OSCC | stem cell differentiation | 96/7305 | 206/18723 | 1.55e-02 | 4.99e-02 | 96 |
| GO:000170123 | Oral cavity | EOLP | in utero embryonic development | 72/2218 | 367/18723 | 1.02e-05 | 1.83e-04 | 72 |
| GO:000170132 | Oral cavity | NEOLP | in utero embryonic development | 76/2005 | 367/18723 | 1.11e-08 | 5.44e-07 | 76 |
| GO:200073713 | Oral cavity | NEOLP | negative regulation of stem cell differentiation | 10/2005 | 23/18723 | 5.95e-05 | 7.97e-04 | 10 |
| GO:200073621 | Oral cavity | NEOLP | regulation of stem cell differentiation | 17/2005 | 58/18723 | 8.04e-05 | 1.01e-03 | 17 |
| GO:004886316 | Oral cavity | NEOLP | stem cell differentiation | 38/2005 | 206/18723 | 5.82e-04 | 5.05e-03 | 38 |
| GO:000224412 | Oral cavity | NEOLP | hematopoietic progenitor cell differentiation | 24/2005 | 114/18723 | 8.82e-04 | 6.94e-03 | 24 |
| GO:19015323 | Oral cavity | NEOLP | regulation of hematopoietic progenitor cell differentiation | 10/2005 | 32/18723 | 1.36e-03 | 9.75e-03 | 10 |
| GO:19020363 | Oral cavity | NEOLP | regulation of hematopoietic stem cell differentiation | 6/2005 | 14/18723 | 2.10e-03 | 1.38e-02 | 6 |
| GO:00602184 | Oral cavity | NEOLP | hematopoietic stem cell differentiation | 9/2005 | 30/18723 | 3.21e-03 | 1.92e-02 | 9 |
| GO:000170110 | Prostate | BPH | in utero embryonic development | 104/3107 | 367/18723 | 9.17e-09 | 3.10e-07 | 104 |
| GO:19015322 | Prostate | BPH | regulation of hematopoietic progenitor cell differentiation | 15/3107 | 32/18723 | 6.38e-05 | 6.36e-04 | 15 |
| GO:20007373 | Prostate | BPH | negative regulation of stem cell differentiation | 12/3107 | 23/18723 | 9.46e-05 | 8.88e-04 | 12 |
| GO:00488636 | Prostate | BPH | stem cell differentiation | 55/3107 | 206/18723 | 1.56e-04 | 1.36e-03 | 55 |
| GO:20007363 | Prostate | BPH | regulation of stem cell differentiation | 21/3107 | 58/18723 | 2.44e-04 | 1.94e-03 | 21 |
| GO:00022444 | Prostate | BPH | hematopoietic progenitor cell differentiation | 34/3107 | 114/18723 | 3.08e-04 | 2.37e-03 | 34 |
| GO:19020362 | Prostate | BPH | regulation of hematopoietic stem cell differentiation | 8/3107 | 14/18723 | 6.63e-04 | 4.46e-03 | 8 |
| GO:00602183 | Prostate | BPH | hematopoietic stem cell differentiation | 12/3107 | 30/18723 | 1.94e-03 | 1.10e-02 | 12 |
| Page: 1 2 3 4 5 6 7 |
| Pathway ID | Tissue | Disease Stage | Description | Gene Ratio | Bg Ratio | pvalue | p.adjust | qvalue | Count |
| Page: 1 |
Top |
Cell-cell communication analysis |
| Identification of potential cell-cell interactions between two cell types and their ligand-receptor pairs for different disease states |
| Ligand | Receptor | LRpair | Pathway | Tissue | Disease Stage |
| Page: 1 |
Top |
Single-cell gene regulatory network inference analysis |
| Find out the significant the regulons (TFs) and the target genes of each regulon across cell types for different disease states |
| TF | Cell Type | Tissue | Disease Stage | Target Gene | RSS | Regulon Activity |
| ∗The dot plots of a searched regulon are shown for all cell subpopulations in each disease state of each tissue based on the regulon specific score inferred using pySCENIC and by calculating the average expression. |
| Page: 1 |
Top |
Somatic mutation of malignant transformation related genes |
| Annotation of somatic variants for genes involved in malignant transformation |
| Hugo Symbol | Variant Class | Variant Classification | dbSNP RS | HGVSc | HGVSp | HGVSp Short | SWISSPROT | BIOTYPE | SIFT | PolyPhen | Tumor Sample Barcode | Tissue | Histology | Sex | Age | Stage | Therapy Types | Drugs | Outcome |
| N4BP2 | SNV | Missense_Mutation | c.4384N>G | p.Gln1462Glu | p.Q1462E | Q86UW6 | protein_coding | deleterious(0.03) | benign(0.03) | TCGA-A2-A0EY-01 | Breast | breast invasive carcinoma | Female | <65 | I/II | Chemotherapy | adriamycin | SD | |
| N4BP2 | SNV | Missense_Mutation | rs201204950 | c.4933C>T | p.Arg1645Trp | p.R1645W | Q86UW6 | protein_coding | deleterious(0) | probably_damaging(0.916) | TCGA-AN-A046-01 | Breast | breast invasive carcinoma | Female | >=65 | I/II | Unknown | Unknown | SD |
| N4BP2 | SNV | Missense_Mutation | c.935N>T | p.Thr312Ile | p.T312I | Q86UW6 | protein_coding | tolerated(0.33) | benign(0.001) | TCGA-AN-A0FZ-01 | Breast | breast invasive carcinoma | Female | <65 | III/IV | Unknown | Unknown | SD | |
| N4BP2 | SNV | Missense_Mutation | c.4277C>T | p.Ser1426Phe | p.S1426F | Q86UW6 | protein_coding | deleterious(0) | probably_damaging(0.994) | TCGA-AR-A0TX-01 | Breast | breast invasive carcinoma | Female | <65 | I/II | Unknown | Unknown | SD | |
| N4BP2 | SNV | Missense_Mutation | c.4859N>T | p.Asp1620Val | p.D1620V | Q86UW6 | protein_coding | deleterious(0) | probably_damaging(0.952) | TCGA-BH-A203-01 | Breast | breast invasive carcinoma | Female | >=65 | I/II | Unknown | Unknown | PD | |
| N4BP2 | SNV | Missense_Mutation | c.2320N>C | p.Ser774Pro | p.S774P | Q86UW6 | protein_coding | deleterious(0.03) | benign(0.023) | TCGA-C8-A1HK-01 | Breast | breast invasive carcinoma | Female | <65 | I/II | Unknown | Unknown | SD | |
| N4BP2 | SNV | Missense_Mutation | c.3085N>C | p.Glu1029Gln | p.E1029Q | Q86UW6 | protein_coding | deleterious(0) | probably_damaging(0.968) | TCGA-C8-A8HQ-01 | Breast | breast invasive carcinoma | Female | <65 | I/II | Unknown | Unknown | SD | |
| N4BP2 | SNV | Missense_Mutation | c.2156N>A | p.Ser719Tyr | p.S719Y | Q86UW6 | protein_coding | tolerated(0.12) | benign(0.086) | TCGA-D8-A1JG-01 | Breast | breast invasive carcinoma | Female | <65 | I/II | Chemotherapy | doxorubicin | SD | |
| N4BP2 | SNV | Missense_Mutation | c.1880N>C | p.Leu627Ser | p.L627S | Q86UW6 | protein_coding | tolerated(0.16) | benign(0) | TCGA-D8-A1XK-01 | Breast | breast invasive carcinoma | Female | <65 | I/II | Chemotherapy | doxorubicine+cyclophosphamide | SD | |
| N4BP2 | SNV | Missense_Mutation | novel | c.70G>A | p.Val24Ile | p.V24I | Q86UW6 | protein_coding | deleterious(0.01) | benign(0.041) | TCGA-2W-A8YY-01 | Cervix | cervical & endocervical cancer | Female | <65 | I/II | Chemotherapy | cisplatin | CR |
| Page: 1 2 3 4 5 6 7 8 9 10 11 12 13 14 15 16 |
Top |
Related drugs of malignant transformation related genes |
| Identification of chemicals and drugs interact with genes involved in malignant transfromation |
| (DGIdb 4.0) |
| Entrez ID | Symbol | Category | Interaction Types | Drug Claim Name | Drug Name | PMIDs |
| Page: 1 |

Copyright 2023-Present -The University of Texas Health Science Center at Houston |