
|
|||||
|
 | |
| |
| |
| |
| |
| |
|
Gene: MYO9A |
Gene summary for MYO9A |
| Gene information | Species | Human | Gene symbol | MYO9A | Gene ID | 4649 |
| Gene name | myosin IXA | |
| Gene Alias | CMS24 | |
| Cytomap | 15q23 | |
| Gene Type | protein-coding | GO ID | GO:0000902 | UniProtAcc | B2RTY4 |
Top |
Malignant transformation analysis |
| Identification of the aberrant gene expression in precancerous and cancerous lesions by comparing the gene expression of stem-like cells in diseased tissues with normal stem cells |
| Entrez ID | Symbol | Replicates | Species | Organ | Tissue | Adj P-value | Log2FC | Malignancy |
| 4649 | MYO9A | HTA11_3410_2000001011 | Human | Colorectum | AD | 3.30e-26 | -7.74e-01 | 0.0155 |
| 4649 | MYO9A | HTA11_2487_2000001011 | Human | Colorectum | SER | 2.62e-07 | -6.48e-01 | -0.1808 |
| 4649 | MYO9A | HTA11_2951_2000001011 | Human | Colorectum | AD | 3.04e-07 | -1.08e+00 | 0.0216 |
| 4649 | MYO9A | HTA11_3361_2000001011 | Human | Colorectum | AD | 7.02e-11 | -8.07e-01 | -0.1207 |
| 4649 | MYO9A | HTA11_696_2000001011 | Human | Colorectum | AD | 7.50e-16 | -5.75e-01 | -0.1464 |
| 4649 | MYO9A | HTA11_866_2000001011 | Human | Colorectum | AD | 1.35e-03 | -3.69e-01 | -0.1001 |
| 4649 | MYO9A | HTA11_2992_2000001011 | Human | Colorectum | SER | 2.88e-03 | -7.24e-01 | -0.1706 |
| 4649 | MYO9A | HTA11_5212_2000001011 | Human | Colorectum | AD | 1.56e-04 | -7.06e-01 | -0.2061 |
| 4649 | MYO9A | HTA11_5216_2000001011 | Human | Colorectum | SER | 1.74e-02 | -7.57e-01 | -0.1462 |
| 4649 | MYO9A | HTA11_7862_2000001011 | Human | Colorectum | AD | 1.87e-04 | -6.49e-01 | -0.0179 |
| 4649 | MYO9A | HTA11_866_3004761011 | Human | Colorectum | AD | 5.01e-22 | -8.06e-01 | 0.096 |
| 4649 | MYO9A | HTA11_4255_2000001011 | Human | Colorectum | SER | 4.14e-03 | -6.32e-01 | 0.0446 |
| 4649 | MYO9A | HTA11_8622_2000001021 | Human | Colorectum | SER | 6.02e-05 | -8.00e-01 | 0.0528 |
| 4649 | MYO9A | HTA11_10711_2000001011 | Human | Colorectum | AD | 3.90e-09 | -6.62e-01 | 0.0338 |
| 4649 | MYO9A | HTA11_7696_3000711011 | Human | Colorectum | AD | 1.37e-18 | -6.00e-01 | 0.0674 |
| 4649 | MYO9A | HTA11_6818_2000001021 | Human | Colorectum | AD | 1.27e-04 | -5.61e-01 | 0.0588 |
| 4649 | MYO9A | HTA11_99999970781_79442 | Human | Colorectum | MSS | 4.46e-37 | -7.27e-01 | 0.294 |
| 4649 | MYO9A | HTA11_99999971662_82457 | Human | Colorectum | MSS | 4.81e-37 | -8.11e-01 | 0.3859 |
| 4649 | MYO9A | HTA11_99999973899_84307 | Human | Colorectum | MSS | 3.02e-04 | -6.51e-01 | 0.2585 |
| 4649 | MYO9A | HTA11_99999974143_84620 | Human | Colorectum | MSS | 1.11e-47 | -8.79e-01 | 0.3005 |
| Page: 1 2 3 4 5 6 7 8 9 10 |
| Tissue | Expression Dynamics | Abbreviation |
| Colorectum (GSE201348) | 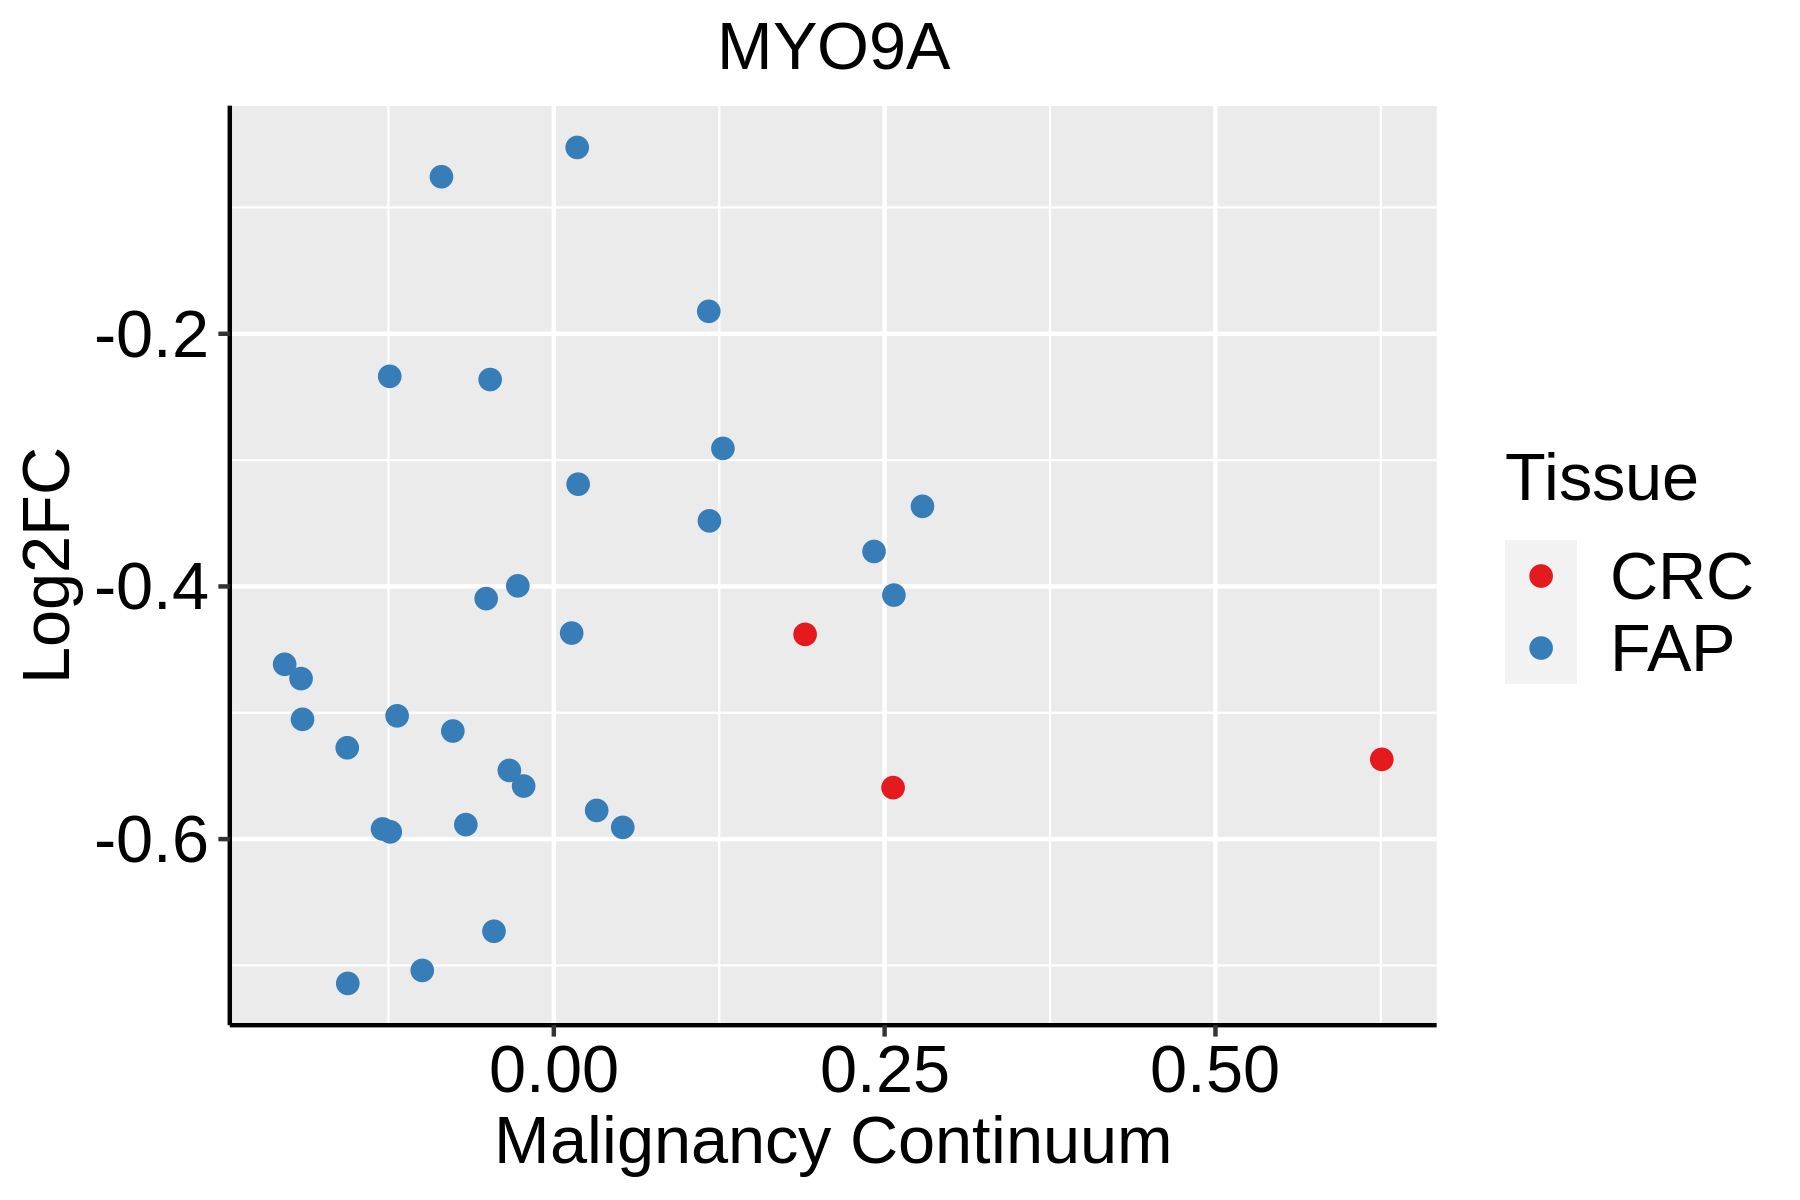 | FAP: Familial adenomatous polyposis |
| CRC: Colorectal cancer | ||
| Colorectum (HTA11) |  | AD: Adenomas |
| SER: Sessile serrated lesions | ||
| MSI-H: Microsatellite-high colorectal cancer | ||
| MSS: Microsatellite stable colorectal cancer | ||
| Endometrium | 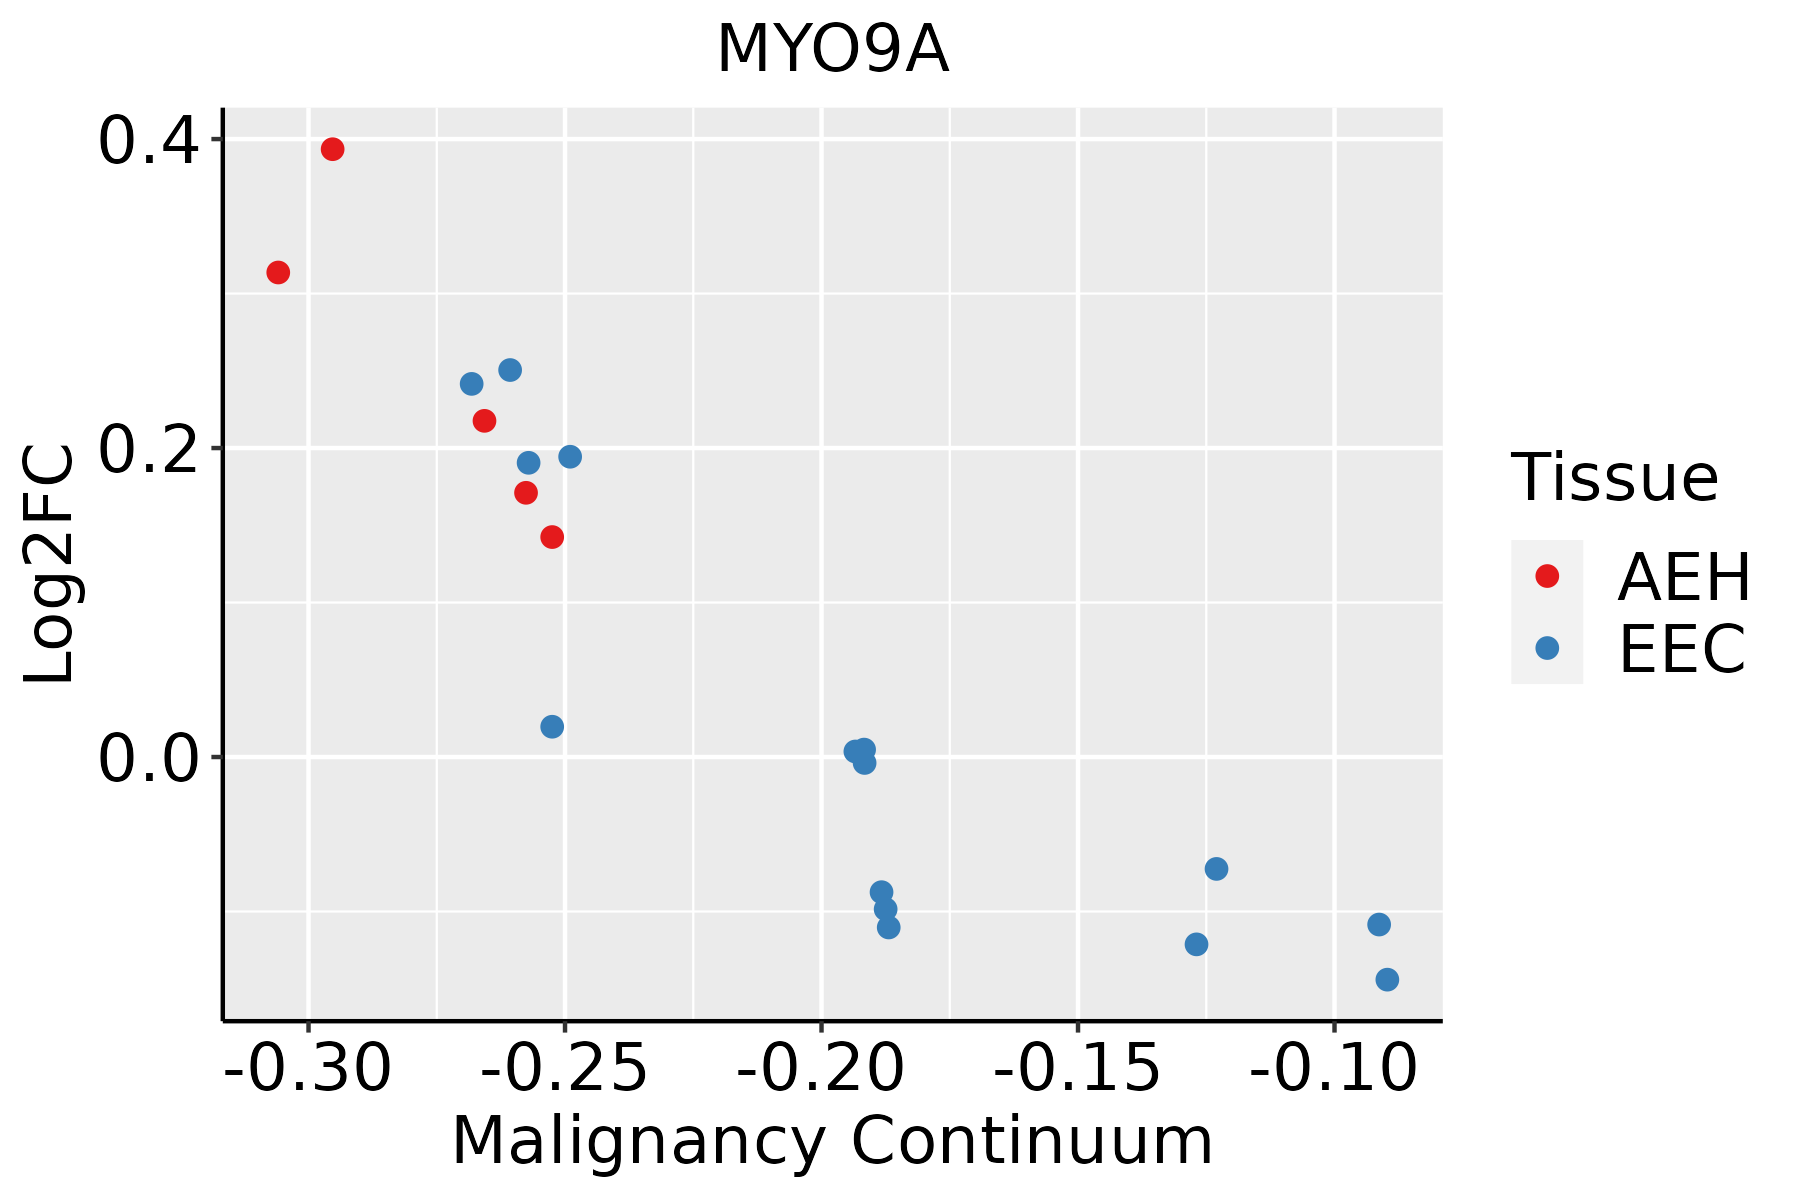 | AEH: Atypical endometrial hyperplasia |
| EEC: Endometrioid Cancer | ||
| Esophagus |  | ESCC: Esophageal squamous cell carcinoma |
| HGIN: High-grade intraepithelial neoplasias | ||
| LGIN: Low-grade intraepithelial neoplasias | ||
| Lung |  | AAH: Atypical adenomatous hyperplasia |
| AIS: Adenocarcinoma in situ | ||
| IAC: Invasive lung adenocarcinoma | ||
| MIA: Minimally invasive adenocarcinoma | ||
| Prostate | 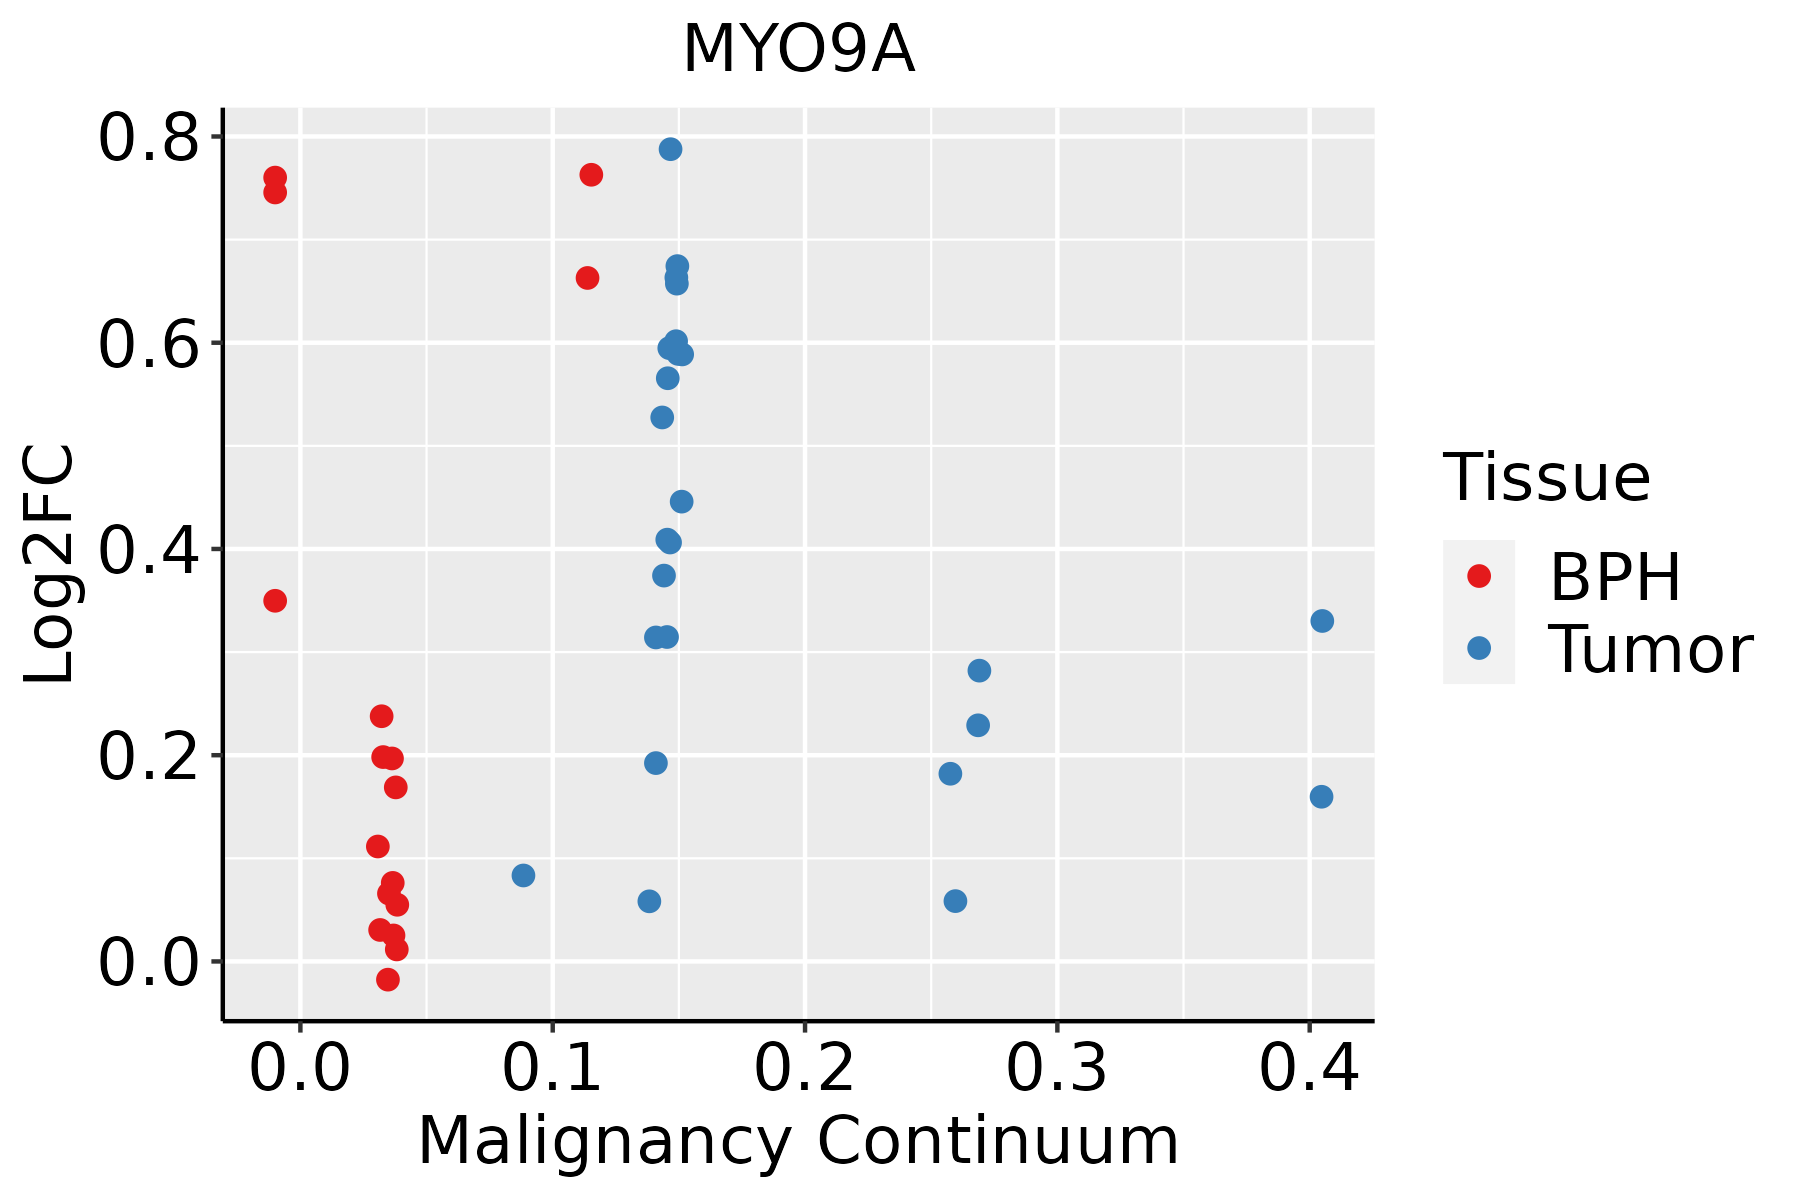 | BPH: Benign Prostatic Hyperplasia |
| Thyroid |  | ATC: Anaplastic thyroid cancer |
| HT: Hashimoto's thyroiditis | ||
| PTC: Papillary thyroid cancer |
| ∗log2FC in expression of this searched gene in stem-like cells from each diseased tissue sample relative to stem-like cells in normal samples in each tissue plotted against the malignancy continuum. Samples are colored based on if they are from different disease stage. |
Top |
Malignant transformation related pathway analysis |
| Find out the enriched GO biological processes and KEGG pathways involved in transition from healthy to precancer to cancer |
| Tissue | Disease Stage | Enriched GO biological Processes |
| Colorectum | AD |  |
| Colorectum | SER |  |
| Colorectum | MSS |  |
| Colorectum | MSI-H |  |
| Colorectum | FAP |  |
| ∗Top 15 enriched GO BP terms are showed in the bar plot of each disease state in each tissue. Each row represents a significant GO biological process which is colored according to the -log10(p.adjust). |
| Page: 1 2 3 4 5 6 7 8 9 |
| GO ID | Tissue | Disease Stage | Description | Gene Ratio | Bg Ratio | pvalue | p.adjust | Count |
| GO:00300109 | Endometrium | AEH | establishment of cell polarity | 36/2100 | 143/18723 | 2.19e-06 | 6.49e-05 | 36 |
| GO:00343299 | Endometrium | AEH | cell junction assembly | 78/2100 | 420/18723 | 4.80e-06 | 1.24e-04 | 78 |
| GO:00430878 | Endometrium | AEH | regulation of GTPase activity | 66/2100 | 348/18723 | 1.26e-05 | 2.77e-04 | 66 |
| GO:00510567 | Endometrium | AEH | regulation of small GTPase mediated signal transduction | 59/2100 | 302/18723 | 1.43e-05 | 3.03e-04 | 59 |
| GO:00435477 | Endometrium | AEH | positive regulation of GTPase activity | 48/2100 | 255/18723 | 2.18e-04 | 2.67e-03 | 48 |
| GO:00350886 | Endometrium | AEH | establishment or maintenance of apical/basal cell polarity | 14/2100 | 49/18723 | 7.19e-04 | 6.90e-03 | 14 |
| GO:00612456 | Endometrium | AEH | establishment or maintenance of bipolar cell polarity | 14/2100 | 49/18723 | 7.19e-04 | 6.90e-03 | 14 |
| GO:00451976 | Endometrium | AEH | establishment or maintenance of epithelial cell apical/basal polarity | 13/2100 | 44/18723 | 7.79e-04 | 7.36e-03 | 13 |
| GO:00901628 | Endometrium | AEH | establishment of epithelial cell polarity | 10/2100 | 31/18723 | 1.48e-03 | 1.23e-02 | 10 |
| GO:00017385 | Endometrium | AEH | morphogenesis of a polarized epithelium | 20/2100 | 94/18723 | 3.44e-03 | 2.38e-02 | 20 |
| GO:00611623 | Endometrium | AEH | establishment of monopolar cell polarity | 8/2100 | 24/18723 | 3.48e-03 | 2.39e-02 | 8 |
| GO:00613392 | Endometrium | AEH | establishment or maintenance of monopolar cell polarity | 8/2100 | 25/18723 | 4.62e-03 | 2.96e-02 | 8 |
| GO:002260416 | Endometrium | EEC | regulation of cell morphogenesis | 78/2168 | 309/18723 | 1.45e-11 | 2.28e-09 | 78 |
| GO:000716315 | Endometrium | EEC | establishment or maintenance of cell polarity | 56/2168 | 218/18723 | 5.41e-09 | 3.57e-07 | 56 |
| GO:003001014 | Endometrium | EEC | establishment of cell polarity | 36/2168 | 143/18723 | 4.57e-06 | 1.15e-04 | 36 |
| GO:003432914 | Endometrium | EEC | cell junction assembly | 79/2168 | 420/18723 | 8.37e-06 | 1.85e-04 | 79 |
| GO:005105612 | Endometrium | EEC | regulation of small GTPase mediated signal transduction | 61/2168 | 302/18723 | 9.42e-06 | 2.08e-04 | 61 |
| GO:004308712 | Endometrium | EEC | regulation of GTPase activity | 67/2168 | 348/18723 | 1.84e-05 | 3.43e-04 | 67 |
| GO:004354712 | Endometrium | EEC | positive regulation of GTPase activity | 50/2168 | 255/18723 | 1.26e-04 | 1.66e-03 | 50 |
| GO:003508812 | Endometrium | EEC | establishment or maintenance of apical/basal cell polarity | 14/2168 | 49/18723 | 9.88e-04 | 8.76e-03 | 14 |
| Page: 1 2 3 4 5 6 7 8 9 10 11 |
| Pathway ID | Tissue | Disease Stage | Description | Gene Ratio | Bg Ratio | pvalue | p.adjust | qvalue | Count |
| hsa048144 | Endometrium | AEH | Motor proteins | 42/1197 | 193/8465 | 2.41e-03 | 1.42e-02 | 1.04e-02 | 42 |
| hsa0481411 | Endometrium | AEH | Motor proteins | 42/1197 | 193/8465 | 2.41e-03 | 1.42e-02 | 1.04e-02 | 42 |
| hsa048142 | Endometrium | EEC | Motor proteins | 42/1237 | 193/8465 | 4.43e-03 | 2.39e-02 | 1.78e-02 | 42 |
| hsa048143 | Endometrium | EEC | Motor proteins | 42/1237 | 193/8465 | 4.43e-03 | 2.39e-02 | 1.78e-02 | 42 |
| hsa04814 | Lung | MIAC | Motor proteins | 21/507 | 193/8465 | 5.64e-03 | 3.82e-02 | 2.76e-02 | 21 |
| hsa048141 | Lung | MIAC | Motor proteins | 21/507 | 193/8465 | 5.64e-03 | 3.82e-02 | 2.76e-02 | 21 |
| Page: 1 |
Top |
Cell-cell communication analysis |
| Identification of potential cell-cell interactions between two cell types and their ligand-receptor pairs for different disease states |
| Ligand | Receptor | LRpair | Pathway | Tissue | Disease Stage |
| Page: 1 |
Top |
Single-cell gene regulatory network inference analysis |
| Find out the significant the regulons (TFs) and the target genes of each regulon across cell types for different disease states |
| TF | Cell Type | Tissue | Disease Stage | Target Gene | RSS | Regulon Activity |
| ∗The dot plots of a searched regulon are shown for all cell subpopulations in each disease state of each tissue based on the regulon specific score inferred using pySCENIC and by calculating the average expression. |
| Page: 1 |
Top |
Somatic mutation of malignant transformation related genes |
| Annotation of somatic variants for genes involved in malignant transformation |
| Hugo Symbol | Variant Class | Variant Classification | dbSNP RS | HGVSc | HGVSp | HGVSp Short | SWISSPROT | BIOTYPE | SIFT | PolyPhen | Tumor Sample Barcode | Tissue | Histology | Sex | Age | Stage | Therapy Types | Drugs | Outcome |
| MYO9A | SNV | Missense_Mutation | c.6722A>T | p.Glu2241Val | p.E2241V | B2RTY4 | protein_coding | deleterious(0) | benign(0.36) | TCGA-A2-A0EY-01 | Breast | breast invasive carcinoma | Female | <65 | I/II | Chemotherapy | adriamycin | SD | |
| MYO9A | SNV | Missense_Mutation | c.4825G>A | p.Gly1609Arg | p.G1609R | B2RTY4 | protein_coding | tolerated_low_confidence(0.22) | possibly_damaging(0.541) | TCGA-A8-A09Z-01 | Breast | breast invasive carcinoma | Female | >=65 | I/II | Unknown | Unknown | SD | |
| MYO9A | SNV | Missense_Mutation | novel | c.658N>A | p.Asp220Asn | p.D220N | B2RTY4 | protein_coding | deleterious(0) | probably_damaging(0.995) | TCGA-AC-A3BB-01 | Breast | breast invasive carcinoma | Female | <65 | III/IV | Chemotherapy | cytoxan | CR |
| MYO9A | SNV | Missense_Mutation | rs764262772 | c.500G>A | p.Arg167Gln | p.R167Q | B2RTY4 | protein_coding | deleterious(0.01) | possibly_damaging(0.808) | TCGA-AN-A046-01 | Breast | breast invasive carcinoma | Female | >=65 | I/II | Unknown | Unknown | SD |
| MYO9A | SNV | Missense_Mutation | rs144500644 | c.5761N>T | p.Arg1921Trp | p.R1921W | B2RTY4 | protein_coding | deleterious(0.02) | probably_damaging(0.999) | TCGA-AN-A0FY-01 | Breast | breast invasive carcinoma | Female | <65 | I/II | Unknown | Unknown | SD |
| MYO9A | SNV | Missense_Mutation | novel | c.2983N>G | p.Gln995Glu | p.Q995E | B2RTY4 | protein_coding | deleterious(0) | probably_damaging(0.999) | TCGA-BH-A0B6-01 | Breast | breast invasive carcinoma | Female | <65 | I/II | Unknown | Unknown | SD |
| MYO9A | SNV | Missense_Mutation | c.424N>G | p.Gln142Glu | p.Q142E | B2RTY4 | protein_coding | tolerated(0.07) | benign(0.159) | TCGA-BH-A0BL-01 | Breast | breast invasive carcinoma | Female | <65 | I/II | Chemotherapy | adriamycin | CR | |
| MYO9A | SNV | Missense_Mutation | c.3359N>C | p.Ile1120Thr | p.I1120T | B2RTY4 | protein_coding | tolerated(0.85) | benign(0) | TCGA-BH-A18I-01 | Breast | breast invasive carcinoma | Female | <65 | I/II | Chemotherapy | taxotere | CR | |
| MYO9A | SNV | Missense_Mutation | rs757005328 | c.6257N>C | p.Ile2086Thr | p.I2086T | B2RTY4 | protein_coding | deleterious(0) | probably_damaging(0.998) | TCGA-D8-A1XK-01 | Breast | breast invasive carcinoma | Female | <65 | I/II | Chemotherapy | doxorubicine+cyclophosphamide | SD |
| MYO9A | SNV | Missense_Mutation | c.6118N>C | p.Cys2040Arg | p.C2040R | B2RTY4 | protein_coding | deleterious(0) | probably_damaging(0.997) | TCGA-D8-A1XK-01 | Breast | breast invasive carcinoma | Female | <65 | I/II | Chemotherapy | doxorubicine+cyclophosphamide | SD |
| Page: 1 2 3 4 5 6 7 8 9 10 11 12 13 14 15 16 17 18 19 20 21 22 23 24 25 26 27 |
Top |
Related drugs of malignant transformation related genes |
| Identification of chemicals and drugs interact with genes involved in malignant transfromation |
| (DGIdb 4.0) |
| Entrez ID | Symbol | Category | Interaction Types | Drug Claim Name | Drug Name | PMIDs |
| Page: 1 |

Copyright 2023-Present -The University of Texas Health Science Center at Houston |