| Tissue | Expression Dynamics | Abbreviation |
| Endometrium |  | AEH: Atypical endometrial hyperplasia |
| EEC: Endometrioid Cancer |
| Esophagus |  | ESCC: Esophageal squamous cell carcinoma |
| HGIN: High-grade intraepithelial neoplasias |
| LGIN: Low-grade intraepithelial neoplasias |
| Liver | 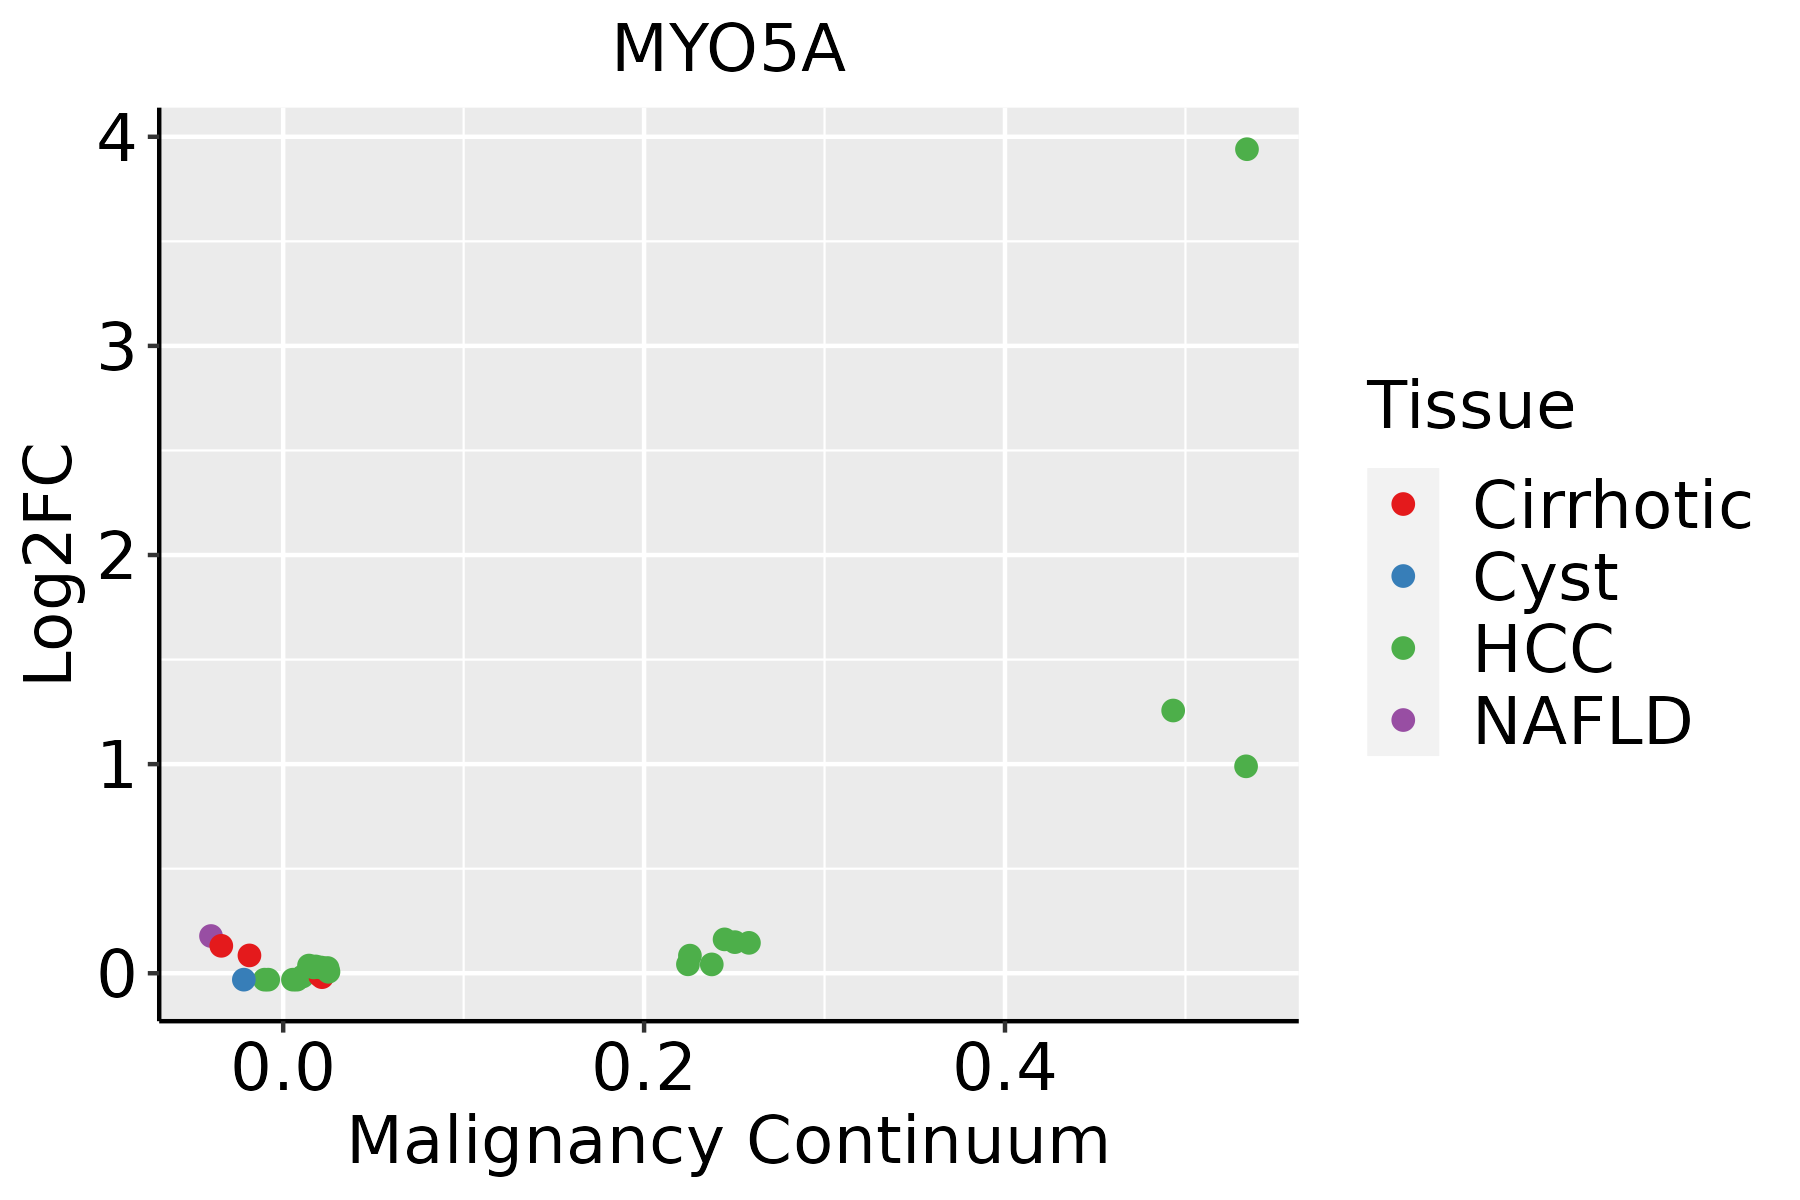 | HCC: Hepatocellular carcinoma |
| NAFLD: Non-alcoholic fatty liver disease |
| Oral Cavity |  | EOLP: Erosive Oral lichen planus |
| LP: leukoplakia |
| NEOLP: Non-erosive oral lichen planus |
| OSCC: Oral squamous cell carcinoma |
| Skin | 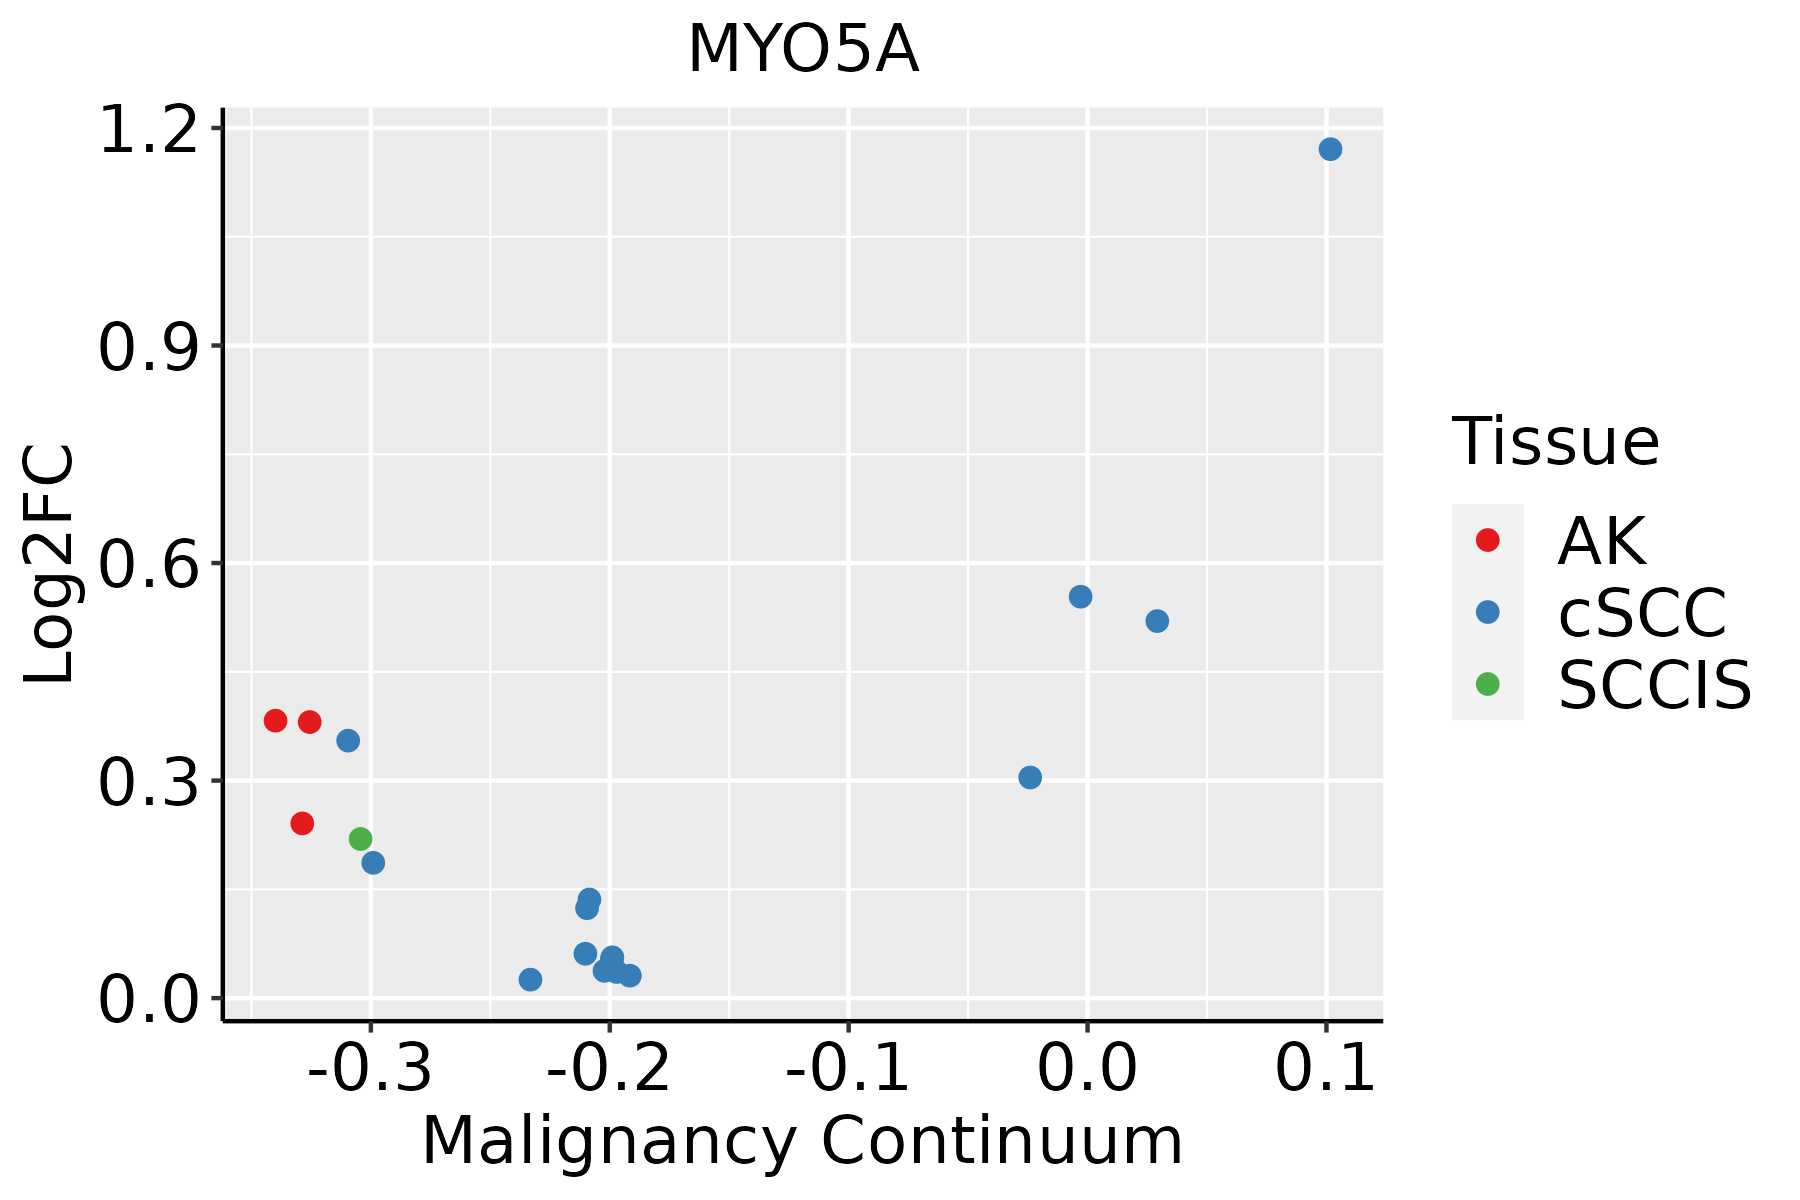 | AK: Actinic keratosis |
| cSCC: Cutaneous squamous cell carcinoma |
| SCCIS:squamous cell carcinoma in situ |
| Thyroid | 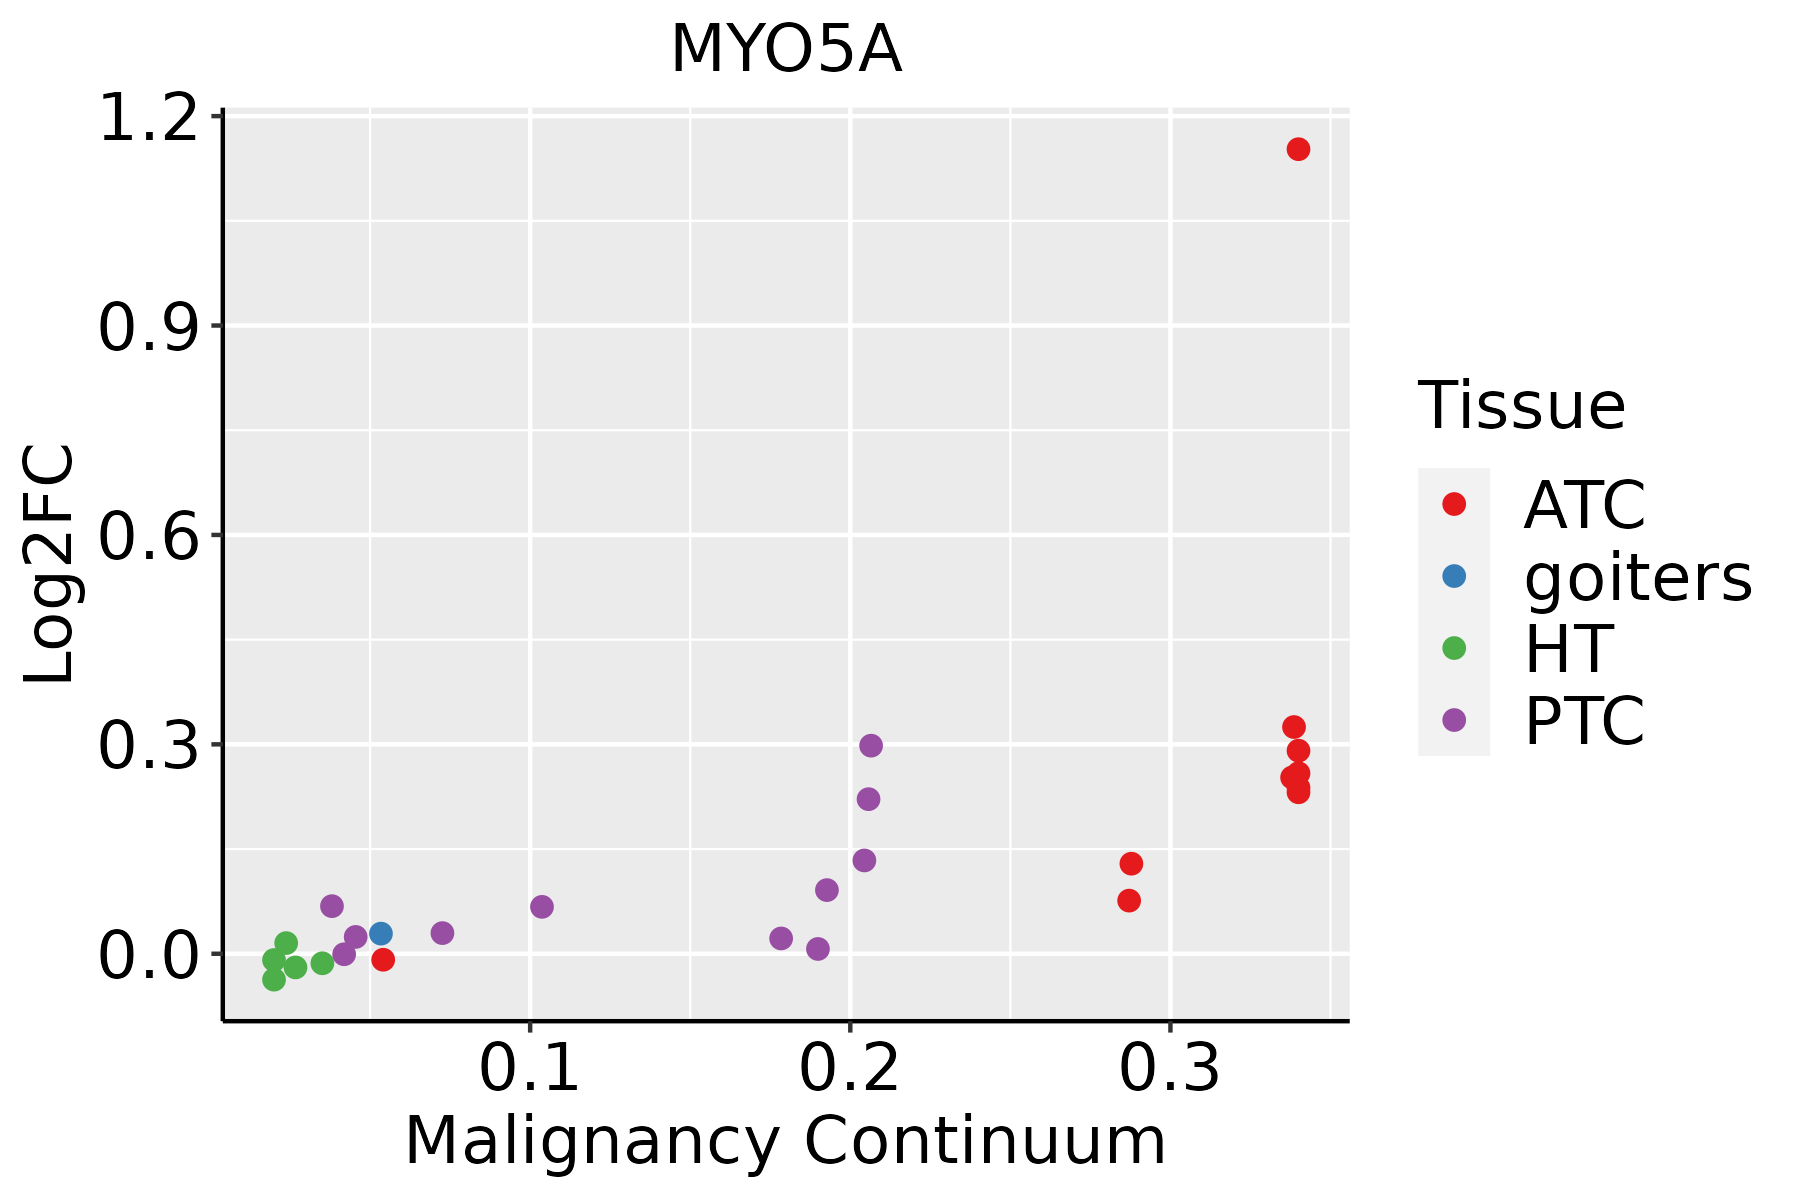 | ATC: Anaplastic thyroid cancer |
| HT: Hashimoto's thyroiditis |
| PTC: Papillary thyroid cancer |
| GO ID | Tissue | Disease Stage | Description | Gene Ratio | Bg Ratio | pvalue | p.adjust | Count |
| GO:005165022 | Oral cavity | EOLP | establishment of vesicle localization | 35/2218 | 161/18723 | 2.54e-04 | 2.47e-03 | 35 |
| GO:005164822 | Oral cavity | EOLP | vesicle localization | 37/2218 | 177/18723 | 3.88e-04 | 3.48e-03 | 37 |
| GO:00330592 | Oral cavity | EOLP | cellular pigmentation | 13/2218 | 53/18723 | 7.67e-03 | 3.66e-02 | 13 |
| GO:0043473 | Oral cavity | EOLP | pigmentation | 20/2218 | 98/18723 | 1.02e-02 | 4.58e-02 | 20 |
| GO:009951812 | Oral cavity | EOLP | vesicle cytoskeletal trafficking | 16/2218 | 73/18723 | 1.04e-02 | 4.65e-02 | 16 |
| GO:000701534 | Oral cavity | NEOLP | actin filament organization | 94/2005 | 442/18723 | 4.49e-11 | 5.80e-09 | 94 |
| GO:190165331 | Oral cavity | NEOLP | cellular response to peptide | 78/2005 | 359/18723 | 7.21e-10 | 5.54e-08 | 78 |
| GO:003070531 | Oral cavity | NEOLP | cytoskeleton-dependent intracellular transport | 46/2005 | 195/18723 | 1.81e-07 | 6.18e-06 | 46 |
| GO:007137531 | Oral cavity | NEOLP | cellular response to peptide hormone stimulus | 60/2005 | 290/18723 | 3.92e-07 | 1.19e-05 | 60 |
| GO:004819331 | Oral cavity | NEOLP | Golgi vesicle transport | 60/2005 | 296/18723 | 8.09e-07 | 2.21e-05 | 60 |
| GO:003286931 | Oral cavity | NEOLP | cellular response to insulin stimulus | 45/2005 | 203/18723 | 1.56e-06 | 3.86e-05 | 45 |
| GO:004343431 | Oral cavity | NEOLP | response to peptide hormone | 76/2005 | 414/18723 | 1.79e-06 | 4.33e-05 | 76 |
| GO:007265931 | Oral cavity | NEOLP | protein localization to plasma membrane | 56/2005 | 284/18723 | 4.51e-06 | 9.60e-05 | 56 |
| GO:000689231 | Oral cavity | NEOLP | post-Golgi vesicle-mediated transport | 27/2005 | 104/18723 | 9.30e-06 | 1.79e-04 | 27 |
| GO:199077831 | Oral cavity | NEOLP | protein localization to cell periphery | 62/2005 | 333/18723 | 9.84e-06 | 1.86e-04 | 62 |
| GO:005165631 | Oral cavity | NEOLP | establishment of organelle localization | 69/2005 | 390/18723 | 1.89e-05 | 3.16e-04 | 69 |
| GO:003286832 | Oral cavity | NEOLP | response to insulin | 50/2005 | 264/18723 | 4.35e-05 | 6.13e-04 | 50 |
| GO:005165031 | Oral cavity | NEOLP | establishment of vesicle localization | 33/2005 | 161/18723 | 1.83e-04 | 1.99e-03 | 33 |
| GO:005164831 | Oral cavity | NEOLP | vesicle localization | 34/2005 | 177/18723 | 5.23e-04 | 4.61e-03 | 34 |
| GO:003004810 | Oral cavity | NEOLP | actin filament-based movement | 24/2005 | 127/18723 | 4.02e-03 | 2.29e-02 | 24 |
| Pathway ID | Tissue | Disease Stage | Description | Gene Ratio | Bg Ratio | pvalue | p.adjust | qvalue | Count |
| hsa05130211 | Esophagus | ESCC | Pathogenic Escherichia coli infection | 142/4205 | 197/8465 | 8.21e-11 | 1.06e-09 | 5.42e-10 | 142 |
| hsa05130310 | Esophagus | ESCC | Pathogenic Escherichia coli infection | 142/4205 | 197/8465 | 8.21e-11 | 1.06e-09 | 5.42e-10 | 142 |
| hsa0513042 | Liver | HCC | Pathogenic Escherichia coli infection | 129/4020 | 197/8465 | 2.02e-07 | 2.50e-06 | 1.39e-06 | 129 |
| hsa0513052 | Liver | HCC | Pathogenic Escherichia coli infection | 129/4020 | 197/8465 | 2.02e-07 | 2.50e-06 | 1.39e-06 | 129 |
| hsa0513030 | Oral cavity | OSCC | Pathogenic Escherichia coli infection | 129/3704 | 197/8465 | 4.32e-10 | 5.17e-09 | 2.63e-09 | 129 |
| hsa05130114 | Oral cavity | OSCC | Pathogenic Escherichia coli infection | 129/3704 | 197/8465 | 4.32e-10 | 5.17e-09 | 2.63e-09 | 129 |
| hsa0513045 | Oral cavity | EOLP | Pathogenic Escherichia coli infection | 54/1218 | 197/8465 | 1.10e-06 | 9.96e-06 | 5.87e-06 | 54 |
| hsa0513055 | Oral cavity | EOLP | Pathogenic Escherichia coli infection | 54/1218 | 197/8465 | 1.10e-06 | 9.96e-06 | 5.87e-06 | 54 |
| hsa0513063 | Oral cavity | NEOLP | Pathogenic Escherichia coli infection | 55/1112 | 197/8465 | 2.04e-08 | 4.32e-07 | 2.72e-07 | 55 |
| hsa048145 | Oral cavity | NEOLP | Motor proteins | 37/1112 | 193/8465 | 1.06e-02 | 3.54e-02 | 2.22e-02 | 37 |
| hsa0513073 | Oral cavity | NEOLP | Pathogenic Escherichia coli infection | 55/1112 | 197/8465 | 2.04e-08 | 4.32e-07 | 2.72e-07 | 55 |
| hsa0481412 | Oral cavity | NEOLP | Motor proteins | 37/1112 | 193/8465 | 1.06e-02 | 3.54e-02 | 2.22e-02 | 37 |
| Hugo Symbol | Variant Class | Variant Classification | dbSNP RS | HGVSc | HGVSp | HGVSp Short | SWISSPROT | BIOTYPE | SIFT | PolyPhen | Tumor Sample Barcode | Tissue | Histology | Sex | Age | Stage | Therapy Types | Drugs | Outcome |
| MYO5A | SNV | Missense_Mutation | novel | c.3088N>A | p.Glu1030Lys | p.E1030K | Q9Y4I1 | protein_coding | tolerated(0.15) | benign(0.007) | TCGA-A2-A4S3-01 | Breast | breast invasive carcinoma | Female | <65 | I/II | Unknown | Unknown | SD |
| MYO5A | SNV | Missense_Mutation | | c.3040N>C | p.Asp1014His | p.D1014H | Q9Y4I1 | protein_coding | tolerated(0.07) | benign(0.01) | TCGA-A8-A06Q-01 | Breast | breast invasive carcinoma | Female | <65 | III/IV | Unknown | Unknown | SD |
| MYO5A | SNV | Missense_Mutation | | c.3578G>C | p.Arg1193Thr | p.R1193T | Q9Y4I1 | protein_coding | tolerated(0.38) | benign(0) | TCGA-AC-A23H-01 | Breast | breast invasive carcinoma | Female | >=65 | I/II | Unknown | Unknown | PD |
| MYO5A | SNV | Missense_Mutation | rs751712752 | c.5404C>T | p.Arg1802Cys | p.R1802C | Q9Y4I1 | protein_coding | deleterious(0) | probably_damaging(0.931) | TCGA-AN-A046-01 | Breast | breast invasive carcinoma | Female | >=65 | I/II | Unknown | Unknown | SD |
| MYO5A | SNV | Missense_Mutation | rs561485938 | c.2438G>A | p.Arg813His | p.R813H | Q9Y4I1 | protein_coding | deleterious(0) | possibly_damaging(0.815) | TCGA-BH-A1EN-01 | Breast | breast invasive carcinoma | Female | >=65 | I/II | Unknown | Unknown | SD |
| MYO5A | SNV | Missense_Mutation | rs770697352 | c.3361G>A | p.Glu1121Lys | p.E1121K | Q9Y4I1 | protein_coding | tolerated(0.05) | benign(0.107) | TCGA-C8-A12Q-01 | Breast | breast invasive carcinoma | Female | >=65 | III/IV | Unknown | Unknown | PD |
| MYO5A | SNV | Missense_Mutation | novel | c.5122A>G | p.Lys1708Glu | p.K1708E | Q9Y4I1 | protein_coding | deleterious(0) | probably_damaging(0.98) | TCGA-E2-A1B1-01 | Breast | breast invasive carcinoma | Female | <65 | I/II | Other, specify in notesbiphosphonate | zoledronic | SD |
| MYO5A | insertion | Nonsense_Mutation | novel | c.3658_3659insGACATAACTTTAACTCCACAGACCTACGATAAGAATTT | p.Asn1220ArgfsTer11 | p.N1220Rfs*11 | Q9Y4I1 | protein_coding | | | TCGA-A2-A0CP-01 | Breast | breast invasive carcinoma | Female | <65 | I/II | Chemotherapy | cytoxan | SD |
| MYO5A | insertion | Frame_Shift_Ins | novel | c.5465_5466insG | p.His1823ThrfsTer57 | p.H1823Tfs*57 | Q9Y4I1 | protein_coding | | | TCGA-A7-A26I-01 | Breast | breast invasive carcinoma | Female | >=65 | I/II | Chemotherapy | cytoxan | SD |
| MYO5A | insertion | Frame_Shift_Ins | novel | c.5465_5466insG | p.His1823ThrfsTer57 | p.H1823Tfs*57 | Q9Y4I1 | protein_coding | | | TCGA-AC-A3QQ-01 | Breast | breast invasive carcinoma | Female | <65 | I/II | Unknown | Unknown | SD |


