
|
|||||
|
 | |
| |
| |
| |
| |
| |
|
Gene: MRTFA |
Gene summary for MRTFA |
| Gene information | Species | Human | Gene symbol | MRTFA | Gene ID | 57591 |
| Gene name | myocardin related transcription factor A | |
| Gene Alias | BSAC | |
| Cytomap | 22q13.1-q13.2 | |
| Gene Type | protein-coding | GO ID | GO:0002009 | UniProtAcc | A4FUJ8 |
Top |
Malignant transformation analysis |
| Identification of the aberrant gene expression in precancerous and cancerous lesions by comparing the gene expression of stem-like cells in diseased tissues with normal stem cells |
| Entrez ID | Symbol | Replicates | Species | Organ | Tissue | Adj P-value | Log2FC | Malignancy |
| 57591 | MRTFA | CCI_1 | Human | Cervix | CC | 1.40e-12 | 9.93e-01 | 0.528 |
| 57591 | MRTFA | CCI_2 | Human | Cervix | CC | 1.35e-15 | 1.31e+00 | 0.5249 |
| 57591 | MRTFA | CCI_3 | Human | Cervix | CC | 8.28e-23 | 1.12e+00 | 0.516 |
| 57591 | MRTFA | Tumor | Human | Cervix | CC | 3.83e-04 | -1.35e-01 | 0.1241 |
| 57591 | MRTFA | HTA11_3410_2000001011 | Human | Colorectum | AD | 8.84e-19 | 3.38e-01 | 0.0155 |
| 57591 | MRTFA | HTA11_2487_2000001011 | Human | Colorectum | SER | 4.28e-25 | 6.28e-01 | -0.1808 |
| 57591 | MRTFA | HTA11_2951_2000001011 | Human | Colorectum | AD | 1.51e-11 | 4.90e-01 | 0.0216 |
| 57591 | MRTFA | HTA11_1938_2000001011 | Human | Colorectum | AD | 5.76e-31 | 8.17e-01 | -0.0811 |
| 57591 | MRTFA | HTA11_78_2000001011 | Human | Colorectum | AD | 6.88e-27 | 6.51e-01 | -0.1088 |
| 57591 | MRTFA | HTA11_347_2000001011 | Human | Colorectum | AD | 2.57e-61 | 1.06e+00 | -0.1954 |
| 57591 | MRTFA | HTA11_411_2000001011 | Human | Colorectum | SER | 6.42e-18 | 1.00e+00 | -0.2602 |
| 57591 | MRTFA | HTA11_2112_2000001011 | Human | Colorectum | SER | 7.13e-25 | 1.11e+00 | -0.2196 |
| 57591 | MRTFA | HTA11_3361_2000001011 | Human | Colorectum | AD | 2.38e-26 | 6.56e-01 | -0.1207 |
| 57591 | MRTFA | HTA11_83_2000001011 | Human | Colorectum | SER | 7.66e-30 | 7.71e-01 | -0.1526 |
| 57591 | MRTFA | HTA11_696_2000001011 | Human | Colorectum | AD | 7.93e-51 | 8.42e-01 | -0.1464 |
| 57591 | MRTFA | HTA11_866_2000001011 | Human | Colorectum | AD | 1.11e-46 | 8.33e-01 | -0.1001 |
| 57591 | MRTFA | HTA11_1391_2000001011 | Human | Colorectum | AD | 1.80e-49 | 1.14e+00 | -0.059 |
| 57591 | MRTFA | HTA11_2992_2000001011 | Human | Colorectum | SER | 2.54e-11 | 5.85e-01 | -0.1706 |
| 57591 | MRTFA | HTA11_5212_2000001011 | Human | Colorectum | AD | 2.32e-13 | 4.96e-01 | -0.2061 |
| 57591 | MRTFA | HTA11_5216_2000001011 | Human | Colorectum | SER | 2.17e-09 | 5.15e-01 | -0.1462 |
| Page: 1 2 3 4 5 6 7 |
| Tissue | Expression Dynamics | Abbreviation |
| Cervix |  | CC: Cervix cancer |
| HSIL_HPV: HPV-infected high-grade squamous intraepithelial lesions | ||
| N_HPV: HPV-infected normal cervix | ||
| Colorectum (GSE201348) |  | FAP: Familial adenomatous polyposis |
| CRC: Colorectal cancer | ||
| Colorectum (HTA11) |  | AD: Adenomas |
| SER: Sessile serrated lesions | ||
| MSI-H: Microsatellite-high colorectal cancer | ||
| MSS: Microsatellite stable colorectal cancer | ||
| Endometrium | 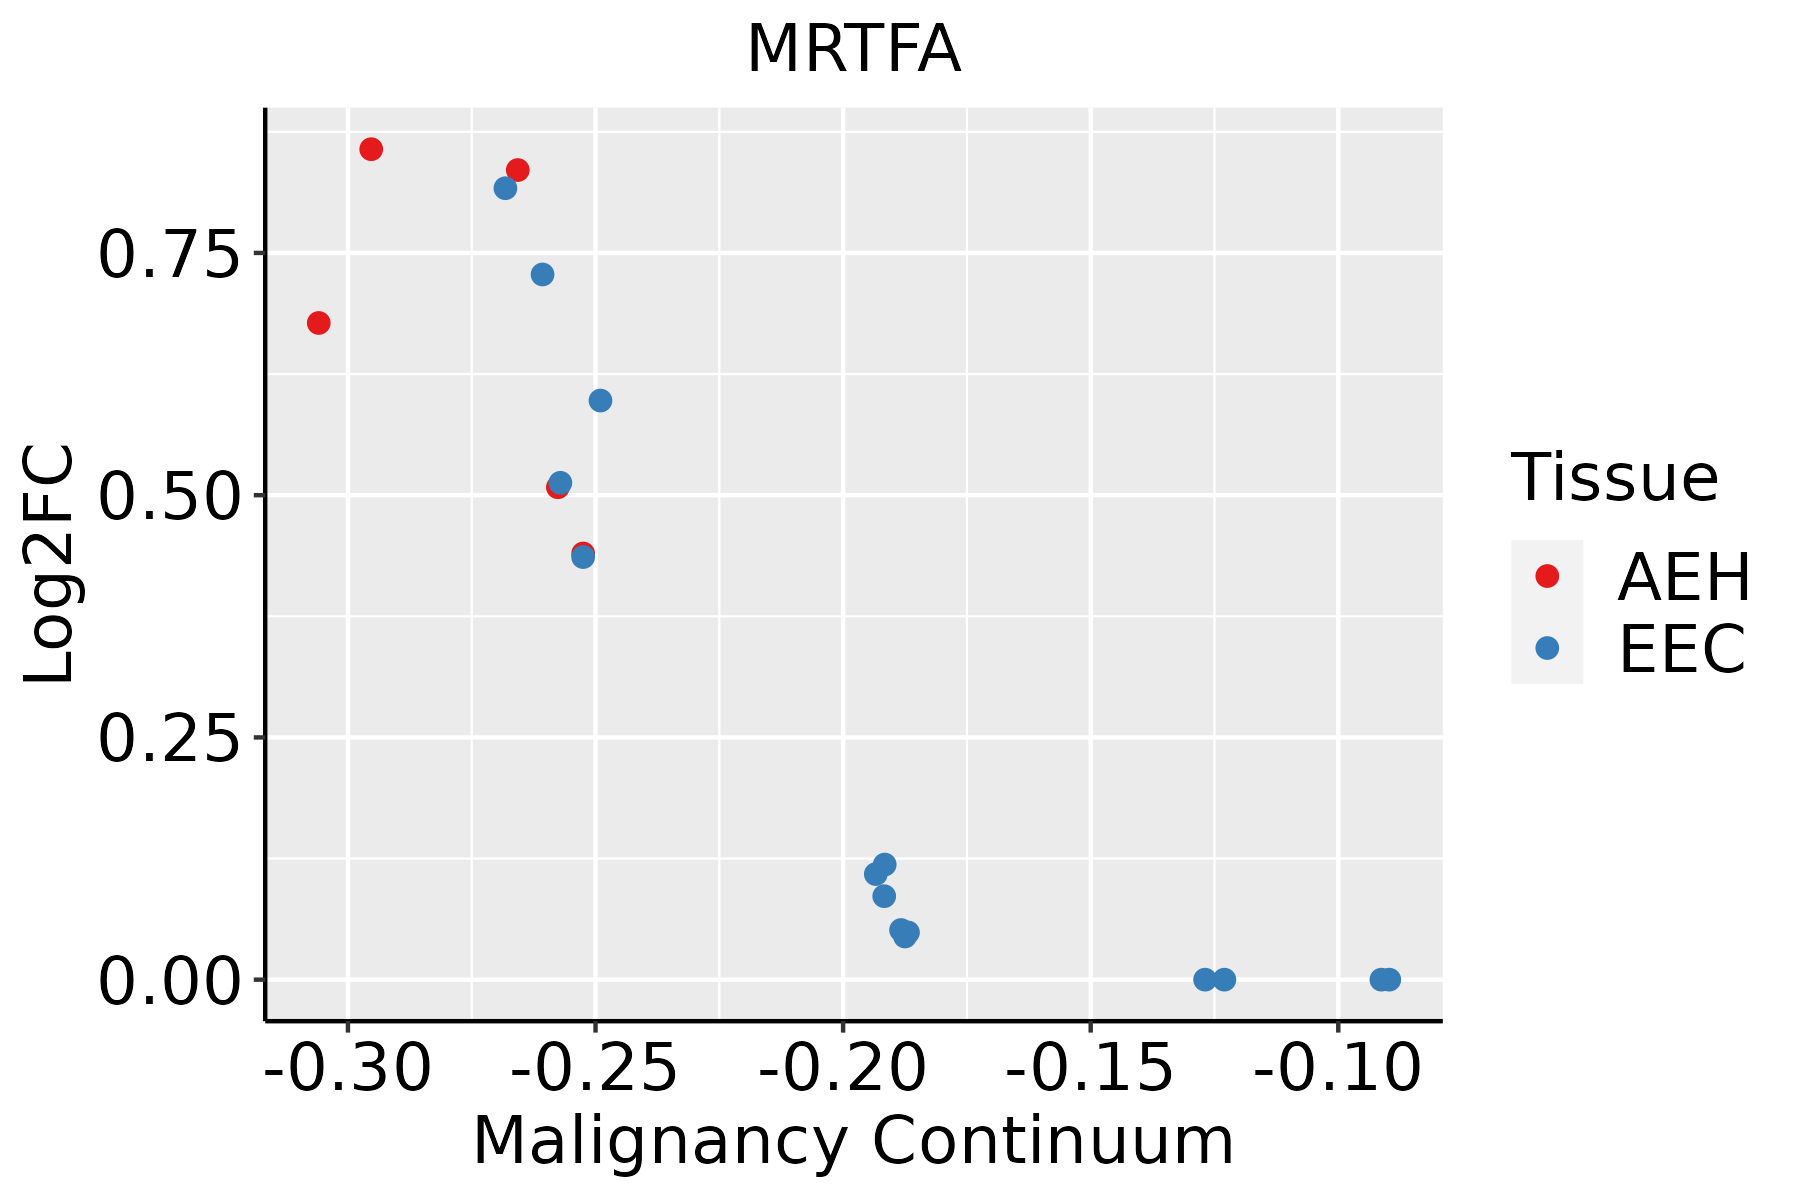 | AEH: Atypical endometrial hyperplasia |
| EEC: Endometrioid Cancer | ||
| GC | 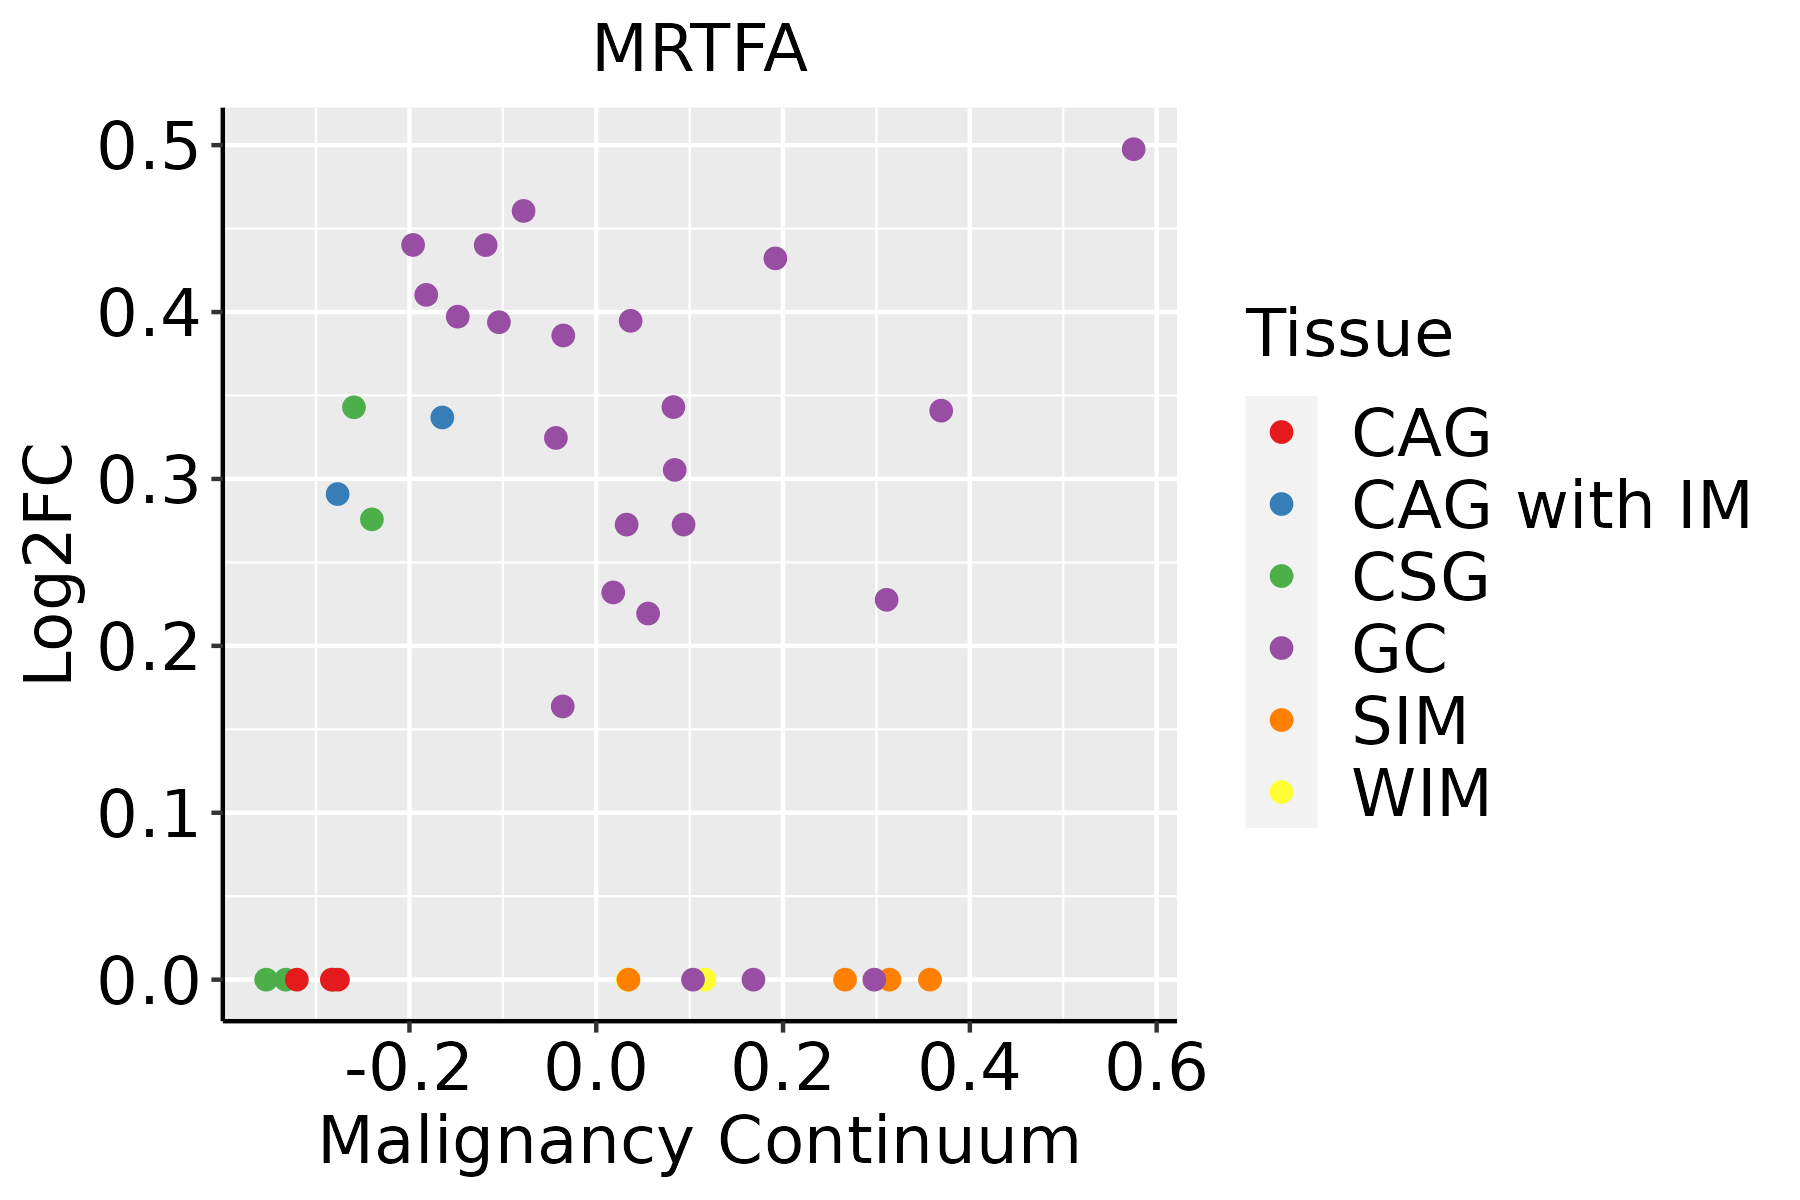 | CAG: Chronic atrophic gastritis |
| CAG with IM: Chronic atrophic gastritis with intestinal metaplasia | ||
| CSG: Chronic superficial gastritis | ||
| GC: Gastric cancer | ||
| SIM: Severe intestinal metaplasia | ||
| WIM: Wild intestinal metaplasia | ||
| Lung | 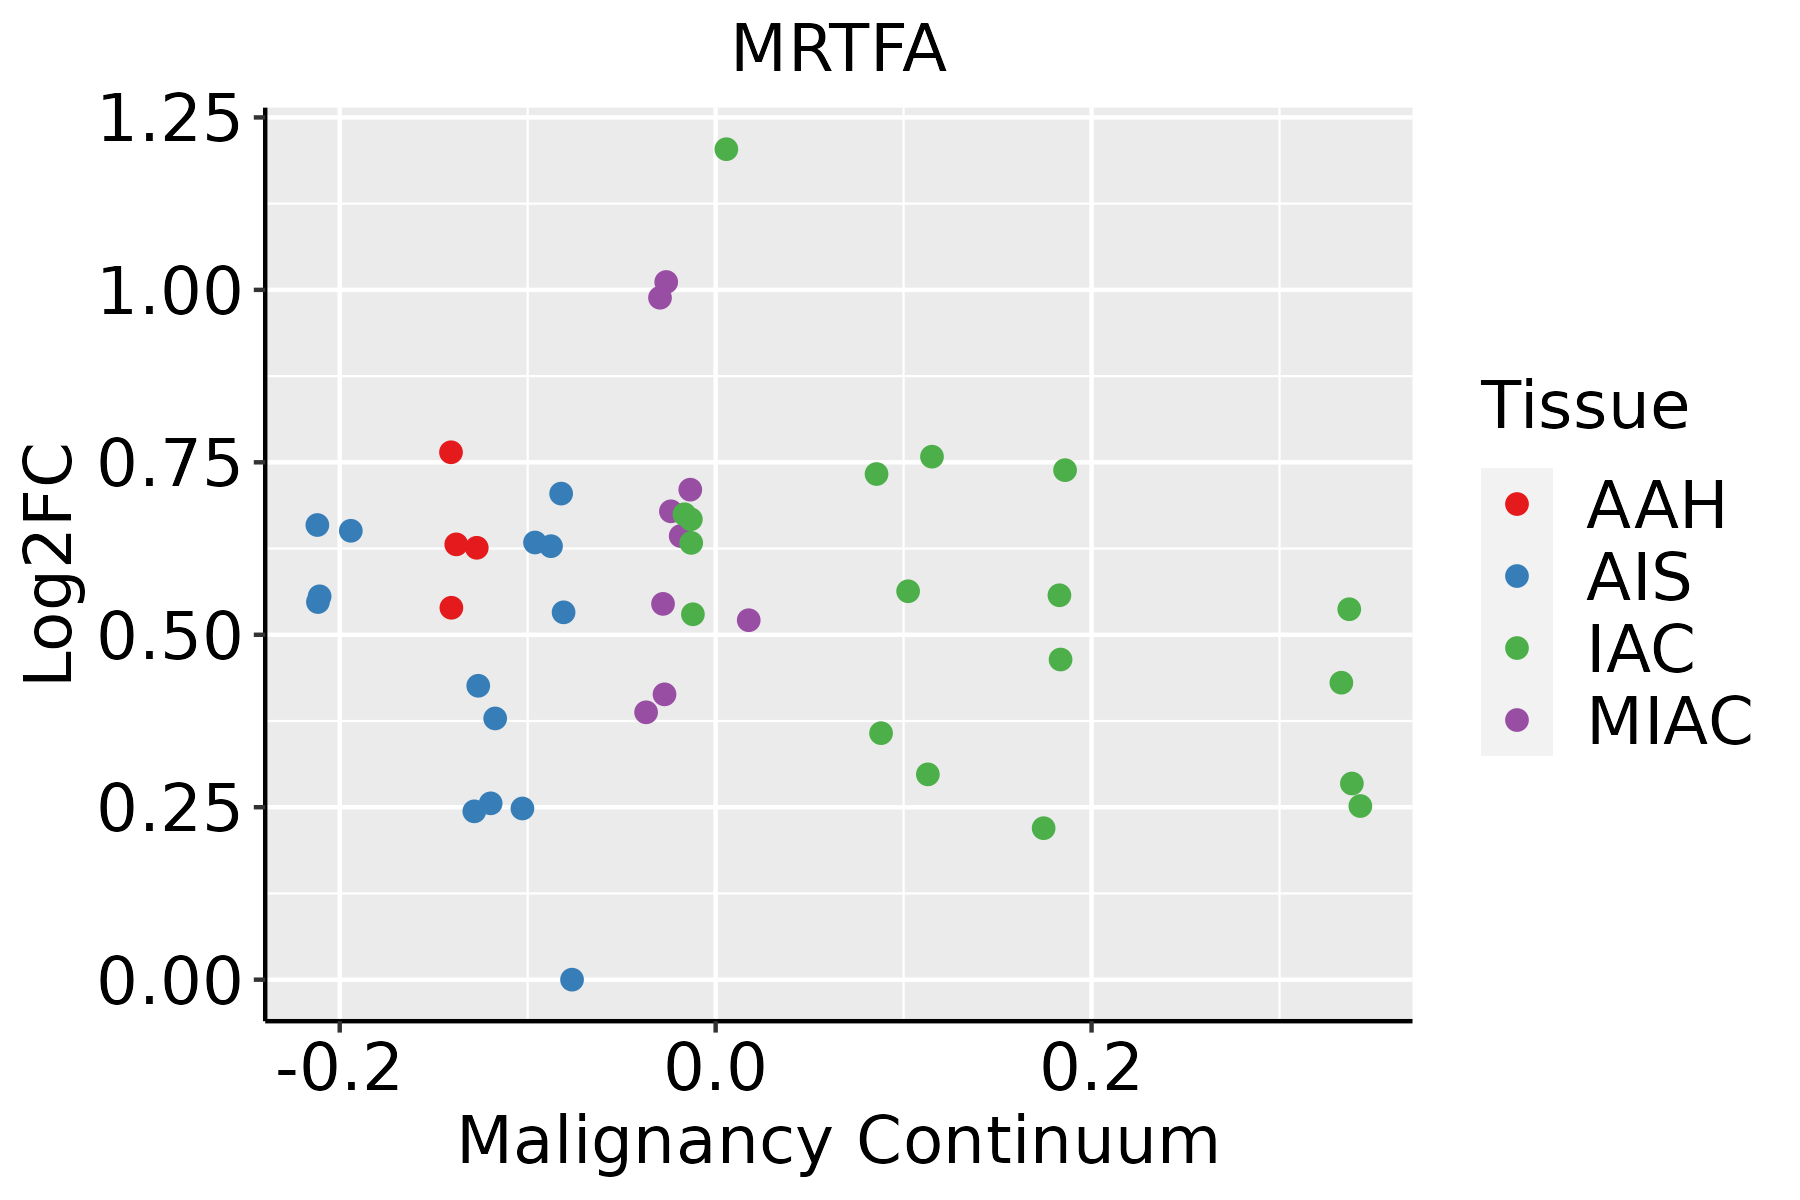 | AAH: Atypical adenomatous hyperplasia |
| AIS: Adenocarcinoma in situ | ||
| IAC: Invasive lung adenocarcinoma | ||
| MIA: Minimally invasive adenocarcinoma | ||
| Oral Cavity | 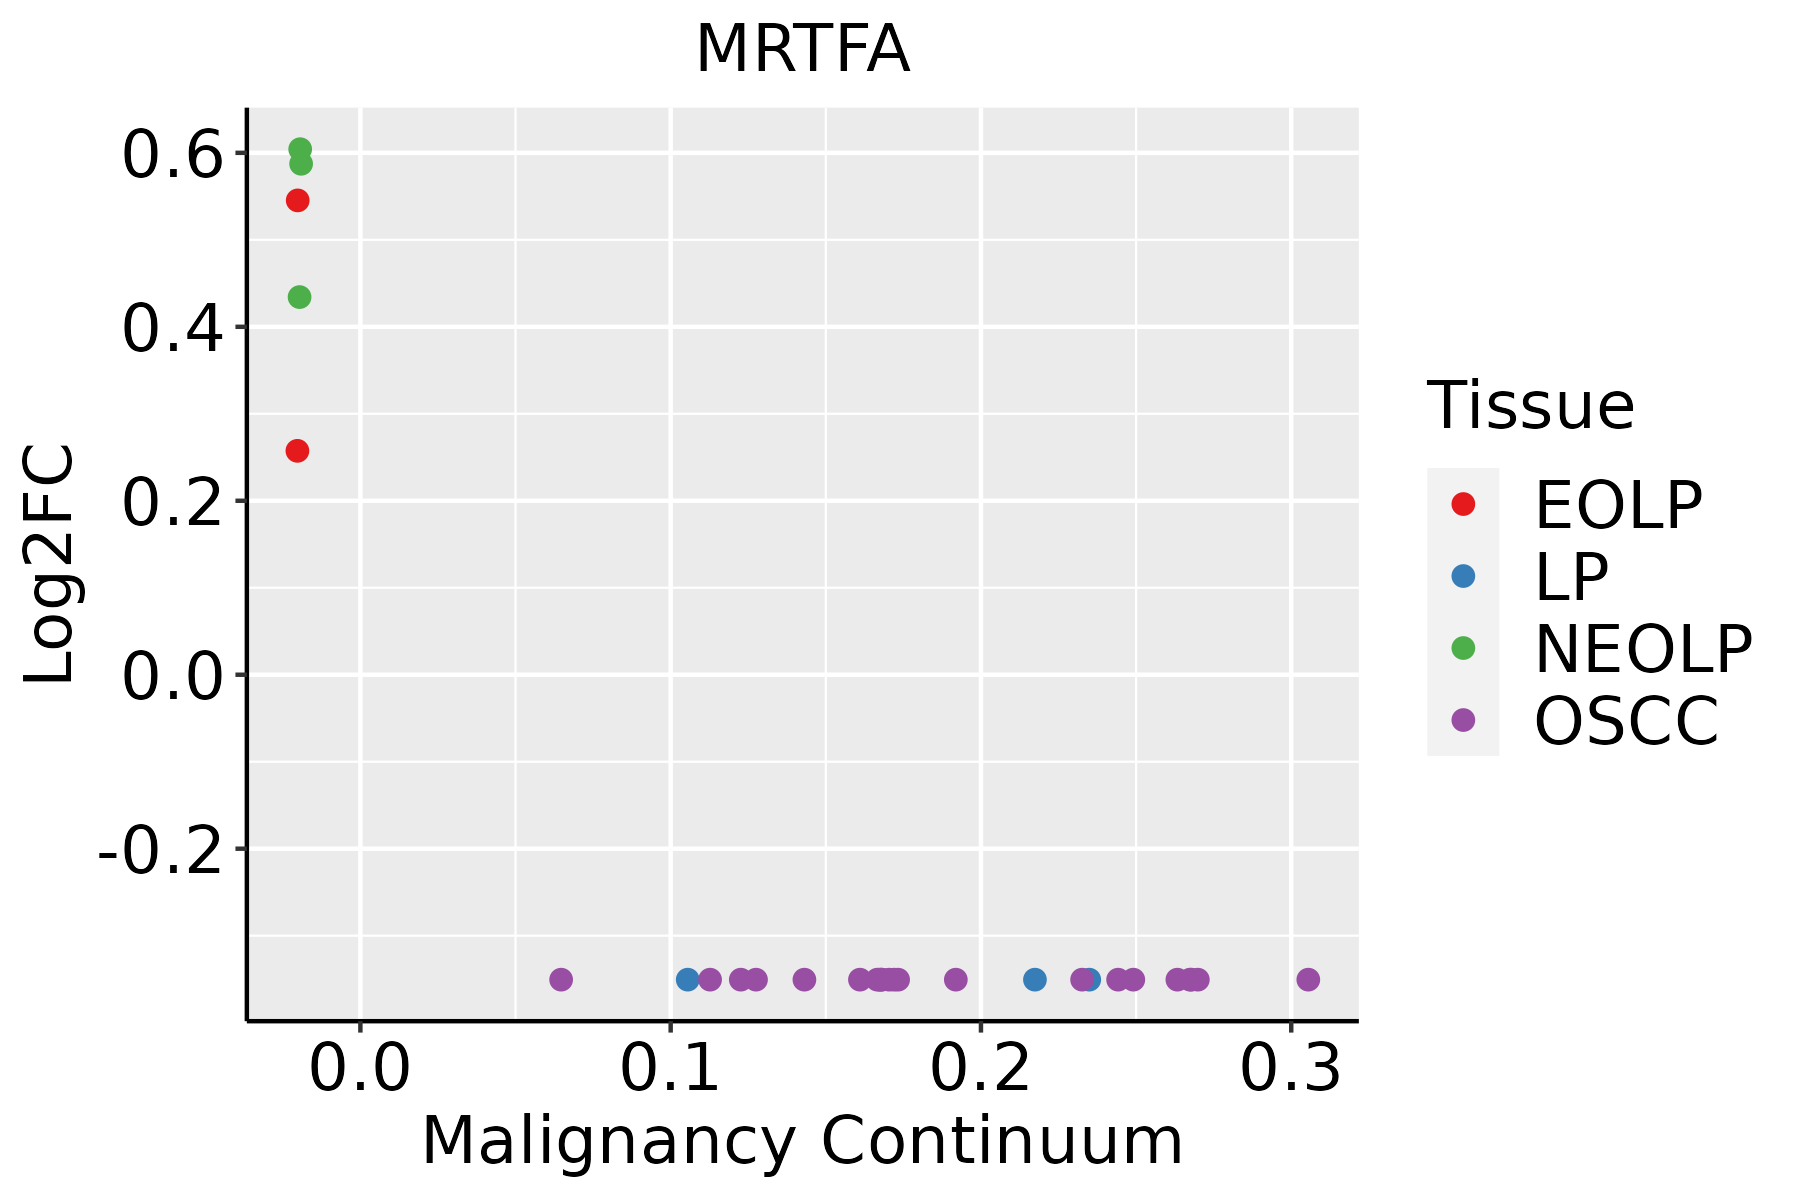 | EOLP: Erosive Oral lichen planus |
| LP: leukoplakia | ||
| NEOLP: Non-erosive oral lichen planus | ||
| OSCC: Oral squamous cell carcinoma | ||
| Prostate | 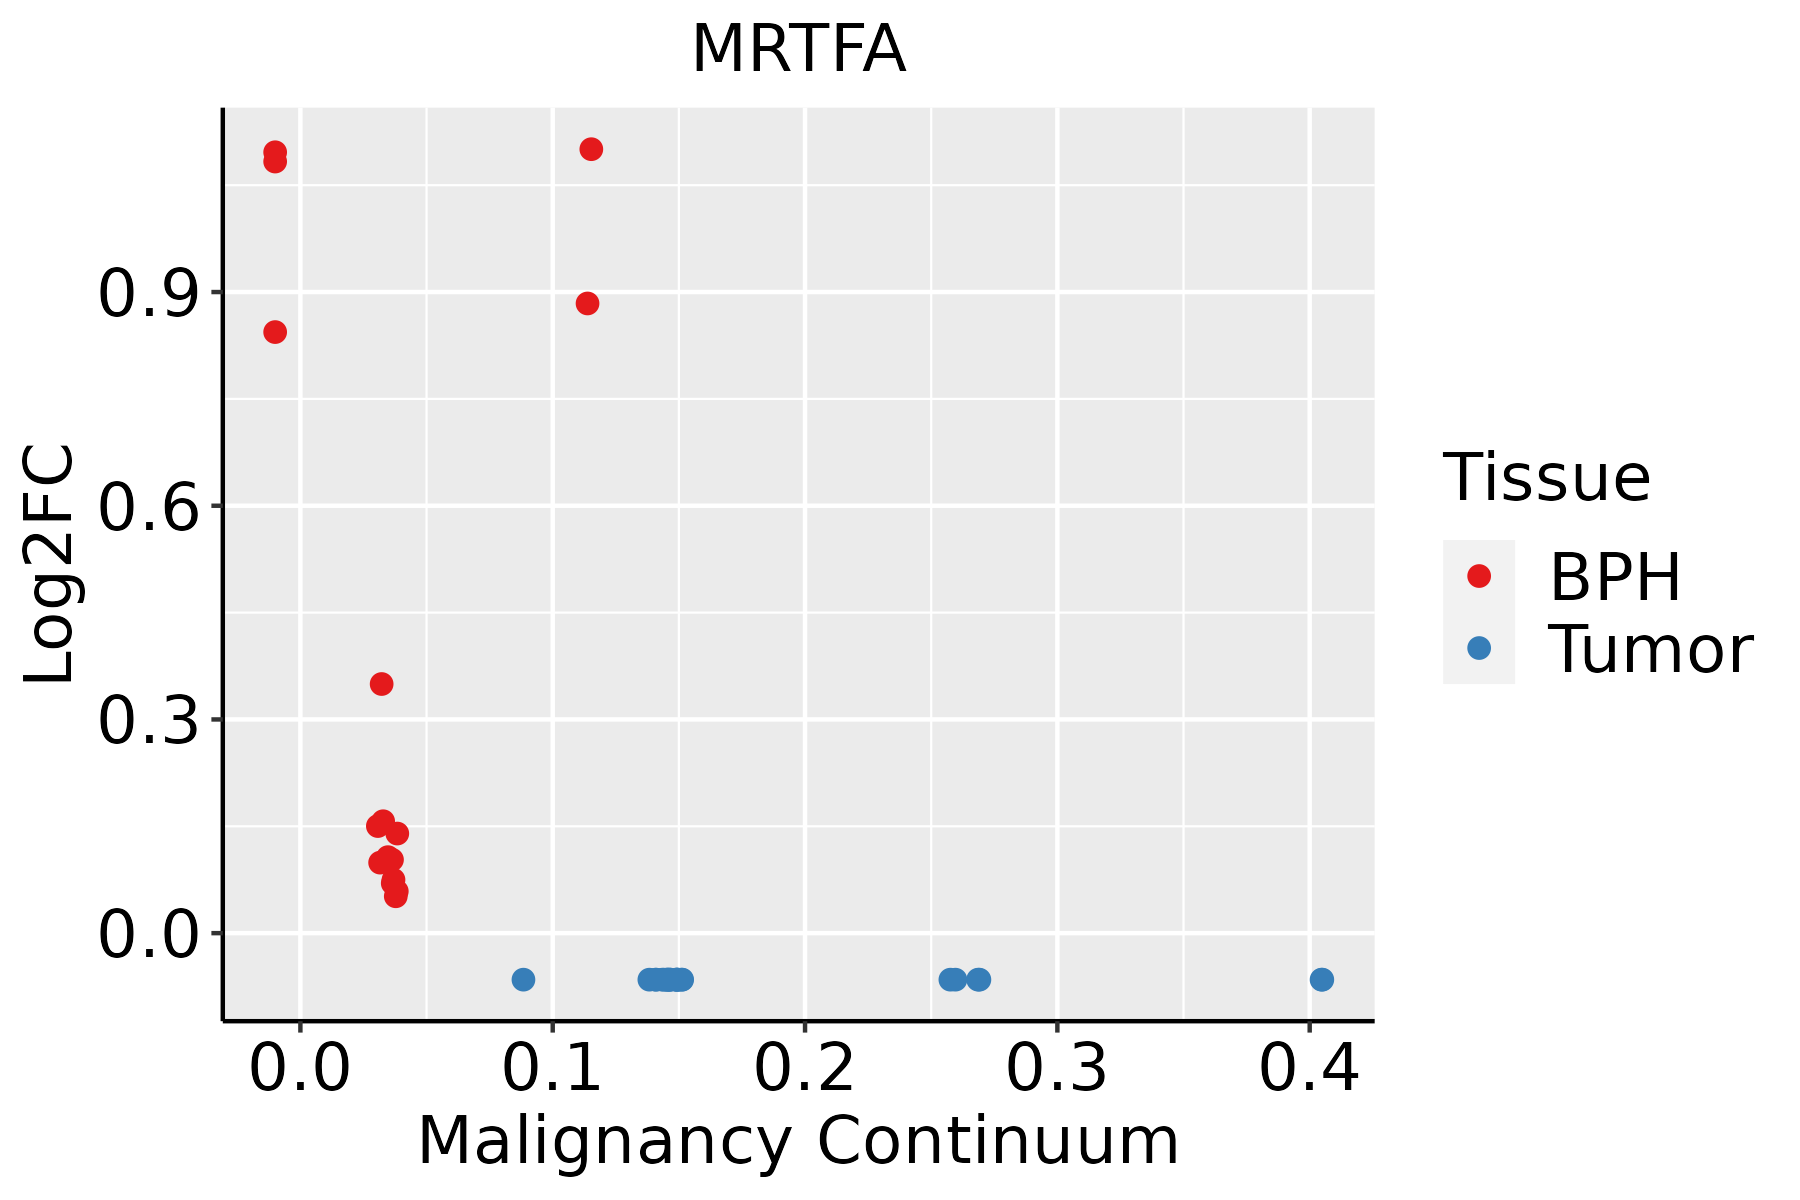 | BPH: Benign Prostatic Hyperplasia |
| Skin | 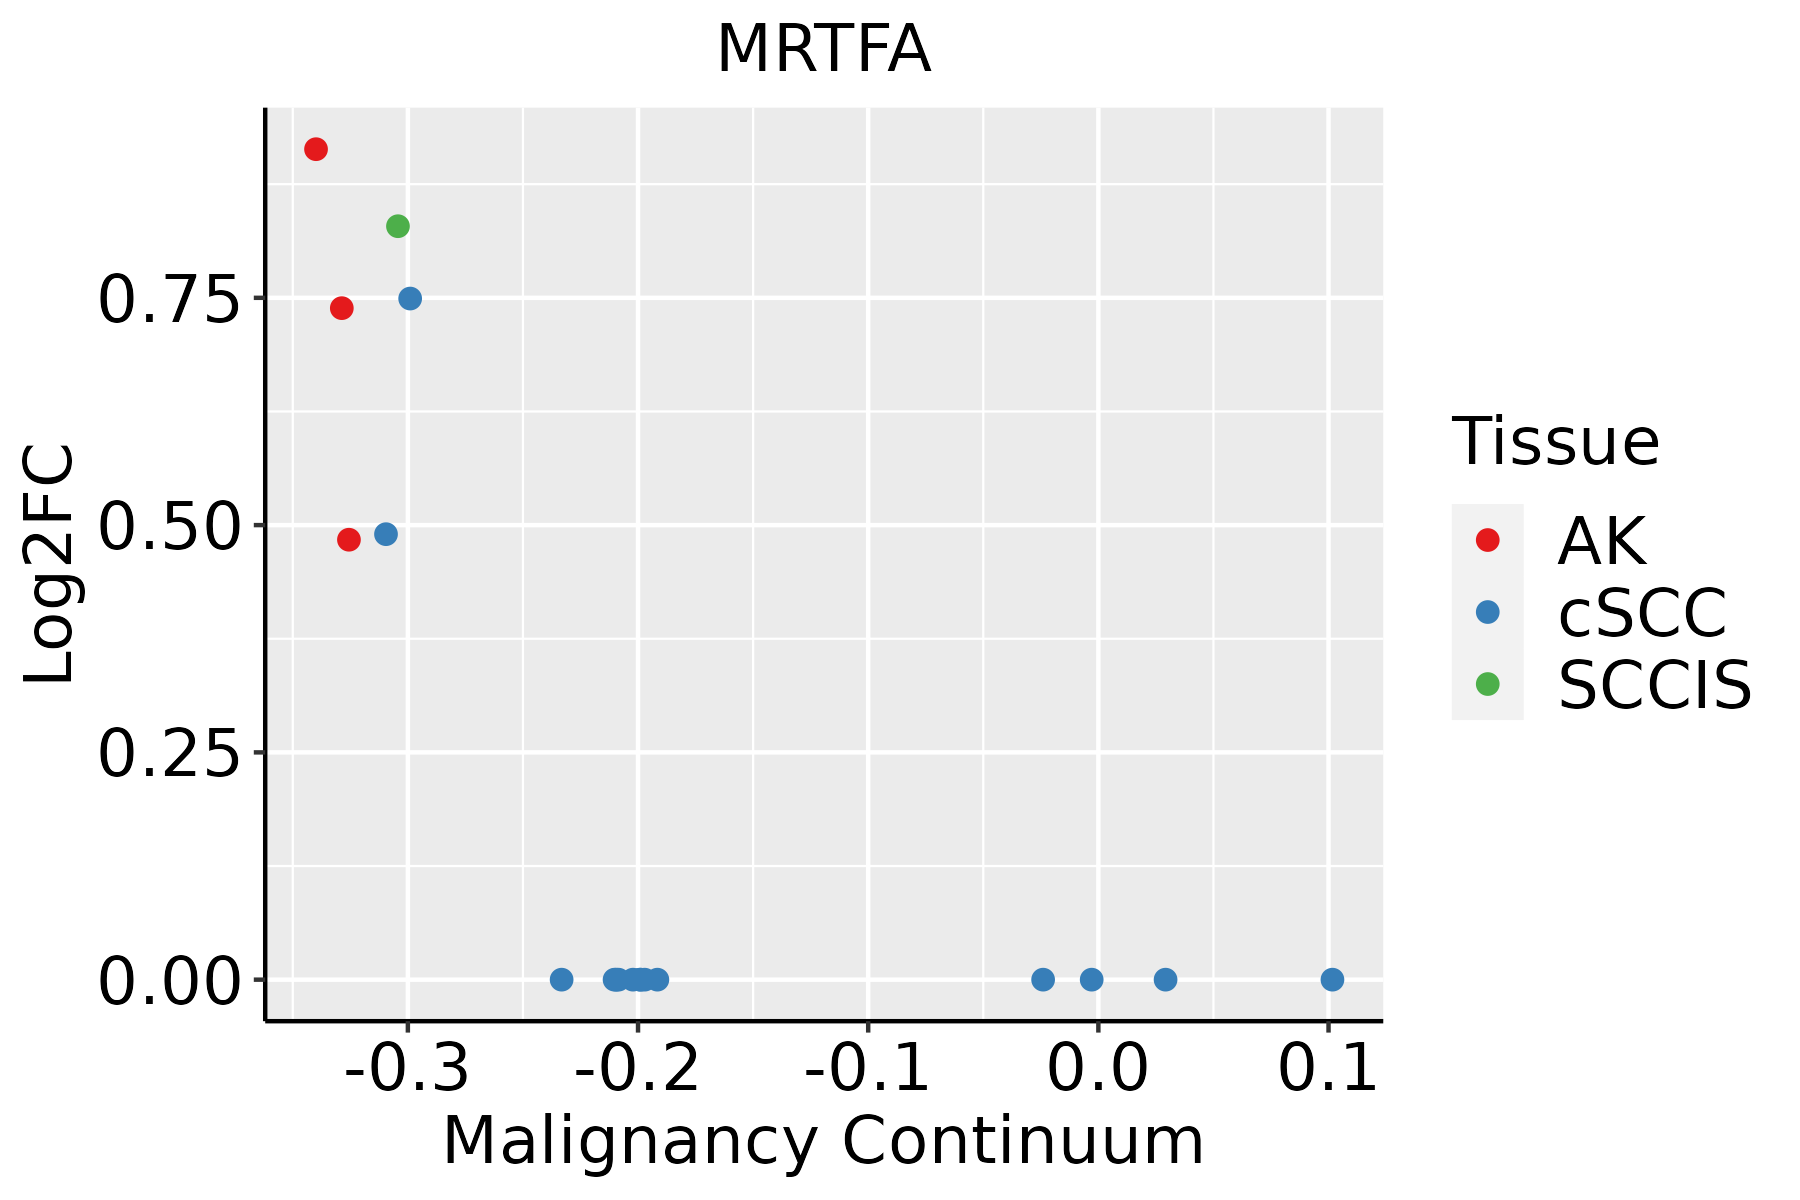 | AK: Actinic keratosis |
| cSCC: Cutaneous squamous cell carcinoma | ||
| SCCIS:squamous cell carcinoma in situ |
| ∗log2FC in expression of this searched gene in stem-like cells from each diseased tissue sample relative to stem-like cells in normal samples in each tissue plotted against the malignancy continuum. Samples are colored based on if they are from different disease stage. |
Top |
Malignant transformation related pathway analysis |
| Find out the enriched GO biological processes and KEGG pathways involved in transition from healthy to precancer to cancer |
| Tissue | Disease Stage | Enriched GO biological Processes |
| Colorectum | AD |  |
| Colorectum | SER |  |
| Colorectum | MSS |  |
| Colorectum | MSI-H |  |
| Colorectum | FAP |  |
| ∗Top 15 enriched GO BP terms are showed in the bar plot of each disease state in each tissue. Each row represents a significant GO biological process which is colored according to the -log10(p.adjust). |
| Page: 1 2 3 4 5 6 7 8 9 |
| GO ID | Tissue | Disease Stage | Description | Gene Ratio | Bg Ratio | pvalue | p.adjust | Count |
| GO:00905056 | Oral cavity | OSCC | epiboly involved in wound healing | 25/7305 | 34/18723 | 4.63e-05 | 3.90e-04 | 25 |
| GO:00020114 | Oral cavity | OSCC | morphogenesis of an epithelial sheet | 37/7305 | 57/18723 | 6.66e-05 | 5.38e-04 | 37 |
| GO:00905046 | Oral cavity | OSCC | epiboly | 25/7305 | 35/18723 | 1.02e-04 | 7.63e-04 | 25 |
| GO:006161417 | Oral cavity | OSCC | pri-miRNA transcription by RNA polymerase II | 35/7305 | 55/18723 | 1.88e-04 | 1.27e-03 | 35 |
| GO:190289317 | Oral cavity | OSCC | regulation of pri-miRNA transcription by RNA polymerase II | 34/7305 | 54/18723 | 3.12e-04 | 1.94e-03 | 34 |
| GO:19028958 | Oral cavity | OSCC | positive regulation of pri-miRNA transcription by RNA polymerase II | 26/7305 | 42/18723 | 2.22e-03 | 1.00e-02 | 26 |
| GO:00426927 | Oral cavity | OSCC | muscle cell differentiation | 175/7305 | 384/18723 | 4.79e-03 | 1.92e-02 | 175 |
| GO:004206026 | Oral cavity | EOLP | wound healing | 99/2218 | 422/18723 | 1.18e-11 | 1.85e-09 | 99 |
| GO:004269214 | Oral cavity | EOLP | muscle cell differentiation | 77/2218 | 384/18723 | 2.18e-06 | 4.91e-05 | 77 |
| GO:006161425 | Oral cavity | EOLP | pri-miRNA transcription by RNA polymerase II | 18/2218 | 55/18723 | 3.72e-05 | 5.14e-04 | 18 |
| GO:190289324 | Oral cavity | EOLP | regulation of pri-miRNA transcription by RNA polymerase II | 17/2218 | 54/18723 | 1.05e-04 | 1.19e-03 | 17 |
| GO:190289523 | Oral cavity | EOLP | positive regulation of pri-miRNA transcription by RNA polymerase II | 13/2218 | 42/18723 | 8.03e-04 | 6.31e-03 | 13 |
| GO:004206033 | Oral cavity | NEOLP | wound healing | 106/2005 | 422/18723 | 1.93e-17 | 1.91e-14 | 106 |
| GO:004269221 | Oral cavity | NEOLP | muscle cell differentiation | 71/2005 | 384/18723 | 2.97e-06 | 6.76e-05 | 71 |
| GO:004431913 | Oral cavity | NEOLP | wound healing, spreading of cells | 13/2005 | 34/18723 | 2.48e-05 | 3.93e-04 | 13 |
| GO:009050513 | Oral cavity | NEOLP | epiboly involved in wound healing | 13/2005 | 34/18723 | 2.48e-05 | 3.93e-04 | 13 |
| GO:009050413 | Oral cavity | NEOLP | epiboly | 13/2005 | 35/18723 | 3.57e-05 | 5.20e-04 | 13 |
| GO:006161431 | Oral cavity | NEOLP | pri-miRNA transcription by RNA polymerase II | 15/2005 | 55/18723 | 4.94e-04 | 4.39e-03 | 15 |
| GO:000201113 | Oral cavity | NEOLP | morphogenesis of an epithelial sheet | 15/2005 | 57/18723 | 7.45e-04 | 6.07e-03 | 15 |
| GO:190289531 | Oral cavity | NEOLP | positive regulation of pri-miRNA transcription by RNA polymerase II | 12/2005 | 42/18723 | 1.13e-03 | 8.46e-03 | 12 |
| Page: 1 2 3 4 5 6 7 |
| Pathway ID | Tissue | Disease Stage | Description | Gene Ratio | Bg Ratio | pvalue | p.adjust | qvalue | Count |
| Page: 1 |
Top |
Cell-cell communication analysis |
| Identification of potential cell-cell interactions between two cell types and their ligand-receptor pairs for different disease states |
| Ligand | Receptor | LRpair | Pathway | Tissue | Disease Stage |
| Page: 1 |
Top |
Single-cell gene regulatory network inference analysis |
| Find out the significant the regulons (TFs) and the target genes of each regulon across cell types for different disease states |
| TF | Cell Type | Tissue | Disease Stage | Target Gene | RSS | Regulon Activity |
| ∗The dot plots of a searched regulon are shown for all cell subpopulations in each disease state of each tissue based on the regulon specific score inferred using pySCENIC and by calculating the average expression. |
| Page: 1 |
Top |
Somatic mutation of malignant transformation related genes |
| Annotation of somatic variants for genes involved in malignant transformation |
| Hugo Symbol | Variant Class | Variant Classification | dbSNP RS | HGVSc | HGVSp | HGVSp Short | SWISSPROT | BIOTYPE | SIFT | PolyPhen | Tumor Sample Barcode | Tissue | Histology | Sex | Age | Stage | Therapy Types | Drugs | Outcome |
| Page: 1 |
Top |
Related drugs of malignant transformation related genes |
| Identification of chemicals and drugs interact with genes involved in malignant transfromation |
| (DGIdb 4.0) |
| Entrez ID | Symbol | Category | Interaction Types | Drug Claim Name | Drug Name | PMIDs |
| Page: 1 |

Copyright 2023-Present -The University of Texas Health Science Center at Houston |