| Tissue | Expression Dynamics | Abbreviation |
| Breast |  | IDC: Invasive ductal carcinoma |
| DCIS: Ductal carcinoma in situ |
| Precancer(BRCA1-mut): Precancerous lesion from BRCA1 mutation carriers |
| Cervix |  | CC: Cervix cancer |
| HSIL_HPV: HPV-infected high-grade squamous intraepithelial lesions |
| N_HPV: HPV-infected normal cervix |
| Esophagus |  | ESCC: Esophageal squamous cell carcinoma |
| HGIN: High-grade intraepithelial neoplasias |
| LGIN: Low-grade intraepithelial neoplasias |
| GC |  | CAG: Chronic atrophic gastritis |
| CAG with IM: Chronic atrophic gastritis with intestinal metaplasia |
| CSG: Chronic superficial gastritis |
| GC: Gastric cancer |
| SIM: Severe intestinal metaplasia |
| WIM: Wild intestinal metaplasia |
| Lung | 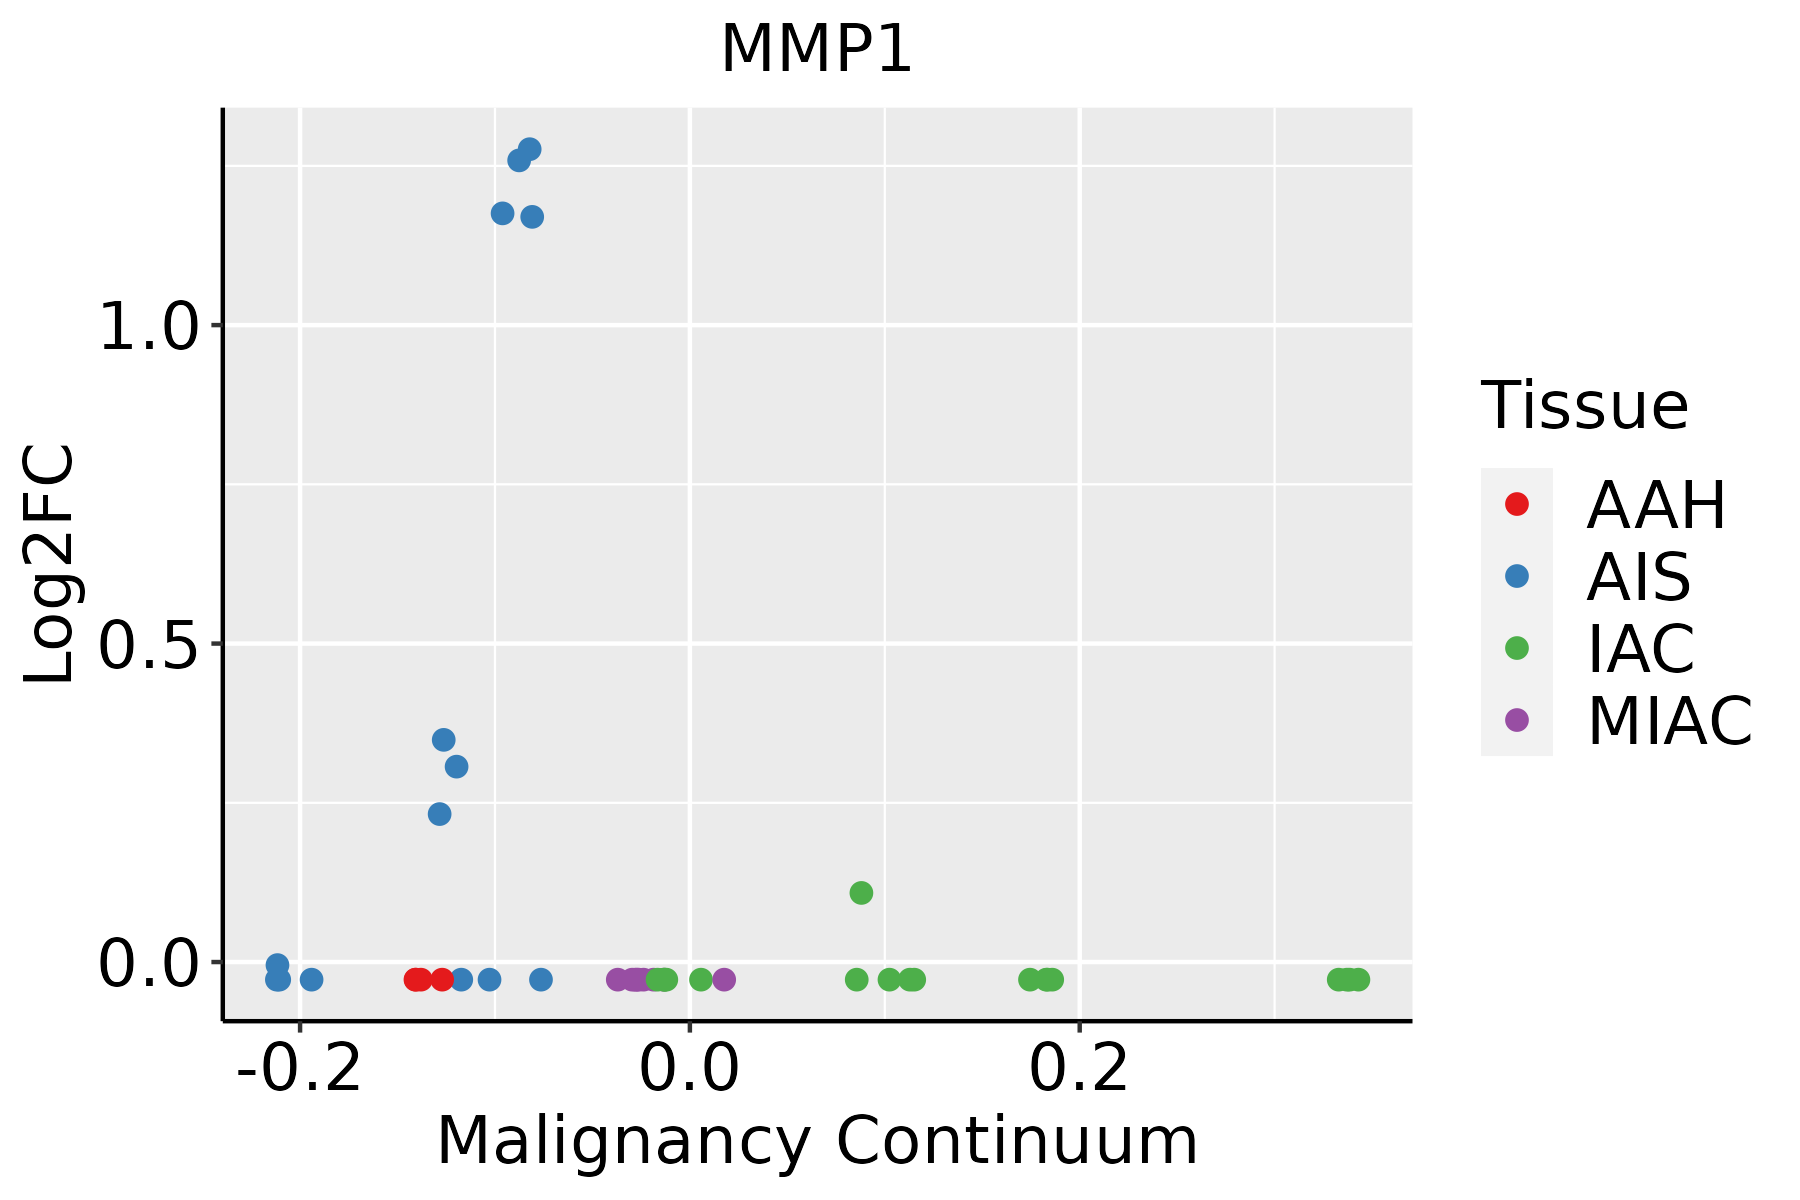 | AAH: Atypical adenomatous hyperplasia |
| AIS: Adenocarcinoma in situ |
| IAC: Invasive lung adenocarcinoma |
| MIA: Minimally invasive adenocarcinoma |
| Oral Cavity | 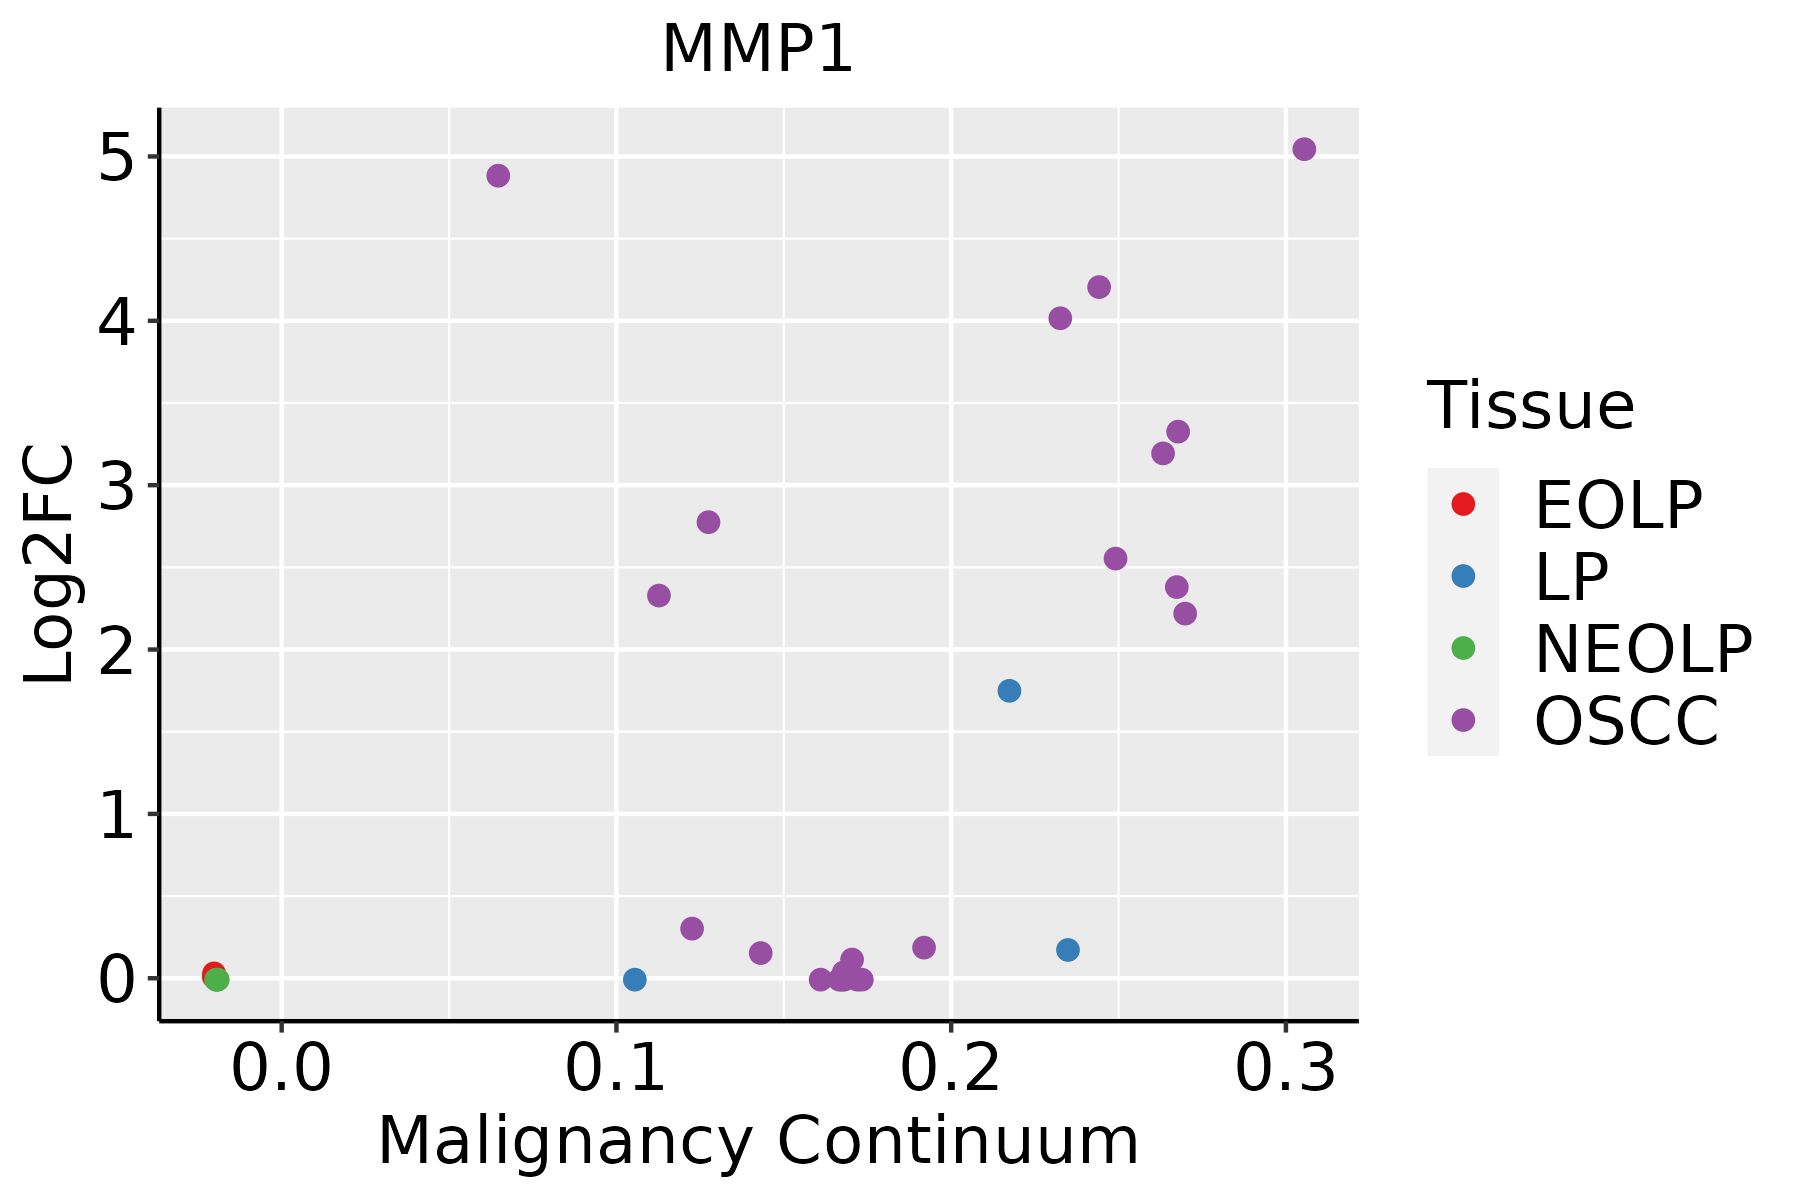 | EOLP: Erosive Oral lichen planus |
| LP: leukoplakia |
| NEOLP: Non-erosive oral lichen planus |
| OSCC: Oral squamous cell carcinoma |
| Skin | 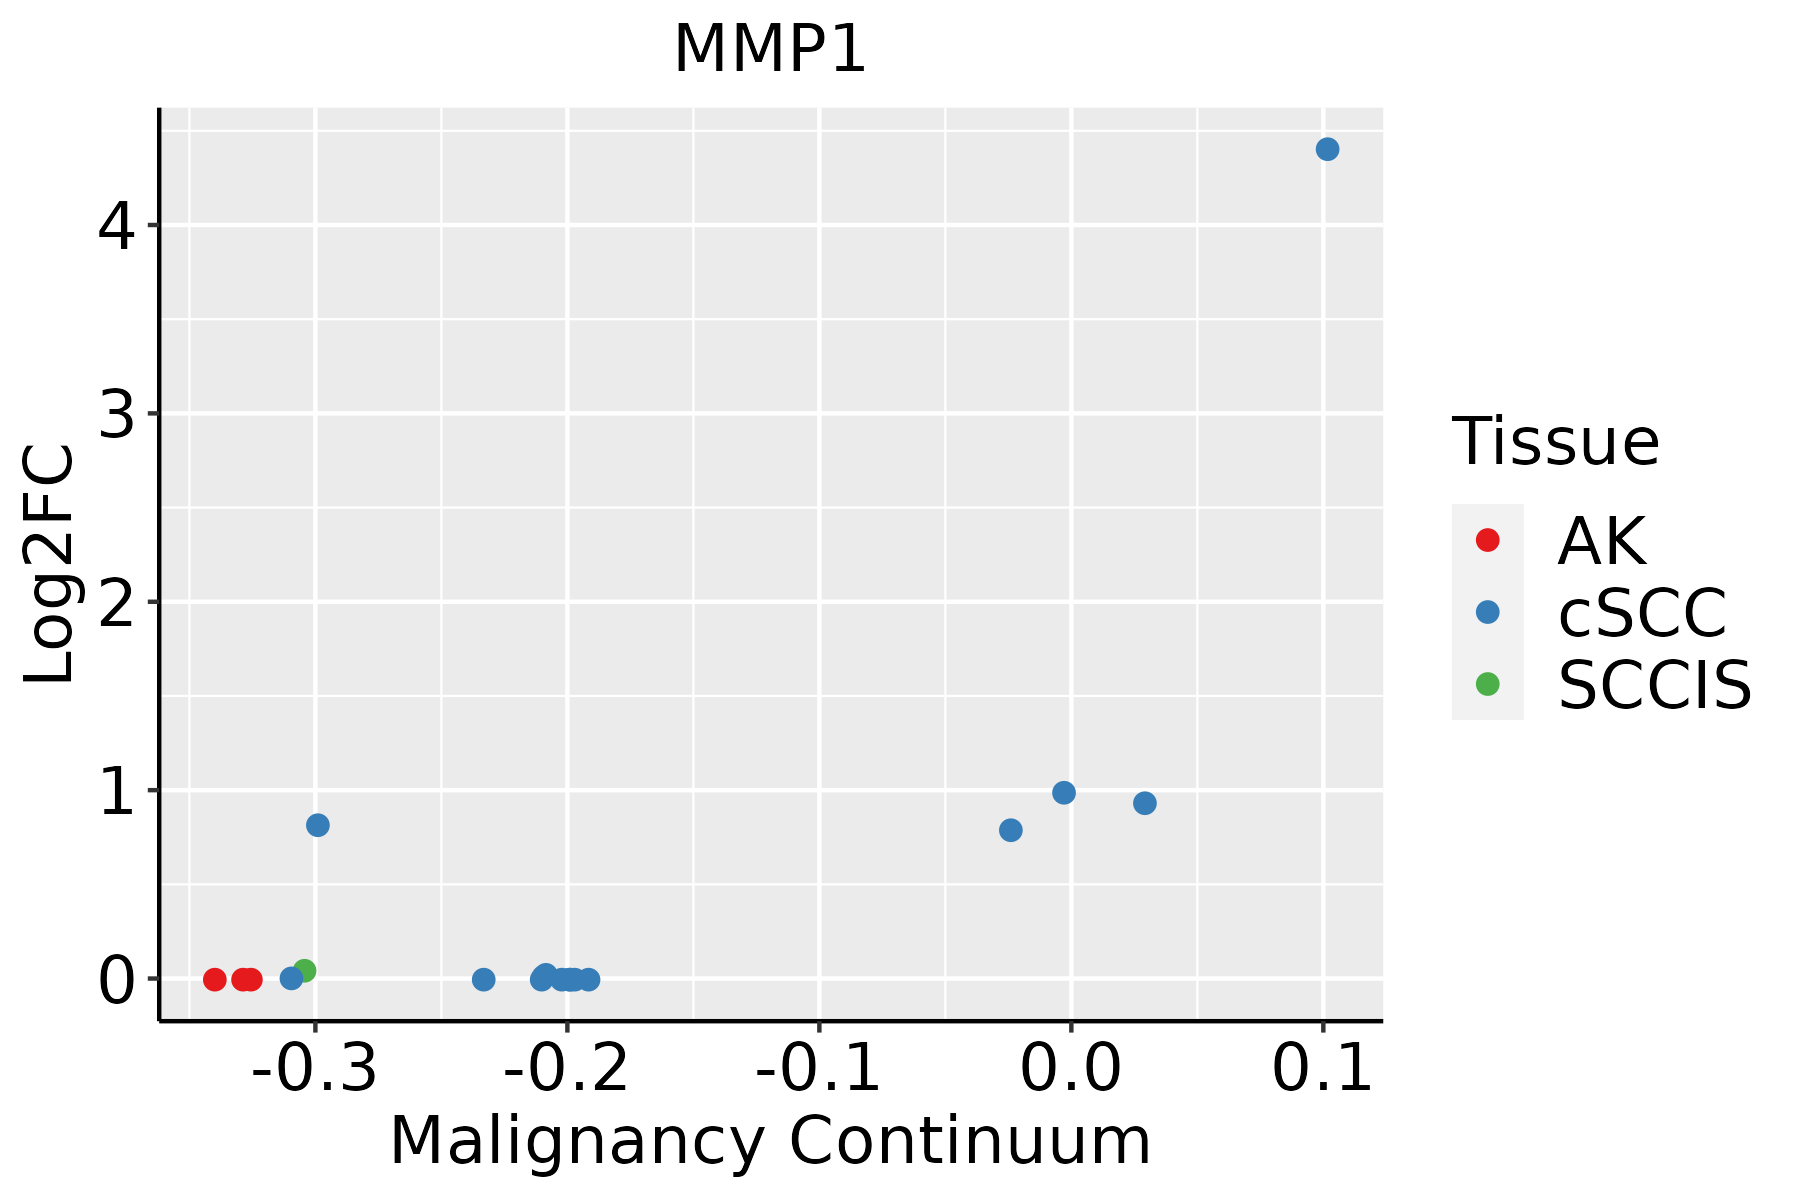 | AK: Actinic keratosis |
| cSCC: Cutaneous squamous cell carcinoma |
| SCCIS:squamous cell carcinoma in situ |
| Thyroid |  | ATC: Anaplastic thyroid cancer |
| HT: Hashimoto's thyroiditis |
| PTC: Papillary thyroid cancer |
| GO ID | Tissue | Disease Stage | Description | Gene Ratio | Bg Ratio | pvalue | p.adjust | Count |
| GO:0072655110 | Esophagus | ESCC | establishment of protein localization to mitochondrion | 97/8552 | 120/18723 | 2.17e-15 | 1.33e-13 | 97 |
| GO:0070585110 | Esophagus | ESCC | protein localization to mitochondrion | 100/8552 | 125/18723 | 2.96e-15 | 1.77e-13 | 100 |
| GO:000941113 | Esophagus | ESCC | response to UV | 115/8552 | 149/18723 | 3.29e-15 | 1.93e-13 | 115 |
| GO:0072659110 | Esophagus | ESCC | protein localization to plasma membrane | 193/8552 | 284/18723 | 1.95e-14 | 1.03e-12 | 193 |
| GO:0031334111 | Esophagus | ESCC | positive regulation of protein-containing complex assembly | 166/8552 | 237/18723 | 2.06e-14 | 1.07e-12 | 166 |
| GO:0006626110 | Esophagus | ESCC | protein targeting to mitochondrion | 81/8552 | 100/18723 | 3.60e-13 | 1.67e-11 | 81 |
| GO:199077819 | Esophagus | ESCC | protein localization to cell periphery | 217/8552 | 333/18723 | 4.08e-13 | 1.88e-11 | 217 |
| GO:000931419 | Esophagus | ESCC | response to radiation | 277/8552 | 456/18723 | 4.42e-11 | 1.43e-09 | 277 |
| GO:0070482111 | Esophagus | ESCC | response to oxygen levels | 218/8552 | 347/18723 | 6.91e-11 | 2.17e-09 | 218 |
| GO:005160418 | Esophagus | ESCC | protein maturation | 189/8552 | 294/18723 | 7.64e-11 | 2.39e-09 | 189 |
| GO:0016049110 | Esophagus | ESCC | cell growth | 289/8552 | 482/18723 | 1.29e-10 | 3.77e-09 | 289 |
| GO:0150115110 | Esophagus | ESCC | cell-substrate junction organization | 77/8552 | 101/18723 | 3.46e-10 | 9.57e-09 | 77 |
| GO:003464413 | Esophagus | ESCC | cellular response to UV | 70/8552 | 90/18723 | 4.59e-10 | 1.20e-08 | 70 |
| GO:000704418 | Esophagus | ESCC | cell-substrate junction assembly | 73/8552 | 95/18723 | 5.27e-10 | 1.35e-08 | 73 |
| GO:007121419 | Esophagus | ESCC | cellular response to abiotic stimulus | 206/8552 | 331/18723 | 7.52e-10 | 1.88e-08 | 206 |
| GO:010400419 | Esophagus | ESCC | cellular response to environmental stimulus | 206/8552 | 331/18723 | 7.52e-10 | 1.88e-08 | 206 |
| GO:0036293111 | Esophagus | ESCC | response to decreased oxygen levels | 201/8552 | 322/18723 | 8.37e-10 | 2.04e-08 | 201 |
| GO:0001666111 | Esophagus | ESCC | response to hypoxia | 192/8552 | 307/18723 | 1.59e-09 | 3.69e-08 | 192 |
| GO:000155819 | Esophagus | ESCC | regulation of cell growth | 248/8552 | 414/18723 | 2.97e-09 | 6.45e-08 | 248 |
| GO:003158919 | Esophagus | ESCC | cell-substrate adhesion | 221/8552 | 363/18723 | 3.06e-09 | 6.62e-08 | 221 |
| Pathway ID | Tissue | Disease Stage | Description | Gene Ratio | Bg Ratio | pvalue | p.adjust | qvalue | Count |
| hsa0517118 | Breast | Precancer | Coronavirus disease - COVID-19 | 81/684 | 232/8465 | 3.74e-32 | 2.36e-30 | 1.81e-30 | 81 |
| hsa0541718 | Breast | Precancer | Lipid and atherosclerosis | 37/684 | 215/8465 | 7.64e-06 | 9.29e-05 | 7.12e-05 | 37 |
| hsa0465716 | Breast | Precancer | IL-17 signaling pathway | 20/684 | 94/8465 | 4.74e-05 | 4.54e-04 | 3.48e-04 | 20 |
| hsa0532312 | Breast | Precancer | Rheumatoid arthritis | 19/684 | 93/8465 | 1.30e-04 | 1.14e-03 | 8.73e-04 | 19 |
| hsa052196 | Breast | Precancer | Bladder cancer | 9/684 | 41/8465 | 4.65e-03 | 2.72e-02 | 2.08e-02 | 9 |
| hsa0517119 | Breast | Precancer | Coronavirus disease - COVID-19 | 81/684 | 232/8465 | 3.74e-32 | 2.36e-30 | 1.81e-30 | 81 |
| hsa0541719 | Breast | Precancer | Lipid and atherosclerosis | 37/684 | 215/8465 | 7.64e-06 | 9.29e-05 | 7.12e-05 | 37 |
| hsa0465717 | Breast | Precancer | IL-17 signaling pathway | 20/684 | 94/8465 | 4.74e-05 | 4.54e-04 | 3.48e-04 | 20 |
| hsa0532313 | Breast | Precancer | Rheumatoid arthritis | 19/684 | 93/8465 | 1.30e-04 | 1.14e-03 | 8.73e-04 | 19 |
| hsa0521913 | Breast | Precancer | Bladder cancer | 9/684 | 41/8465 | 4.65e-03 | 2.72e-02 | 2.08e-02 | 9 |
| hsa0517120 | Cervix | CC | Coronavirus disease - COVID-19 | 111/1267 | 232/8465 | 1.82e-33 | 5.90e-31 | 3.49e-31 | 111 |
| hsa0541720 | Cervix | CC | Lipid and atherosclerosis | 65/1267 | 215/8465 | 6.47e-09 | 1.10e-07 | 6.52e-08 | 65 |
| hsa0465718 | Cervix | CC | IL-17 signaling pathway | 31/1267 | 94/8465 | 8.71e-06 | 7.43e-05 | 4.39e-05 | 31 |
| hsa052197 | Cervix | CC | Bladder cancer | 16/1267 | 41/8465 | 1.45e-04 | 9.05e-04 | 5.35e-04 | 16 |
| hsa0532314 | Cervix | CC | Rheumatoid arthritis | 27/1267 | 93/8465 | 3.64e-04 | 1.82e-03 | 1.07e-03 | 27 |
| hsa049265 | Cervix | CC | Relaxin signaling pathway | 30/1267 | 129/8465 | 7.92e-03 | 2.56e-02 | 1.51e-02 | 30 |
| hsa05171110 | Cervix | CC | Coronavirus disease - COVID-19 | 111/1267 | 232/8465 | 1.82e-33 | 5.90e-31 | 3.49e-31 | 111 |
| hsa05417110 | Cervix | CC | Lipid and atherosclerosis | 65/1267 | 215/8465 | 6.47e-09 | 1.10e-07 | 6.52e-08 | 65 |
| hsa0465719 | Cervix | CC | IL-17 signaling pathway | 31/1267 | 94/8465 | 8.71e-06 | 7.43e-05 | 4.39e-05 | 31 |
| hsa0521914 | Cervix | CC | Bladder cancer | 16/1267 | 41/8465 | 1.45e-04 | 9.05e-04 | 5.35e-04 | 16 |
| Hugo Symbol | Variant Class | Variant Classification | dbSNP RS | HGVSc | HGVSp | HGVSp Short | SWISSPROT | BIOTYPE | SIFT | PolyPhen | Tumor Sample Barcode | Tissue | Histology | Sex | Age | Stage | Therapy Types | Drugs | Outcome |
| MMP1 | SNV | Missense_Mutation | novel | c.593N>T | p.Asp198Val | p.D198V | P03956 | protein_coding | deleterious(0) | probably_damaging(1) | TCGA-A7-A56D-01 | Breast | breast invasive carcinoma | Female | >=65 | I/II | Hormone Therapy | arimidex | SD |
| MMP1 | SNV | Missense_Mutation | novel | c.139G>T | p.Asp47Tyr | p.D47Y | P03956 | protein_coding | deleterious(0.03) | benign(0.183) | TCGA-A8-A06Q-01 | Breast | breast invasive carcinoma | Female | <65 | III/IV | Unknown | Unknown | SD |
| MMP1 | insertion | Frame_Shift_Ins | novel | c.1264_1265insAACACCTTCT | p.Ile422LysfsTer9 | p.I422Kfs*9 | P03956 | protein_coding | | | TCGA-AR-A0TU-01 | Breast | breast invasive carcinoma | Female | <65 | I/II | Unspecific | Doxorubicin | SD |
| MMP1 | insertion | Nonsense_Mutation | novel | c.319_320insATTTATCAGTTTTGTAAATAAGAAAAATATTAAATATTAGG | p.Pro107HisfsTer6 | p.P107Hfs*6 | P03956 | protein_coding | | | TCGA-BH-A0B8-01 | Breast | breast invasive carcinoma | Female | <65 | I/II | Hormone Therapy | arimidex | SD |
| MMP1 | SNV | Missense_Mutation | | c.403N>C | p.Glu135Gln | p.E135Q | P03956 | protein_coding | tolerated(0.25) | benign(0.034) | TCGA-DG-A2KM-01 | Cervix | cervical & endocervical cancer | Female | <65 | I/II | Chemotherapy | cisplatin | SD |
| MMP1 | SNV | Missense_Mutation | rs754506439 | c.1021N>T | p.Arg341Trp | p.R341W | P03956 | protein_coding | deleterious(0.01) | probably_damaging(0.989) | TCGA-DS-A7WH-01 | Cervix | cervical & endocervical cancer | Female | <65 | I/II | Chemotherapy | cisplatin | CR |
| MMP1 | SNV | Missense_Mutation | novel | c.385N>A | p.Asp129Asn | p.D129N | P03956 | protein_coding | tolerated(0.05) | benign(0.152) | TCGA-IR-A3LH-01 | Cervix | cervical & endocervical cancer | Female | <65 | I/II | Chemotherapy | cisplatin | CR |
| MMP1 | SNV | Missense_Mutation | | c.533N>C | p.Gly178Ala | p.G178A | P03956 | protein_coding | deleterious(0.03) | benign(0.162) | TCGA-IR-A3LK-01 | Cervix | cervical & endocervical cancer | Female | >=65 | I/II | Chemotherapy | cisplatin | PD |
| MMP1 | SNV | Missense_Mutation | novel | c.484N>C | p.Ser162Pro | p.S162P | P03956 | protein_coding | deleterious(0) | probably_damaging(0.988) | TCGA-A6-2675-01 | Colorectum | colon adenocarcinoma | Male | >=65 | I/II | Unknown | Unknown | SD |
| MMP1 | SNV | Missense_Mutation | | c.1078N>C | p.Tyr360His | p.Y360H | P03956 | protein_coding | deleterious(0.02) | probably_damaging(0.983) | TCGA-AA-3672-01 | Colorectum | colon adenocarcinoma | Female | >=65 | III/IV | Unknown | Unknown | SD |
| Entrez ID | Symbol | Category | Interaction Types | Drug Claim Name | Drug Name | PMIDs |
| 4312 | MMP1 | DRUGGABLE GENOME, PROTEASE, ENZYME | | PMID29130358-Compound-Figure18(14a) | | |
| 4312 | MMP1 | DRUGGABLE GENOME, PROTEASE, ENZYME | | RIBAVIRIN | RIBAVIRIN | 16699498 |
| 4312 | MMP1 | DRUGGABLE GENOME, PROTEASE, ENZYME | inhibitor | 252827503 | CGS-27023A | |
| 4312 | MMP1 | DRUGGABLE GENOME, PROTEASE, ENZYME | inhibitor | CHEMBL2364574 | DOXYCYCLINE CALCIUM | |
| 4312 | MMP1 | DRUGGABLE GENOME, PROTEASE, ENZYME | | IMMUNOSUPPRESSIVE | | 16914544 |
| 4312 | MMP1 | DRUGGABLE GENOME, PROTEASE, ENZYME | | LAMIVUDINE | LAMIVUDINE | 15309715 |
| 4312 | MMP1 | DRUGGABLE GENOME, PROTEASE, ENZYME | | TYROSINE KINASE INHIBITOR | | 15324351 |
| 4312 | MMP1 | DRUGGABLE GENOME, PROTEASE, ENZYME | | PMID29130358-Compound-Figure10(2a) | | |
| 4312 | MMP1 | DRUGGABLE GENOME, PROTEASE, ENZYME | inhibitor | 178103080 | CIPEMASTAT | |
| 4312 | MMP1 | DRUGGABLE GENOME, PROTEASE, ENZYME | | Marimastat | MARIMASTAT | |


