
|
|||||
|
 | |
| |
| |
| |
| |
| |
|
Gene: MIA |
Gene summary for MIA |
| Gene information | Species | Human | Gene symbol | MIA | Gene ID | 8190 |
| Gene name | MIA SH3 domain containing | |
| Gene Alias | CD-RAP | |
| Cytomap | 19q13.2 | |
| Gene Type | protein-coding | GO ID | GO:0007154 | UniProtAcc | A0A024R0P1 |
Top |
Malignant transformation analysis |
| Identification of the aberrant gene expression in precancerous and cancerous lesions by comparing the gene expression of stem-like cells in diseased tissues with normal stem cells |
| Entrez ID | Symbol | Replicates | Species | Organ | Tissue | Adj P-value | Log2FC | Malignancy |
| 8190 | MIA | GSM4909281 | Human | Breast | IDC | 3.04e-53 | 9.78e-01 | 0.21 |
| 8190 | MIA | GSM4909282 | Human | Breast | IDC | 5.85e-05 | 3.01e-01 | -0.0288 |
| 8190 | MIA | GSM4909285 | Human | Breast | IDC | 4.96e-03 | 1.63e-01 | 0.21 |
| 8190 | MIA | GSM4909286 | Human | Breast | IDC | 1.23e-03 | 2.25e-01 | 0.1081 |
| 8190 | MIA | GSM4909290 | Human | Breast | IDC | 6.20e-06 | -2.03e-01 | 0.2096 |
| 8190 | MIA | GSM4909291 | Human | Breast | IDC | 1.86e-04 | -2.03e-01 | 0.1753 |
| 8190 | MIA | GSM4909294 | Human | Breast | IDC | 8.07e-06 | -1.87e-01 | 0.2022 |
| 8190 | MIA | GSM4909299 | Human | Breast | IDC | 2.92e-42 | 9.57e-01 | 0.035 |
| 8190 | MIA | GSM4909301 | Human | Breast | IDC | 1.55e-03 | -1.98e-01 | 0.1577 |
| 8190 | MIA | GSM4909302 | Human | Breast | IDC | 1.35e-03 | -1.78e-01 | 0.1545 |
| 8190 | MIA | GSM4909304 | Human | Breast | IDC | 8.07e-06 | -2.02e-01 | 0.1636 |
| 8190 | MIA | GSM4909308 | Human | Breast | IDC | 1.06e-07 | -2.03e-01 | 0.158 |
| 8190 | MIA | GSM4909309 | Human | Breast | IDC | 4.42e-03 | 4.21e-01 | 0.0483 |
| 8190 | MIA | GSM4909311 | Human | Breast | IDC | 4.70e-05 | 3.39e-02 | 0.1534 |
| 8190 | MIA | GSM4909312 | Human | Breast | IDC | 3.78e-06 | -2.03e-01 | 0.1552 |
| 8190 | MIA | GSM4909313 | Human | Breast | IDC | 2.74e-12 | 6.43e-01 | 0.0391 |
| 8190 | MIA | GSM4909315 | Human | Breast | IDC | 3.78e-06 | -2.03e-01 | 0.21 |
| 8190 | MIA | GSM4909319 | Human | Breast | IDC | 3.78e-06 | -2.03e-01 | 0.1563 |
| 8190 | MIA | GSM4909321 | Human | Breast | IDC | 8.07e-06 | -2.03e-01 | 0.1559 |
| 8190 | MIA | ctrl6 | Human | Breast | Precancer | 1.43e-02 | -2.03e-01 | -0.0061 |
| Page: 1 2 3 4 |
| Tissue | Expression Dynamics | Abbreviation |
| Breast | 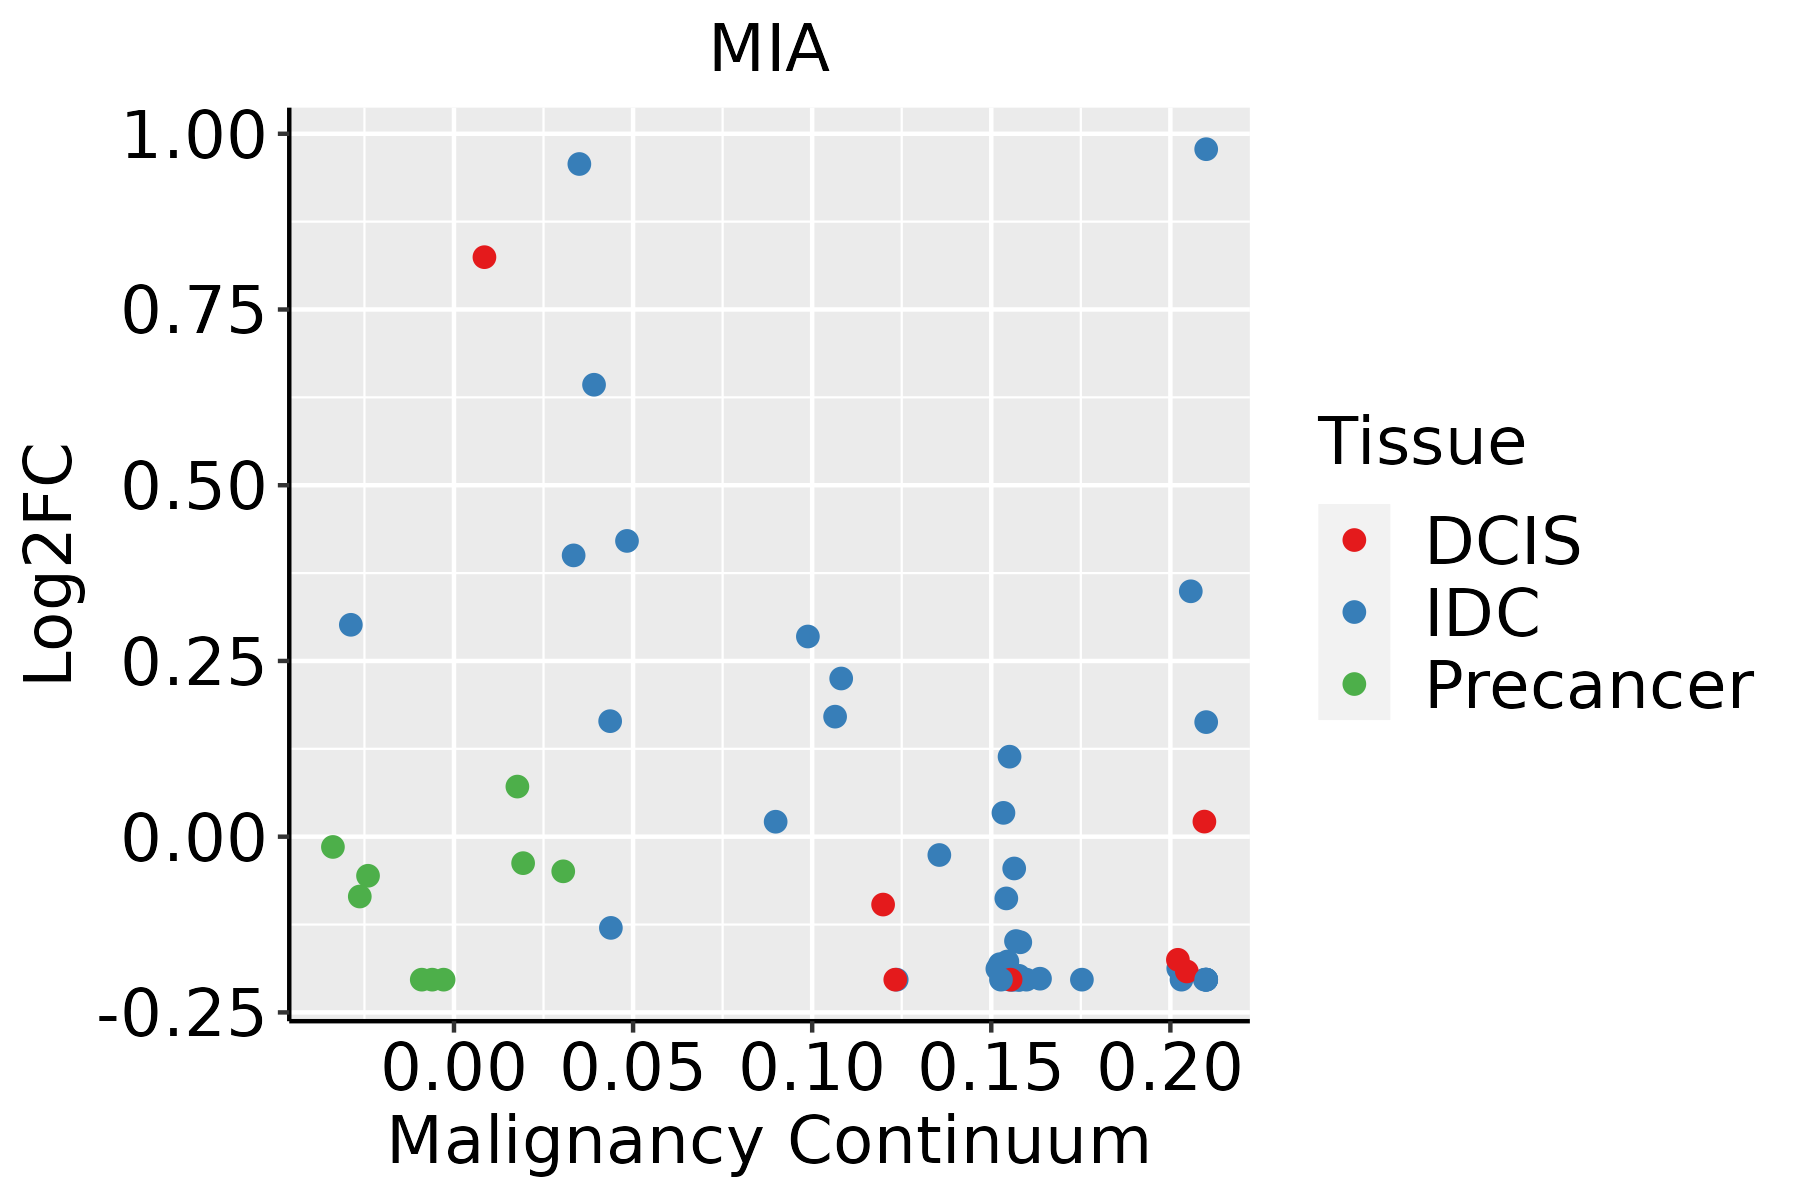 | IDC: Invasive ductal carcinoma |
| DCIS: Ductal carcinoma in situ | ||
| Precancer(BRCA1-mut): Precancerous lesion from BRCA1 mutation carriers | ||
| Esophagus | 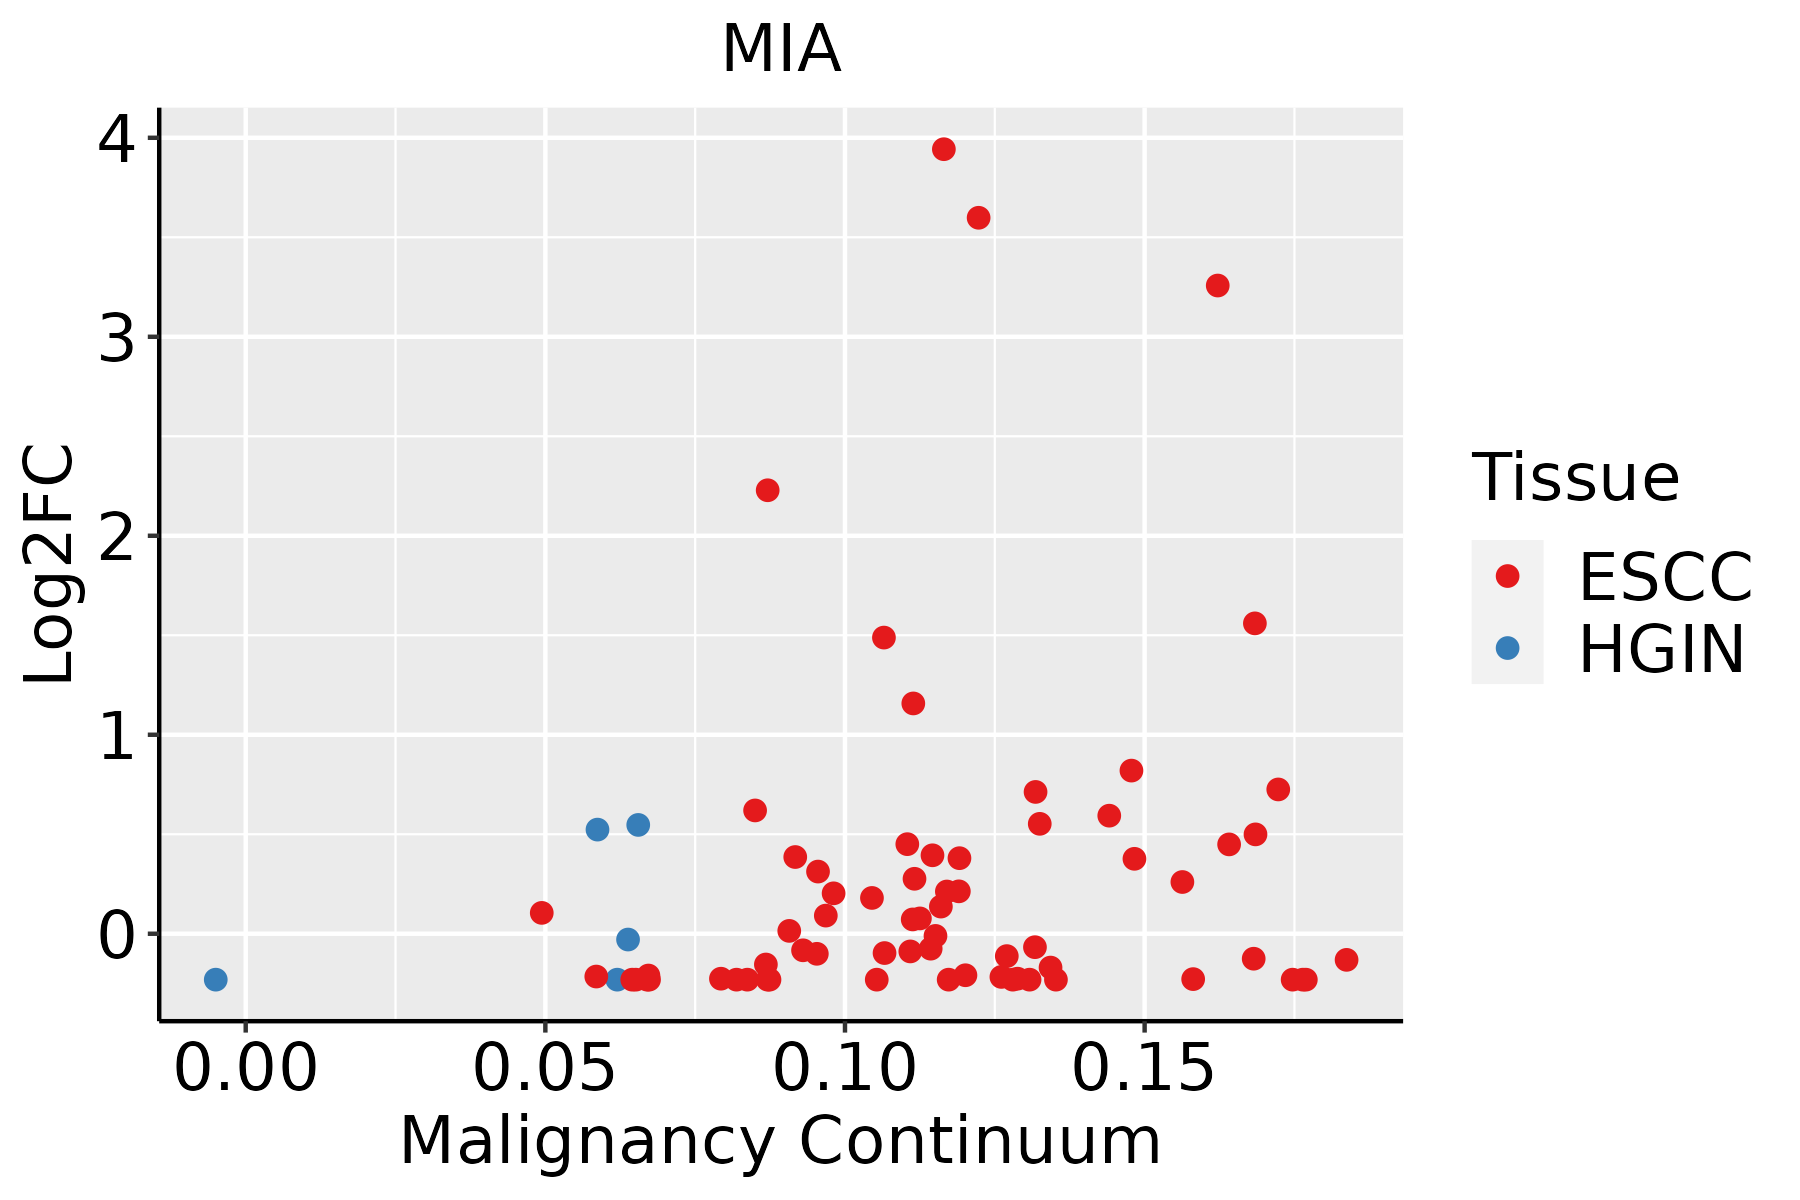 | ESCC: Esophageal squamous cell carcinoma |
| HGIN: High-grade intraepithelial neoplasias | ||
| LGIN: Low-grade intraepithelial neoplasias | ||
| GC | 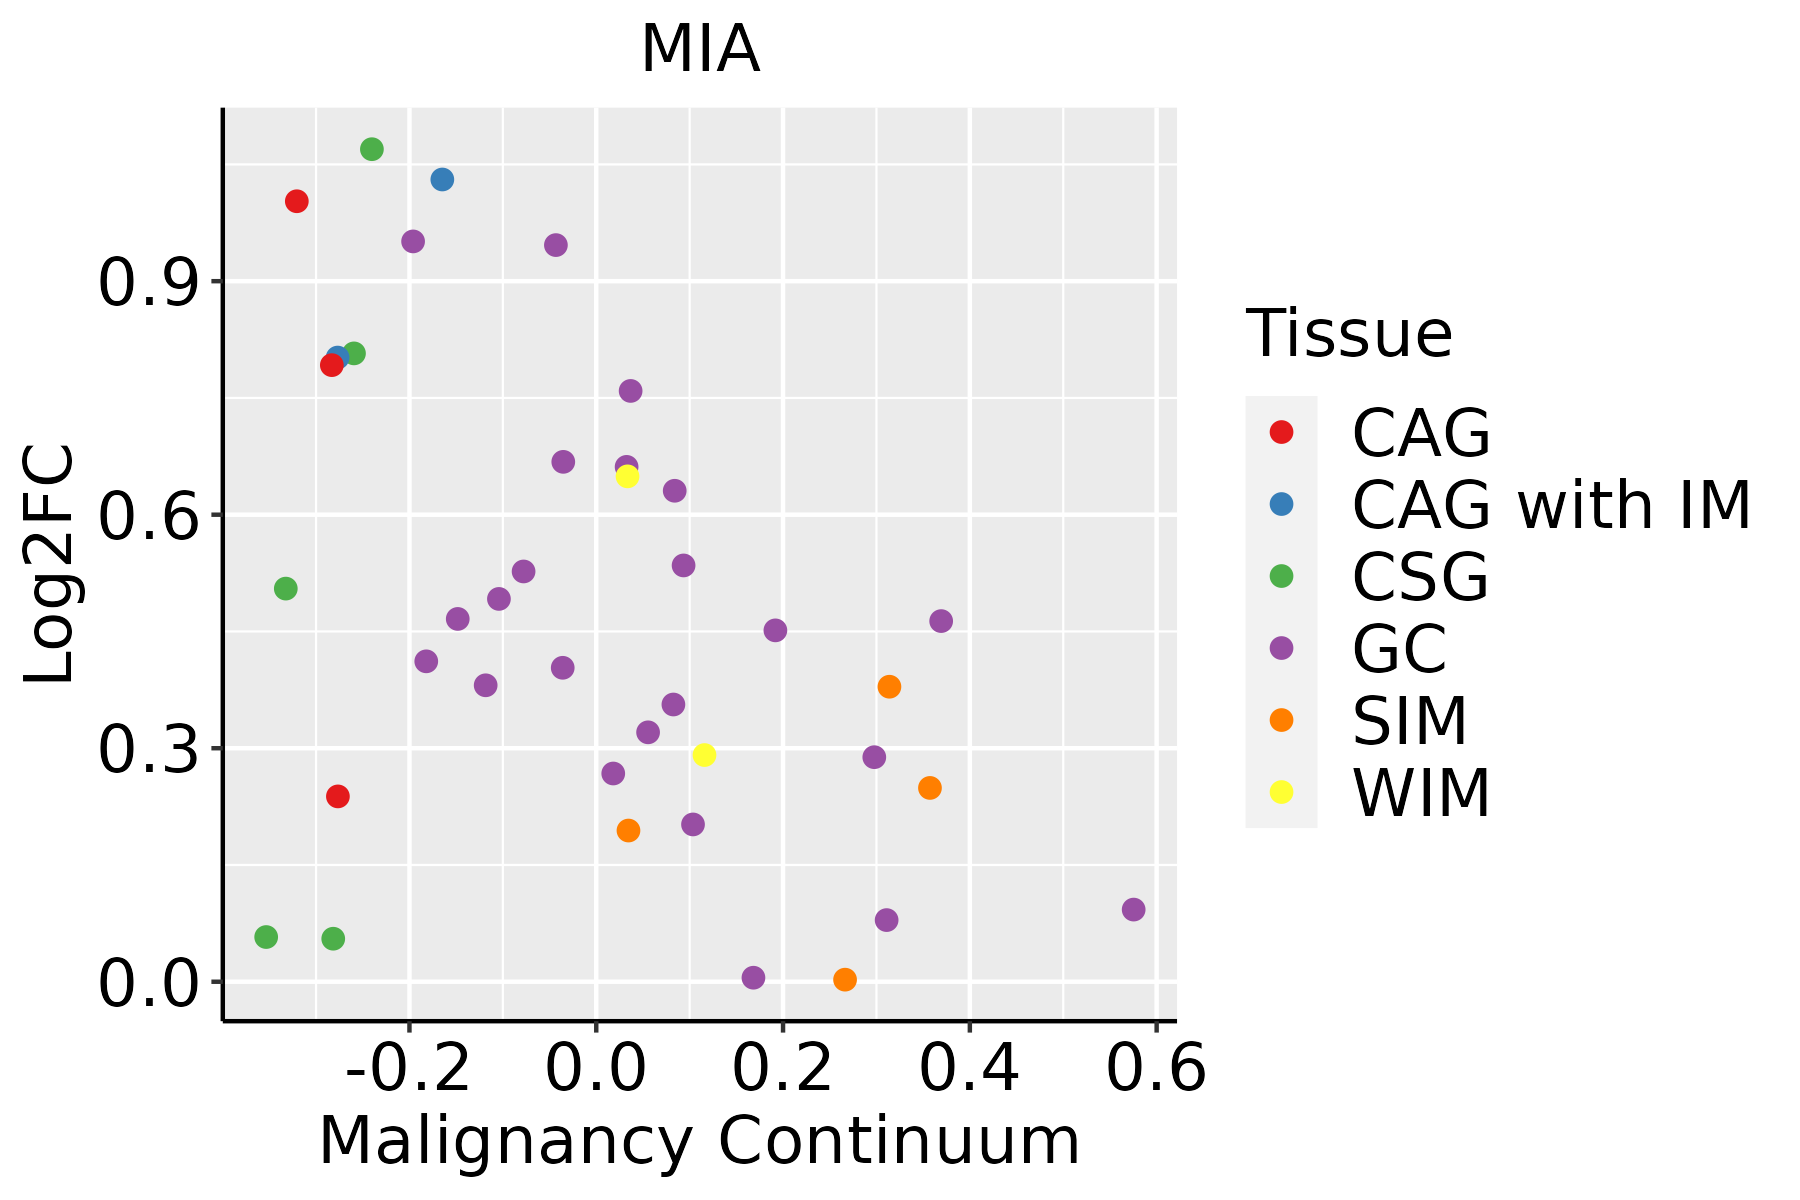 | CAG: Chronic atrophic gastritis |
| CAG with IM: Chronic atrophic gastritis with intestinal metaplasia | ||
| CSG: Chronic superficial gastritis | ||
| GC: Gastric cancer | ||
| SIM: Severe intestinal metaplasia | ||
| WIM: Wild intestinal metaplasia |
| ∗log2FC in expression of this searched gene in stem-like cells from each diseased tissue sample relative to stem-like cells in normal samples in each tissue plotted against the malignancy continuum. Samples are colored based on if they are from different disease stage. |
Top |
Malignant transformation related pathway analysis |
| Find out the enriched GO biological processes and KEGG pathways involved in transition from healthy to precancer to cancer |
| Tissue | Disease Stage | Enriched GO biological Processes |
| Colorectum | AD |  |
| Colorectum | SER |  |
| Colorectum | MSS |  |
| Colorectum | MSI-H |  |
| Colorectum | FAP |  |
| ∗Top 15 enriched GO BP terms are showed in the bar plot of each disease state in each tissue. Each row represents a significant GO biological process which is colored according to the -log10(p.adjust). |
| Page: 1 2 3 4 5 6 7 8 9 |
| GO ID | Tissue | Disease Stage | Description | Gene Ratio | Bg Ratio | pvalue | p.adjust | Count |
| GO:009013020 | Esophagus | ESCC | tissue migration | 190/8552 | 365/18723 | 7.91e-03 | 2.82e-02 | 190 |
| GO:00354595 | Esophagus | ESCC | vesicle cargo loading | 19/8552 | 27/18723 | 8.35e-03 | 2.95e-02 | 19 |
| GO:000715918 | Esophagus | ESCC | leukocyte cell-cell adhesion | 192/8552 | 371/18723 | 1.03e-02 | 3.51e-02 | 192 |
| GO:190303717 | Esophagus | ESCC | regulation of leukocyte cell-cell adhesion | 174/8552 | 336/18723 | 1.36e-02 | 4.43e-02 | 174 |
| GO:00481936 | Liver | NAFLD | Golgi vesicle transport | 66/1882 | 296/18723 | 3.66e-10 | 9.30e-08 | 66 |
| GO:00420607 | Liver | NAFLD | wound healing | 84/1882 | 422/18723 | 6.56e-10 | 1.37e-07 | 84 |
| GO:00069007 | Liver | NAFLD | vesicle budding from membrane | 17/1882 | 61/18723 | 7.31e-05 | 1.52e-03 | 17 |
| GO:00354593 | Liver | NAFLD | vesicle cargo loading | 10/1882 | 27/18723 | 1.74e-04 | 3.08e-03 | 10 |
| GO:00160505 | Liver | NAFLD | vesicle organization | 50/1882 | 300/18723 | 2.42e-04 | 4.06e-03 | 50 |
| GO:0090110 | Liver | NAFLD | COPII-coated vesicle cargo loading | 7/1882 | 15/18723 | 3.18e-04 | 4.95e-03 | 7 |
| GO:00901143 | Liver | NAFLD | COPII-coated vesicle budding | 10/1882 | 29/18723 | 3.42e-04 | 5.22e-03 | 10 |
| GO:00068885 | Liver | NAFLD | endoplasmic reticulum to Golgi vesicle-mediated transport | 26/1882 | 130/18723 | 4.78e-04 | 6.78e-03 | 26 |
| GO:00355926 | Liver | NAFLD | establishment of protein localization to extracellular region | 52/1882 | 360/18723 | 4.80e-03 | 3.81e-02 | 52 |
| GO:00016676 | Liver | NAFLD | ameboidal-type cell migration | 65/1882 | 475/18723 | 6.32e-03 | 4.69e-02 | 65 |
| GO:00093066 | Liver | NAFLD | protein secretion | 51/1882 | 359/18723 | 7.17e-03 | 4.96e-02 | 51 |
| GO:004819311 | Liver | Cirrhotic | Golgi vesicle transport | 153/4634 | 296/18723 | 1.02e-23 | 6.43e-21 | 153 |
| GO:000688811 | Liver | Cirrhotic | endoplasmic reticulum to Golgi vesicle-mediated transport | 77/4634 | 130/18723 | 5.78e-17 | 7.56e-15 | 77 |
| GO:001605011 | Liver | Cirrhotic | vesicle organization | 133/4634 | 300/18723 | 7.35e-14 | 6.41e-12 | 133 |
| GO:000690012 | Liver | Cirrhotic | vesicle budding from membrane | 41/4634 | 61/18723 | 3.12e-12 | 2.25e-10 | 41 |
| GO:00709724 | Liver | Cirrhotic | protein localization to endoplasmic reticulum | 45/4634 | 74/18723 | 4.79e-11 | 2.73e-09 | 45 |
| Page: 1 2 3 4 5 6 7 8 9 10 11 12 13 14 15 16 |
| Pathway ID | Tissue | Disease Stage | Description | Gene Ratio | Bg Ratio | pvalue | p.adjust | qvalue | Count |
| Page: 1 |
Top |
Cell-cell communication analysis |
| Identification of potential cell-cell interactions between two cell types and their ligand-receptor pairs for different disease states |
| Ligand | Receptor | LRpair | Pathway | Tissue | Disease Stage |
| Page: 1 |
Top |
Single-cell gene regulatory network inference analysis |
| Find out the significant the regulons (TFs) and the target genes of each regulon across cell types for different disease states |
| TF | Cell Type | Tissue | Disease Stage | Target Gene | RSS | Regulon Activity |
| ∗The dot plots of a searched regulon are shown for all cell subpopulations in each disease state of each tissue based on the regulon specific score inferred using pySCENIC and by calculating the average expression. |
| Page: 1 |
Top |
Somatic mutation of malignant transformation related genes |
| Annotation of somatic variants for genes involved in malignant transformation |
| Hugo Symbol | Variant Class | Variant Classification | dbSNP RS | HGVSc | HGVSp | HGVSp Short | SWISSPROT | BIOTYPE | SIFT | PolyPhen | Tumor Sample Barcode | Tissue | Histology | Sex | Age | Stage | Therapy Types | Drugs | Outcome |
| MIA | SNV | Missense_Mutation | novel | c.350N>C | p.Gly117Ala | p.G117A | Q16674 | protein_coding | tolerated(0.85) | benign(0) | TCGA-AC-A23H-01 | Breast | breast invasive carcinoma | Female | >=65 | I/II | Unknown | Unknown | PD |
| MIA | insertion | Nonsense_Mutation | novel | c.388_389insTGGCATTTAAGCTGAGATTCATATGACAAG | p.Cys130delinsLeuAlaPheLysLeuArgPheIleTerGlnGly | p.C130delinsLAFKLRFI*QG | Q16674 | protein_coding | TCGA-A8-A09B-01 | Breast | breast invasive carcinoma | Female | <65 | III/IV | Chemotherapy | 5-fluorouracil | SD | ||
| MIA | SNV | Missense_Mutation | novel | c.328G>A | p.Glu110Lys | p.E110K | Q16674 | protein_coding | deleterious(0) | probably_damaging(0.994) | TCGA-MY-A913-01 | Cervix | cervical & endocervical cancer | Female | <65 | I/II | Chemotherapy | cisplatin | CR |
| MIA | SNV | Missense_Mutation | novel | c.172N>A | p.Asp58Asn | p.D58N | Q16674 | protein_coding | deleterious(0.01) | probably_damaging(0.999) | TCGA-AZ-4315-01 | Colorectum | colon adenocarcinoma | Male | <65 | I/II | Unknown | Unknown | SD |
| MIA | SNV | Missense_Mutation | c.166N>A | p.Ala56Thr | p.A56T | Q16674 | protein_coding | deleterious(0.04) | benign(0.368) | TCGA-CM-4746-01 | Colorectum | colon adenocarcinoma | Male | <65 | I/II | Unknown | Unknown | SD | |
| MIA | SNV | Missense_Mutation | rs375928719 | c.107G>A | p.Cys36Tyr | p.C36Y | Q16674 | protein_coding | deleterious(0) | probably_damaging(0.997) | TCGA-AG-3592-01 | Colorectum | rectum adenocarcinoma | Male | >=65 | I/II | Unknown | Unknown | SD |
| MIA | insertion | Frame_Shift_Ins | novel | c.84_85insA | p.Leu30AlafsTer3 | p.L30Afs*3 | Q16674 | protein_coding | TCGA-AA-3966-01 | Colorectum | colon adenocarcinoma | Female | >=65 | I/II | Unknown | Unknown | SD | ||
| MIA | SNV | Missense_Mutation | novel | c.122N>A | p.Cys41Tyr | p.C41Y | Q16674 | protein_coding | deleterious(0) | probably_damaging(0.997) | TCGA-A5-A1OF-01 | Endometrium | uterine corpus endometrioid carcinoma | Female | <65 | I/II | Unknown | Unknown | SD |
| MIA | SNV | Missense_Mutation | c.296N>A | p.Arg99His | p.R99H | Q16674 | protein_coding | tolerated(0.06) | benign(0.03) | TCGA-AP-A051-01 | Endometrium | uterine corpus endometrioid carcinoma | Female | >=65 | I/II | Unknown | Unknown | SD | |
| MIA | SNV | Missense_Mutation | rs758349845 | c.137C>T | p.Ser46Phe | p.S46F | Q16674 | protein_coding | tolerated(0.1) | probably_damaging(0.993) | TCGA-B5-A11E-01 | Endometrium | uterine corpus endometrioid carcinoma | Female | <65 | I/II | Unknown | Unknown | SD |
| Page: 1 2 |
Top |
Related drugs of malignant transformation related genes |
| Identification of chemicals and drugs interact with genes involved in malignant transfromation |
| (DGIdb 4.0) |
| Entrez ID | Symbol | Category | Interaction Types | Drug Claim Name | Drug Name | PMIDs |
| 8190 | MIA | GROWTH FACTOR, DRUGGABLE GENOME | TGFBETA1 | 16845326 | ||
| 8190 | MIA | GROWTH FACTOR, DRUGGABLE GENOME | TRP-1 | 15760338 | ||
| 8190 | MIA | GROWTH FACTOR, DRUGGABLE GENOME | LYMPHOKINE-ACTIVATED KILLER CELL | 15386421 |
| Page: 1 |

Copyright 2023-Present -The University of Texas Health Science Center at Houston |